Dynamic Metabolic Regulation: Advanced Biosensor Design for Pathway Optimization and Biomedical Applications
This article provides a comprehensive analysis of transcription factor-based and nucleic acid-based biosensors for dynamic control of metabolic pathways.
Dynamic Metabolic Regulation: Advanced Biosensor Design for Pathway Optimization and Biomedical Applications
Abstract
This article provides a comprehensive analysis of transcription factor-based and nucleic acid-based biosensors for dynamic control of metabolic pathways. Targeting researchers and drug development professionals, it explores foundational principles, advanced methodologies including extended metabolic biosensors and bifunctional circuits, and optimization strategies to overcome stability and robustness challenges. The content further covers validation techniques through comparative analysis and high-throughput screening, synthesizing key insights to outline future directions for clinical translation and therapeutic development.
Core Principles and Natural Paradigms of Metabolic Biosensing
Fundamental Principles and Native Regulatory Roles
Transcription factor-based biosensors (TFBs) are genetically encoded devices that utilize allosteric transcription factors (aTFs) to detect specific small molecules and regulate gene expression in response [1] [2]. In their native biological contexts, aTFs function as fundamental molecular switches within cellular regulatory networks, allowing organisms to adapt to environmental changes by modulating gene expression [1].
These biosensors operate through a simple yet powerful mechanism: the sensing aTF undergoes a conformational change upon binding its target ligand (effector molecule). This allosteric change alters the TF's affinity for specific DNA operator sequences, thereby activating or repressing transcription of downstream genes [2]. The relationship between the effector molecule and the aTF defines its mode of action, which can include repression of activator aTF, activation of repressor aTF, repression of repressor aTF, or activation of activator aTF [1].
Native aTFs play crucial roles in various physiological processes. For instance, in bacteria, they regulate responses to metabolic intermediates, environmental stressors, and signaling molecules. The MerR family TFs, such as MerR and ArsR, respond to heavy metals like mercury and arsenic by modulating expression of detoxification genes [2]. LuxR, a quorum-sensing TF, recognizes acyl-homoserine lactones (AHLs) to coordinate population-level behaviors [2]. These natural regulatory systems provide the foundational components for engineering synthetic biosensing circuits.
Table 1: Native Biological Roles of Selected Bacterial Transcription Factors
| Transcription Factor | Native Ligand/Effector | Native Regulatory Role | Organism Context |
|---|---|---|---|
| ArsR | Arsenic compounds | Activates arsenic detoxification and efflux pathways [2] | Various bacteria |
| MerR | Mercury ions | Regulates mercury resistance operon [2] | Various bacteria |
| LuxR | Acyl-Homoserine Lactones (AHLs) | Controls quorum-sensing and virulence genes [2] | Vibrio fischeri and others |
| TtgR | Flavonoids, antibiotics [3] | Represses multidrug efflux pump expression [3] | Pseudomonas putida |
| MntR | Manganese | Regulates manganese homeostasis [2] | Various bacteria |
Quantitative Characterization of Biosensor Performance
The performance of TF-based biosensors is quantitatively evaluated using several key parameters essential for their application in dynamic metabolic regulation. The dynamic range refers to the fold-change in reporter gene expression between the presence and absence of the inducing ligand, which directly impacts the biosensor's output signal strength [2]. Sensitivity is defined by the lowest ligand concentration that elicits a detectable response, often measured as the EC50 or half-maximal effective concentration [4]. Specificity describes the biosensor's ability to distinguish the target ligand from structurally similar molecules, a critical factor in complex cellular environments [4] [3].
Recent advances in biosensor engineering have significantly improved these parameters. For example, a study developing phenolic acid biosensors established response and sensitivity landscapes for eleven different inducers, with dynamic ranges varying significantly across different sensor-inducer pairs [4]. The Sensor-seq platform enabled the design of TtgR-based biosensors for non-native ligands including tamoxifen derivatives, quinine, and naltrexone, achieving high dynamic range and diverse specificity profiles [3].
Table 2: Key Performance Parameters for Biosensor Characterization
| Performance Parameter | Definition | Measurement Approach | Target Values for Effective Biosensors |
|---|---|---|---|
| Dynamic Range | Fold-change in output signal between induced and uninduced states [2] | Ratio of maximum output to basal leakage | >10-fold (highly desirable) |
| Sensitivity (EC50) | Ligand concentration producing half-maximal response [4] | Dose-response curve fitting | Low µM to nM range (context-dependent) |
| Specificity/Cross-Reactivity | Response to target ligand relative to similar compounds [4] | Screening against ligand panels | Minimal cross-talk with pathway intermediates |
| Orthogonality | Function without interference from host regulatory networks [1] | Testing in different host backgrounds | Minimal host-dependent performance variation |
| Response Time | Time required to reach significant output after induction | Kinetic monitoring | Minutes to hours (application-dependent) |
Experimental Protocol: Implementation of a Phenolic Acid Biosensor
This protocol details the implementation of a biosensor for protocatechuic acid (PCA), based on a identified transcription factor-inducible promoter pair, for high-throughput screening as described by [4].
Materials and Equipment
- Bacterial Strains: Escherichia coli DH10B or other appropriate host strains
- Plasmid Vector: Low-copy number plasmid with multiple cloning site
- Reporter Gene: GFP, RFP, or an antibiotic resistance gene
- Inducer Stock Solutions: 100 mM protocatechuic acid in DMSO or buffer
- Growth Media: LB or M9 minimal media with appropriate antibiotics
- Equipment: Microplate reader, flow cytometer, or spectrophotometer
Procedure
Day 1: Strain Preparation
- Transform the biosensor plasmid into the selected E. coli host strain using standard transformation protocols.
- Plate transformed cells on LB agar containing appropriate antibiotics and incubate overnight at 37°C.
Day 2: Culture Inoculation
- Pick single colonies to inoculate 2 mL liquid cultures with antibiotics.
- Grow overnight at 37°C with shaking at 250 rpm.
Day 3: Biosensor Assay
- Dilute overnight cultures 1:100 in fresh medium with antibiotics.
- Aliquot 200 µL of diluted culture into a 96-well microplate.
- Add protocatechuic acid to final concentrations ranging from 0 µM to 1000 µM (include DMSO-only vehicle controls).
- Incubate the microplate at 37°C with continuous shaking in a microplate reader.
- Measure optical density (OD600) and fluorescence (excitation/emission appropriate for reporter) every 30 minutes for 12-16 hours.
Day 4: Data Analysis
- Normalize fluorescence measurements to cell density (fluorescence/OD600).
- Calculate fold-induction by dividing normalized fluorescence in induced conditions by that in uninduced controls.
- Plot dose-response curves and calculate EC50 values using appropriate software.
Troubleshooting Notes
- High Background Signal: Optimize promoter strength or RBS sequences to reduce basal expression [2].
- Low Dynamic Range: Test different reporter genes or consider engineering the TF DNA-binding site [2].
- Variable Response: Ensure consistent growth conditions and cell density at induction.
Experimental Protocol: Sensor-seq for High-Throughput Biosensor Screening
This protocol outlines the Sensor-seq method for massively parallel screening of aTF variants, enabling identification of biosensors for non-native ligands [3].
Materials and Equipment
- Library Construction: Oligonucleotide pool encoding aTF variants, Golden Gate Assembly reagents
- Barcoding System: Randomized 16N barcode sequences
- Screening: RNA stabilization reagents, RNA extraction kit, cDNA synthesis kit
- Sequencing: High-throughput sequencing platform (Illumina)
- Ligands: Target ligands of interest and appropriate vehicle controls
Procedure
Stage 1: Library Construction and Barcoding
- Design a mutagenesis library targeting the ligand-binding domain of selected aTF scaffold (e.g., TtgR).
- Construct plasmid library where each aTF variant is paired with random barcodes in the reporter transcript.
- Transform library into host cells and ensure sufficient coverage (>1000x library diversity).
Stage 2: Pooled Screening with Ligands
- Divide the library culture into aliquots for each test ligand and vehicle control.
- Treat with target ligands (e.g., 1 mM naltrexone, quinine) or vehicle control during mid-log phase.
- Incubate for precisely 2 hours to allow transcriptional response.
- Harvest cells and stabilize RNA immediately.
Stage 3: RNA Sequencing and Analysis
- Extract total RNA and prepare cDNA libraries.
- Perform deep sequencing of barcode regions from both cDNA (reporter expression) and plasmid DNA (variant abundance).
- Calculate F-scores for each variant: Normalized ratio of reporter transcript levels (ligand+/ligand-).
- Identify functional biosensors based on F-score threshold (typically >2-3 fold induction).
Data Interpretation
- Variants with F-scores ~1 are constitutively ON or OFF and should be discarded.
- Variants with F-scores >1 in ligand-treated conditions are potential hits.
- Validate top hits using clonal assays (e.g., flow cytometry, qRT-PCR).
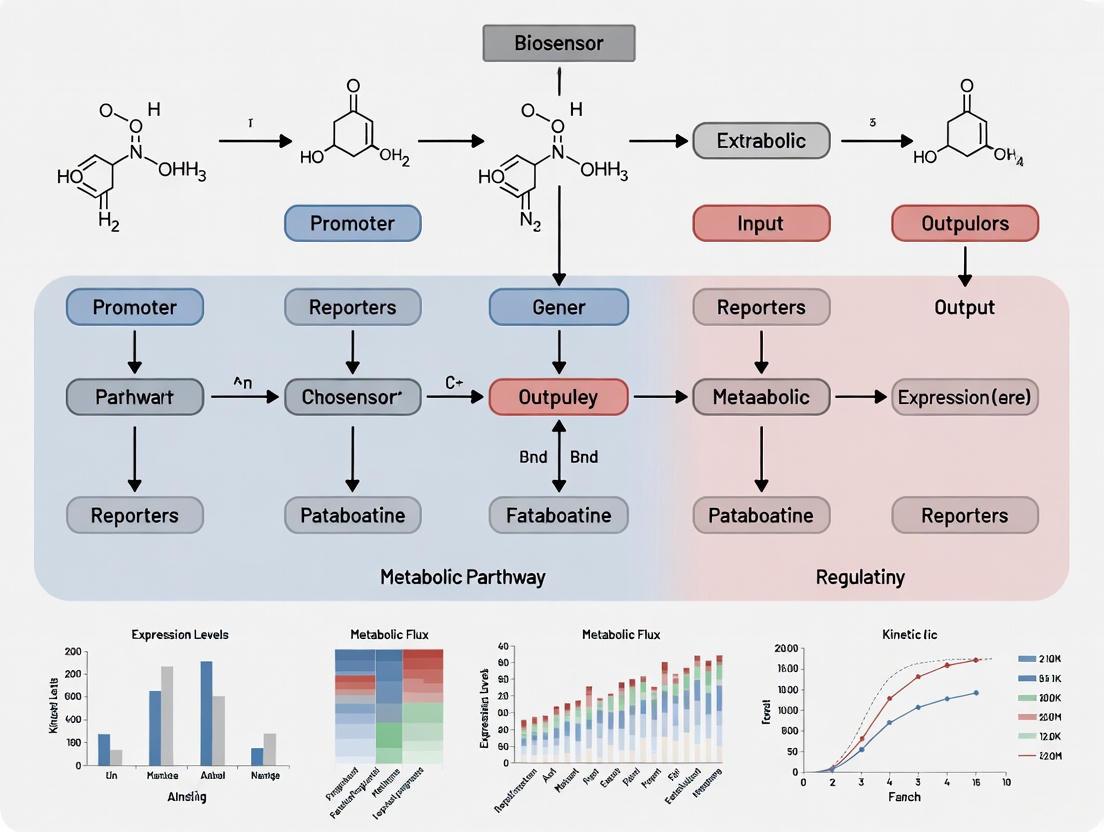
Visualizing Biosensor Mechanisms and Workflows
Biosensor Mechanism
Sensor-seq Workflow
The Scientist's Toolkit: Essential Research Reagents
Table 3: Key Research Reagent Solutions for TFB Development
| Reagent/Category | Specific Examples | Function/Application |
|---|---|---|
| Transcription Factor Scaffolds | TtgR, TetR, AraC, LuxR [1] [3] | Protein scaffolds for engineering ligand specificity |
| Reporter Genes | GFP, RFP, LacZ, Luciferase [2] | Quantifiable output for biosensor response |
| Host Strains | E. coli, P. putida, C. necator [4] | Chassis for biosensor implementation and testing |
| Database Resources | RegulonDB, PRODORIC, GroovDB [1] [3] | Curated information on natural TF-regulatory networks |
| Library Construction Tools | Golden Gate Assembly, Oligo pools [3] | High-throughput variant generation |
| Screening Methods | Sensor-seq, FACS, microplate readers [4] [3] | Identification and characterization of functional biosensors |
Dynamic control of metabolic pathways is essential for developing efficient microbial cell factories, moving beyond traditional static regulation that often leads to metabolic imbalances and suboptimal productivity [5] [6]. Nucleic acid-based biosensors—specifically riboswitches, aptamers, and ribozymes—have emerged as powerful tools for real-time metabolic monitoring and regulation. These RNA elements provide a compact, protein-independent means of sensing intracellular metabolites and dynamically controlling gene expression, offering significant advantages in applications ranging from high-throughput strain screening to intelligent metabolic pathway control [7] [5]. Their modular nature, minimal metabolic burden, and ability to be integrated into complex genetic circuits make them particularly valuable for optimizing the production of biofuels, pharmaceuticals, and fine chemicals [8] [9].
Table 1: Performance Characteristics of Nucleic Acid-Based Biosensors
| Biosensor Type | Sensing Principle | Dynamic Range | Response Time | Key Advantages |
|---|---|---|---|---|
| Riboswitches | Ligand-induced RNA conformational change affects translation | Tunable, up to ~14-fold gain [10] | Fast, reversible | Compact; integrates well into metabolic regulation [5] |
| Aptamers | Ligand binding to structured RNA/DNA elements | Varies by design (e.g., KD = 0.1 µM for theophylline aptamer) [10] | Rapid | High specificity; selectable via SELEX for diverse targets [10] |
| Ribozymes/Aptazymes | Self-cleaving catalytic RNA controlled by ligand binding | High (e.g., ~90% reduction in GFP expression) [10] | Very fast | Cis-acting; minimal off-target effects [7] |
| Toehold Switches | Base-pairing with trigger RNA activates translation | High specificity; programmable | Fast | Enables logic-based pathway control [5] |
Fundamental Mechanisms and Molecular Design
Riboswitch Architecture and Operating Principles
Riboswitches are structured non-coding RNA elements typically 34–200 nucleotides long, located in untranslated regions (UTRs) of mRNA [8]. They consist of two primary domains: a sensing aptamer domain that binds specific ligands with high affinity and specificity, and an expression platform that regulates gene expression in response to ligand-induced conformational changes [7] [8]. This modular architecture allows riboswitches to control various post-transcriptional processes including translation initiation, mRNA stability, and transcription termination [7]. Natural riboswitches have been identified that respond to fundamental metabolites including nucleotides (guanine, adenine), amino acids (lysine, glycine, glutamine), enzyme cofactors (thiamine pyrophosphate, FMN, tetrahydrofolate), and ions (fluoride) [11]. The binding of these ligands induces structural rearrangements in the RNA that ultimately determine the regulatory outcome.
Aptamer Recognition and Ribozyme Catalysis
Aptamers are structured nucleic acid sequences (typically 30-80 nucleotides) that bind specific molecular targets with high affinity and selectivity, often rivaling antibodies [10] [12]. They are typically generated through Systematic Evolution of Ligands by EXponential Enrichment (SELEX), an iterative in vitro selection process that can yield binders for virtually any target molecule [7] [8]. The canonical theophylline aptamer, for instance, features a core of fifteen conserved residues organized into two internal loops that undergo conformational changes upon drug binding, with dissociation constants (K_D) in the micromolar range [10].
Ribozymes are catalytic RNA molecules that catalyze biochemical reactions, particularly the cleavage and ligation of phosphodiester bonds [10] [12]. When aptamers are fused to these self-cleaving RNA structures, they form aptazymes (allosteric ribozymes) whose catalytic activity becomes controlled by ligand binding [10]. Commonly used ribozyme scaffolds include hammerhead ribozymes (HHR), hepatitis delta virus (HDV) ribozymes, and glmS ribozymes [10] [12]. The modular nature of aptazymes enables the construction of sophisticated regulatory devices that respond to intracellular metabolite concentrations.
Figure 1: Aptazyme Architecture. Aptamers fused to ribozymes create ligand-responsive aptazymes for metabolic control.
Application Notes: Implementation in Metabolic Engineering
Dynamic Pathway Regulation
Nucleic acid biosensors enable autonomous control of metabolic fluxes by responding to intracellular metabolite levels. A key example includes the re-engineering of a natural lysine riboswitch from Escherichia coli from an OFF- to an ON-switch to control lysine transport in Corynebacterium glutamicum, resulting in significantly increased lysine yield [7]. This approach demonstrates how riboswitches can be leveraged to dynamically regulate metabolic pathways without requiring external intervention. Similarly, riboswitches have been integrated into central metabolic pathways to balance carbon flux between competing pathways, such as glycolysis, pentose phosphate pathway, and shikimate pathway, preventing the accumulation of toxic intermediates and improving overall pathway efficiency [6].
High-Throughput Screening of Strain Libraries
Aptamer-based RNA sensors coupled with fluorescent outputs enable rapid screening of high-producing microbial strains. By linking metabolite concentrations to fluorescence intensity via riboswitch-controlled expression of reporter genes, researchers can employ fluorescence-activated cell sorting (FACS) to isolate top-performing variants from large combinatorial libraries [10] [9]. This approach was successfully implemented using a theophylline-responsive ribozyme modified with an aptamer insertion to screen for enzyme variants with enhanced activity [10]. Specifically, a theophylline-responsive riboswitch was used to screen for caffeine demethylase activity in S. cerevisiae, leading to the identification of mutations that significantly increased both enzyme activity and selectivity [10].
Table 2: Experimental Implementation of Nucleic Acid Biosensors
| Application Area | Biosensor Design | Host Organism | Performance Outcome |
|---|---|---|---|
| Lysine production | Re-engineered lysine riboswitch (OFF to ON) | Corynebacterium glutamicum | Significant increase in lysine yield [7] |
| Enzyme evolution | Theophylline-responsive HHR with aptamer | Saccharomyces cerevisiae | Identified mutants with enhanced activity and selectivity [10] |
| Disease modeling | Tetracycline-controlled aptazyme in 3'UTR | Caenorhabditis elegans | Regulated expression of Huntington disease protein [7] |
| Artificial cellular communication | Histamine riboswitch controlling cargo release | Artificial cells | Imitated bacterial quorum sensing [7] |
| Central metabolism regulation | Pyruvate-responsive biosensor with PdhR transcription factor | Escherichia coli | Enhanced production of trehalose and 4-hydroxycoumarin [6] |
Integration with CRISPR-Cas Systems
Recent advances have combined nucleic acid biosensors with CRISPR-Cas technologies to create highly precise genetic regulation systems. In one approach, CRISPR-Cas was used to insert a synthetic exon controlled by a tetracycline-responsive riboswitch into the endogenous CD20 locus in B lymphocytes [7]. This design enabled investigation of B-cell behavior at different CD20 expression levels, revealing new insights into membrane protein organization [7]. The fusion of RNA-based sensing with DNA-targeting capabilities expands the toolbox for metabolic engineers seeking multidimensional control over cellular functions.
Experimental Protocols
Protocol 1: Implementation of a Theophylline-Responsive Riboswitch in S. cerevisiae
Purpose: To regulate gene expression in response to theophylline using an aptamer-integrated hammerhead ribozyme (aptazyme) in the 3'UTR of a target gene.
Reagents and Materials:
- Yeast expression vector with target gene
- Theophylline aptamer sequence (e.g., mTCT8-4 [10])
- Hammerhead ribozyme scaffold
- Communication module (transmitter sequence)
- Theophylline (1-10 mM stock solution in DMSO)
- S. cerevisiae strain (e.g., BY4741)
Procedure:
- Aptazyme Construction: Clone the theophylline aptamer into stem II of the hammerhead ribozyme using a communication module [10].
- Vector Assembly: Integrate the constructed aptazyme into the 3'UTR of your gene of interest in a yeast expression vector.
- Transformation: Introduce the constructed vector into S. cerevisiae using standard lithium acetate transformation.
- Induction and Measurement:
- Grow transformed yeast in appropriate selective medium to mid-log phase.
- Add theophylline to final concentrations ranging from 0.1-10 mM.
- Incubate for 4-24 hours and measure output (e.g., fluorescence, enzyme activity).
- Characterization: Determine the dynamic range by comparing output levels in the presence and absence of theophylline.
Technical Notes: The communication module is critical for effective allosteric control. Optimal theophylline concentrations typically range from 1-10 mM in yeast [10]. Expected outcomes include up to 14-fold induction in fluorescence for properly functioning AND-gate ribozymes [10].
Protocol 2: Dynamic Metabolic Control Using a Lysine Riboswitch
Purpose: To dynamically regulate metabolic flux in bacterial systems using a natural lysine riboswitch re-engineered for ON-function.
Reagents and Materials:
- Natural lysine riboswitch from E. coli [7] [11]
- Bacterial expression vector
- Corynebacterium glutamicum strains
- Lysine standard solutions
- Analytical equipment for lysine quantification (HPLC)
Procedure:
- Riboswitch Engineering: Modify the natural lysine riboswitch through mutagenesis to convert from OFF- to ON-function [7].
- Pathway Integration: Place the engineered riboswitch upstream of lysine transport or biosynthetic genes.
- Strain Transformation: Introduce the construct into C. glutamicum.
- Fermentation and Analysis:
- Grow engineered strains in production medium.
- Monitor lysine accumulation over time.
- Compare performance with control strains lacking riboswitch regulation.
- Optimization: Fine-tune riboswitch response by adjusting ribosome binding sites or linker sequences.
Technical Notes: Structural studies reveal the lysine riboswitch features an intricate architecture involving three-helical and two-helical bundles connected by a five-helical junction [11]. Recognition is governed by shape complementarity with multiple direct and K+-mediated hydrogen bonds to lysine's charged ends [11].
Figure 2: Riboswitch Development Workflow. Iterative process for developing functional riboswitches.
The Scientist's Toolkit: Essential Research Reagents
Table 3: Key Research Reagent Solutions for Nucleic Acid Biosensor Implementation
| Reagent/Category | Specific Examples | Function/Application | Implementation Notes |
|---|---|---|---|
| Aptamer Sequences | Theophylline aptamer (mTCT8-4), Tetracycline aptamer | Sensory domain for ligand recognition | Core conserved residues essential for binding (e.g., C27 in theophylline aptamer) [10] |
| Ribozyme Scaffolds | Hammerhead (HHR), HDV, twister, glmS ribozymes | Catalytic domain for post-transcriptional control | HHR most commonly used; integrate into 3'UTR for mRNA stability control [10] |
| Communication Modules | Transmitter sequences | Link aptamer and ribozyme for allosteric control | Critical for effective coupling; position between aptamer and ribozyme domains [10] |
| Selection Technology | SELEX (Systematic Evolution of Ligands by EXponential Enrichment) | De novo aptamer generation | Enables development of aptamers against novel targets [7] [8] |
| Computational Tools | Structure prediction algorithms, Molecular modeling | Virtual screening and rational design | Reduces experimental screening burden; enables structure-based optimization [8] |
| Expression Platforms | 5'UTR, 3'UTR, intronic sequences, synthetic exons | Context for biosensor integration | 3'UTR positioning useful for aptazymes; synthetic exons enable splicing control [7] |
Performance Evaluation and Optimization Strategies
Critical Performance Metrics
Evaluating nucleic acid biosensors requires assessment of multiple performance parameters. Dynamic range refers to the ratio between maximal and minimal output signals, with effective riboswitches typically achieving 5- to 20-fold regulation [10] [5]. The operating range defines the ligand concentration window over which the biosensor functions optimally, while response time indicates how quickly the system reacts to metabolite changes [5]. Signal-to-noise ratio must be sufficiently high to enable reliable distinction between states, particularly for screening applications [5]. Additionally, orthogonality—the biosensor's ability to function without cross-talk in complex cellular environments—is essential for implementation in metabolic engineering.
Optimization Methodologies
Biosensor performance can be enhanced through both experimental and computational approaches. Rational tailoring using structure-guided mutagenesis can improve affinity, specificity, and dynamic range [8]. For instance, modifying communication modules between aptamer and expression platforms can significantly alter regulatory behavior [10]. High-throughput screening of mutant libraries using FACS enables directed evolution of improved biosensor variants [10] [8]. Computational approaches including structure prediction and molecular dynamics simulations help identify optimization targets by modeling ligand binding and conformational changes [8]. Context-dependent performance issues can be addressed by engineering insulator sequences or testing multiple genomic integration sites to minimize positional effects.
Nucleic acid-based biosensors represent versatile and powerful tools for dynamic metabolic control, offering unique advantages including compact size, minimal metabolic burden, and modular architecture. As the field advances, integration of computational design with high-throughput experimental validation will enable development of biosensors with enhanced performance characteristics [8]. Emerging opportunities include the construction of multi-input biosensors responding to multiple metabolites, integration with machine learning for predictive metabolic control, and application in therapeutic contexts for smart drug delivery [5] [9]. By providing precise, real-time regulation of metabolic fluxes, these RNA-based devices will play an increasingly important role in next-generation metabolic engineering strategies for sustainable bioproduction.
Transcription factor (TF)-based biosensors are fundamental components in synthetic biology for dynamically regulating metabolic pathways. Extended metabolic biosensors represent an advanced class of genetic circuits that cascade a bio-conversion pathway with a transcription factor responsive to a downstream effector metabolite [13]. This architecture significantly expands the sensing capabilities of natural biosensors, enabling the detection of non-native effector molecules and facilitating context-aware dynamic control in microbial cell factories [13].
These systems are particularly valuable for addressing a central challenge in metabolic engineering: static control strategies that optimize pathway expression under fixed conditions often fail to maintain optimal performance when confronted with industrial bioreactor fluctuations, leading to suboptimal titers, yield, and productivity [13]. Extended biosensors overcome this limitation by providing a dynamic feedback mechanism that allows the production host to self-regulate metabolic fluxes in response to internal metabolite levels.
This document provides application notes and detailed protocols for implementing extended TF-based biosensors, using the flavonoid naringenin biosynthesis pathway in Escherichia coli as a primary case study. The content is framed within a broader research thesis on designing robust biosensor systems for dynamic metabolic pathway regulation.
Application Notes: Naringenin Production Case Study
Pathway and Biosensor Architecture
The naringenin biosynthesis pathway from the precursor L-tyrosine consists of four enzymatic steps [13]. In an extended biosensor configuration, the pathway is coupled with a transcription factor that senses a downstream metabolite, creating a closed-loop regulatory system.
Key Pathway Enzymes and Sensing Components:
| Component | Type | Function in Pathway/Biosensor |
|---|---|---|
| TAL | Enzyme | Converts L-tyrosine to p-coumaric acid |
| 4CL | Enzyme | Activates p-coumaric acid to p-coumaroyl-CoA |
| CHS | Enzyme | Condenses p-coumaroyl-CoA with malonyl-CoA to form naringenin chalcone |
| CHI | Enzyme | Isomerizes naringenin chalcone to naringenin |
| Transcription Factor (TF) | Sensing | Binds to a specific downstream effector metabolite (e.g., naringenin or derivative) |
| Inducible Promoter | Regulation | Controls expression of upstream pathway genes in response to TF-effector binding |
The selection of the TF is critical. The effector molecule for the TF must be a metabolite that is reachable from the target product (naringenin) via enzymatic transformations and must fall within the set of known effector metabolites that can induce a transcriptional response [13]. With approximately 750 known small-molecule chemical effectors for transcription factors, the design space for such circuits is substantial [13].
Quantitative Performance Data
Reported performance metrics for naringenin production and biosensor-controlled pathways provide benchmarks for expected outcomes.
Table 1: Reported Naringenin Production Metrics in E. coli
| Strain/Strategy | Maximum Titer (mg L⁻¹) | Key Features | Citation |
|---|---|---|---|
| Optimized Static Production | ~200 - 474 | Host optimization, precursor feeding | [13] |
| Theoretical Maximum (Simulation) | ~800 (in 48 h) | Projected from L-tyrosine yield optimization (0.44 g/g glucose) | [13] |
Table 2: Biosensor Performance Characteristics for Key Metabolites
| Sensed Parameter | Example Sensor | EC₅₀ | Dynamic Range (ΔF/Fmin) | Positive Control Treatment |
|---|---|---|---|---|
| NADH/NAD+ Ratio | SoNar | 0.025 | 15 | Antimycin A, FCCP [14] |
| ATP/ADP Ratio | PercevalHR | 3.5 | 3 | Oligomycin, Glucose withdrawal [14] |
| ATP | iATPSnFR | 150 µM | 2.4 | Oligomycin, Glucose withdrawal [14] |
Integration with Robust Control Circuits
A key advancement is integrating extended biosensors with feedback controllers like the antithetic integral circuit to enhance robustness against environmental fluctuations [13]. This combination helps maintain pathway stability and consistent product output despite perturbations in industrial-scale bioreactors, such as nutrient gradients or pH shifts. The dynamic response of a regulated flavonoid pathway demonstrates this improved operational stability [13].
Experimental Protocols
Protocol: Designing an Extended Biosensor for a Target Product
Objective: To computationally design an extended metabolic biosensor circuit for a desired target product (e.g., naringenin).
Materials:
- Bioinformatics Databases: SensiPath [13] or similar tools for in silico screening of the extended metabolic space.
- Metabolic Network Model: A genome-scale model of the host organism (e.g., E. coli).
- TF Effector Database: A curated list of known transcription factors and their cognate effector molecules [13].
Procedure:
- Define the Target: Identify the chemical structure of the target product (e.g., naringenin).
- Identify Reachable Metabolites: Use bioinformatics tools (e.g., SensiPath) to enumerate all metabolites that can be enzymatically produced from the target product. This forms the set of reachable metabolites [13].
- Intersect with TF Effectors: Compare the set of reachable metabolites against the database of known TF effector molecules. The intersection defines potential effector metabolites for the biosensor [13].
- Pathway Selection: For each candidate effector metabolite, identify the minimal enzymatic cascade (one or more enzymatic steps) required to convert the target product into the effector.
- Circuit Assembly: Design the genetic circuit such that:
- The enzymatic cascade for the effector conversion is expressed constitutively or under a separate promoter.
- The TF gene is expressed constitutively.
- The output of the TF (activated by the effector) regulates the promoter controlling key genes in the biosynthesis pathway of the target product.
Protocol: Implementing a Regulated Naringenin Pathway in E. coli
Objective: To clone and test an extended biosensor circuit for dynamic regulation of naringenin production in E. coli.
Materials:
- Strains: E. coli chassis strain with enhanced L-tyrosine production (e.g., engineered for precursor availability) [13].
- Plasmids: Cloning vectors compatible with inducible expression and pathway assembly (e.g., pET, pBAD derivatives).
- Genes: Codon-optimized genes for TAL, 4CL, CHS, CHI, and the selected TF.
- Media: M9 minimal media or LB media supplemented with appropriate antibiotics and carbon sources (e.g., glucose).
- Inducers/Inhibitors: Chemicals for positive controls based on the sensor used (e.g., Antimycin A for NADH/NAD+ sensors, Oligomycin for ATP/ADP sensors) [14].
Procedure:
- Strain Engineering:
- Assemble the naringenin pathway genes (TAL, 4CL, CHS, CHI) into one or more expression vectors. Strong, constitutive promoters can be used initially for proof-of-concept.
- Clone the extended biosensor module. This includes the gene for the conversion enzyme(s) that transform naringenin into the TF effector, and the TF itself under a constitutive promoter.
- Place a key rate-limiting gene of the naringenin pathway (e.g., TAL) under the control of the TF-responsive promoter.
- Co-transform or sequentially transform the pathway and biosensor constructs into the production E. coli host.
Cultivation and Induction:
- Inoculate primary cultures from single colonies and grow overnight.
- Dilute secondary cultures to a standard OD₆₀₀ (e.g., 0.05) in fresh media.
- Incubate cultures at suitable conditions (e.g., 37°C, 250 rpm). Induction might be necessary if inducible promoters are used for the initial pathway expression.
Monitoring and Sampling:
- Monitor cell growth (OD₆₀₀) periodically.
- Sample the culture broth at regular intervals (e.g., every 3-6 hours over 48-72 hours).
- Centrifuge samples to separate cells from supernatant for product analysis.
Analytical Methods:
- Product Quantification: Analyze the supernatant using High-Performance Liquid Chromatography (HPLC) or LC-MS to quantify naringenin and key intermediate (e.g., p-coumaric acid) concentrations. Compare titers and yields against control strains lacking the biosensor.
- Sensor Response Validation: If the TF is fused to a reporter (e.g., GFP), measure fluorescence periodically using a plate reader or flow cytometry to correlate effector levels with regulatory output.
Robustness Assessment: Subject the regulated strain and a statically controlled strain to environmental perturbations (e.g., temperature shifts, substrate pulsing) and compare the stability of naringenin production.
The Scientist's Toolkit: Research Reagent Solutions
Table 3: Essential Research Reagents for Extended Metabolic Biosensor Development
| Reagent / Material | Function / Application | Examples / Notes |
|---|---|---|
| Sensing Domains | ||
| Transcription Factors (TFs) | Core sensing element; binds specific effector metabolite | Libraries available from natural sources; can be engineered via directed evolution [13] [15] |
| RNA Switches (Aptamers) | Nucleic acid-based sensing; regulates translation or transcription | Riboswitches, ribozymes; useful for metabolites without known TFs [15] |
| Genetic Parts | ||
| Inducible Promoters | Provides regulatory control point for pathway genes | TF-responsive promoters (e.g., PLux, PTet); strength tunable via RBS engineering [13] |
| Fluorescent Reporter Proteins | Quantitative readout of biosensor activity and dynamic range | GFP, RFP; enables high-throughput screening [14] [15] |
| Host Organisms | ||
| Escherichia coli | Common bacterial chassis for pathway prototyping | Well-characterized genetics; high transformation efficiency [13] |
| Saccharomyces cerevisiae | Eukaryotic yeast host; suited for complex plant pathways | Bacillus subtilis used for N-acetylglucosamine production [15] |
| Engineering & Screening Tools | ||
| Directed Evolution Platforms | Optimizes biosensor properties (sensitivity, dynamic range) | Used to develop sensors with novel ligand specificity or improved performance [13] [15] |
| High-Throughput Screening (HTS) | Enables rapid sorting of high-producing strains or enzyme variants | FACS-based screening when coupled with fluorescent reporters [15] |
| Analytical Equipment | ||
| HPLC / LC-MS | Quantifies target metabolite titers and pathway intermediates | Essential for validating production metrics and pathway flux [13] |
| Fluorescence Microscope/Plate Reader | Measures biosensor output (e.g., FRET, intensity changes) | Used for real-time, compartment-specific metabolite measurements [14] |
Workflow and Pathway Visualization
Diagram 1: Extended biosensor logical workflow for naringenin production.
Central Carbon Metabolism (CCM) serves as the fundamental conduit for carbon distribution in living cells, generating energy, reducing power, and critical precursor metabolites that fuel biosynthetic pathways. In metabolic engineering, optimizing the flux through CCM is paramount for achieving economically viable production of value-added compounds. The intermediates of CCM—such as acetyl-CoA, erythrose-4-phosphate, and pyruvate—act as key nodes from which flux can be diverted toward the synthesis of a diverse range of products, including pharmaceuticals, biofuels, and biopolymers. The emergence of sophisticated biosensor technology has revolutionized our ability to monitor and dynamically regulate the concentrations of these pivotal metabolites, enabling real-time pathway optimization and high-throughput strain screening. This document details the critical metabolite targets, their derivative pathways, and provides specific application protocols for their analysis and engineering within a research framework focused on biosensor design for dynamic metabolic pathway regulation.
Key Metabolite Targets and Their Value-Added Products
The following tables summarize the primary metabolite targets derived from central carbon metabolism, their roles in biosynthesis, and the value-added products they can generate.
Table 1: Key CCM Intermediates and Their Biosynthetic Roles
| Metabolite Target | Central Metabolic Pathway | Primary Biosynthetic Role | Representative Host Organisms |
|---|---|---|---|
| Acetyl-CoA | Glycolysis, TCA Cycle | Primary building block for lipids, polyketides, terpenoids, and fatty acid-derived compounds | S. cerevisiae, E. coli, Y. lipolytica |
| Erythrose-4-phosphate (E4P) | Pentose Phosphate Pathway (PPP) | Essential precursor for the shikimate pathway and aromatic amino acids | S. cerevisiae, E. coli |
| Pyruvate | Glycolysis | Precursor for alcohols, organic acids, and branched-chain amino acids | E. coli, C. glutamicum, S. cerevisiae |
| Phosphoenolpyruvate (PEP) | Glycolysis | High-energy metabolite; precursor for the shikimate pathway and aromatic compounds | E. coli, C. glutamicum |
| Glucose-6-Phosphate (G6P) | Glycolysis, PPP | Node metabolite directing flux to glycolysis or PPP; precursor for nucleotides | S. cerevisiae, E. coli |
Table 2: Value-Added Products Derived from Key Metabolites
| Key Metabolite | Value-Added Product | Product Category/Application | Maximum Reported Titer (Example) |
|---|---|---|---|
| Acetyl-CoA | Fatty Acids / Fatty Acid Ethyl Esters (FAEE) | Biofuels | 5100 g/CDW [16] |
| Acetyl-CoA | Farnesene | Biofuel, Chemicals | 25% increase via CCM optimization [16] |
| Acetyl-CoA | Polyhydroxybutyrate (PHB) | Bioplastics | 56.4 mg/g (from ethanol) [16] |
| Acetyl-CoA | 3-Hydroxypropionic Acid (3-HP) | Platform Chemical | 864.5 mg/L in yeast [16] |
| Erythrose-4-phosphate (E4P) | p-Hydroxycinnamic Acid | Aromatic Compound, Nutraceutical | 12.5 g/L in yeast [16] |
| Erythrose-4-phosphate (E4P) | Naringenin | Flavonoid, Pharmaceutical | ~200 mg/L - 474 mg/L in E. coli [13] |
| Erythrose-4-phosphate (E4P) | Tyrosol / Salidroside | Phenolic Antioxidants | >10 g/L (total) in yeast [16] |
| Pyruvate | L-Lysine | Amino Acid, Feed Additive | Global demand ~1.5 million tons/year [17] |
Workflow for Metabolite Engineering and Biosensor Application
The following diagram outlines a generalized workflow for engineering microbial cell factories, from identifying a key metabolite to implementing biosensor-driven dynamic regulation.
Application Notes & Protocols
Protocol 1: Dynamic Regulation of Naringenin Biosynthesis Using an Extended Metabolic Biosensor
Background: Naringenin is a flavonoid with significant pharmacological properties and serves as a central scaffold for diverse flavonoids. Its production in E. coli from the precursor L-tyrosine involves a four-step enzymatic pathway. A major challenge is flux imbalance, leading to suboptimal titers. This protocol describes the implementation of an extended metabolic biosensor coupled with an antithetic integral feedback controller to dynamically regulate the pathway, ensuring robustness against environmental perturbations [13].
Key Metabolites & Pathway: L-tyrosine → p-Coumaric Acid → p-Coumaroyl-CoA → Naringenin
Experimental Objectives:
- To design an extended biosensor that converts naringenin (or a key intermediate) into an effector molecule recognized by a transcription factor (TF).
- To integrate the biosensor with an antithetic controller that adjusts the expression of pathway enzymes in response to metabolite levels.
- To evaluate the dynamic response and production titer of the engineered strain under industrial bioreactor conditions.
Materials:
- Strain: E. coli chassis engineered with the heterologous naringenin pathway.
- Plasmids:
- Sensor Plasmid: Harbors the genes for the extended metabolic pathway (converting target metabolite to TF effector) and the TF-regulated reporter/output gene.
- Controller Plasmid: Contains the antithetic integral circuit components (e.g., two antagonistic proteins that provide integral feedback).
- Actuator Plasmid: Expresses the key naringenin pathway enzymes under the control of the TF-regulated promoter.
- Media: M9 minimal media or similar, supplemented with glucose and appropriate antibiotics.
- Equipment: Bench-top bioreactor, spectrophotometer (for OD600), HPLC system for naringenin quantification.
Procedure:
- Biosensor Circuit Design:
- Select a TF whose natural effector is structurally related to a downstream derivative of naringenin. If no direct match exists, use databases like SensiPath [13] to computationally design a short, heterologous metabolic pathway that converts naringenin into a known TF effector.
- Clone the genes for this "extended" converter pathway and the TF under a constitutive promoter.
- Place a fluorescent reporter gene (e.g., GFP) or an actuator gene under a promoter specifically regulated by the chosen TF.
Integration with Antithetic Controller:
- Co-transform the biosensor plasmid with an antithetic controller plasmid. A common antithetic circuit involves two proteins, 'z1' and 'z2', that neutralize each other. The sensor output (e.g., TF activity) promotes the production of 'z1', while 'z2' is constitutively expressed. The difference in their concentrations provides an integral feedback signal [13].
- This feedback signal is used to drive the expression of a critical enzyme in the naringenin pathway (e.g., tyrosine ammonia-lyase), creating a closed-loop system.
Cultivation and Analysis:
- Inoculate the engineered strain in a bioreactor to allow precise control of environmental parameters like nutrient feed and pH.
- Induce pathway expression during the mid-exponential phase.
- Monitor: Track cell density (OD600), fluorescence from the biosensor (if applicable), and naringenin concentration via HPLC over 48-72 hours.
- Perturbation Test: Introduce a deliberate perturbation (e.g., a pulse of substrate or a temperature shift) to assess the system's robustness. A well-tuned controller will maintain stable production and quickly return to set-point after the perturbation.
Troubleshooting:
- Low Dynamic Range: Optimize the biosensor by engineering regulatory elements (e.g., RBS libraries, promoter strength) or using directed evolution on the TF [13] [17].
- Unstable Control: Re-tune the expression levels of the antithetic controller components (z1 and z2) to achieve a stable steady-state.
- Host Burden: Consider genome integration of the circuit components to reduce plasmid copy number variation and improve genetic stability.
Protocol 2: Rewiring Central Carbon Metabolism using a Heterologous Phosphoketolase (PHK) Pathway
Background: The native glycolysis and pentose phosphate pathway (PPP) in S. cerevisiae can lead to inefficient carbon flux toward certain precursors like acetyl-CoA and erythrose-4-phosphate (E4P). Introducing the heterologous phosphoketolase (PHK) pathway creates a shortcut that directly converts fructose-6-phosphate (F6P) and xylulose-5-phosphate (X5P) into acetyl-CoA, bypassing several steps in central metabolism. This rearrangement increases the supply of acetyl-CoA for lipid-based products and can indirectly boost E4P supply for aromatic compound synthesis [16].
Key Metabolites & Pathway: F6P/X5P → (Phosphoketolase) → Acetyl-P → (Phosphotransacetylase) → Acetyl-CoA
Experimental Objectives:
- To introduce the PHK pathway into a yeast production chassis.
- To measure the resulting rearrangement of carbon flux in CCM.
- To quantify the increase in yield of the target product (e.g., fatty acids, E4P-derived compounds).
Materials:
- Strain: S. cerevisiae production chassis (e.g., for fatty acids or p-hydroxycinnamic acid).
- Genes: Codon-optimized genes for phosphoketolase (PK) and phosphotransacetylase (PTA).
- Media: Synthetic Defined (SD) medium with glucose as carbon source.
- Equipment: Shaking incubator, GC-MS or LC-MS for metabolic flux analysis, HPLC for product quantification.
Procedure:
- Strain Construction:
- Assemble an expression cassette containing the PK and PTA genes under strong, constitutive promoters.
- Integrate this cassette into the genome of the host production strain or express it on a plasmid.
Flux Analysis (¹³C Tracing):
- Grow the engineered strain and a control strain (without PHK pathway) in SD medium with ¹³C-labeled glucose (e.g., [1-¹³C] glucose).
- Harvest cells during mid-exponential phase and quench metabolism rapidly.
- Extract intracellular metabolites and analyze using GC-MS or LC-MS to determine the labeling patterns in intermediates of glycolysis, PPP, and TCA cycle. This data will confirm the redirection of flux through the PHK pathway.
Product Yield Assessment:
- Perform fed-batch fermentations in bioreactors for both the engineered and control strains.
- Monitor glucose consumption and cell growth.
- Quantify the final titer of the target product (e.g., free fatty acids, p-hydroxycinnamic acid) and calculate the yield on glucose. Expect a significant increase in the engineered strain [16].
Troubleshooting:
- No Flux Increase: Verify the enzymatic activity of PK and PTA in vitro. Check for potential metabolic bottlenecks downstream of acetyl-CoA (e.g., acetyl-CoA carboxylase activity for fatty acid synthesis).
- Redox Imbalance: The PHK pathway can alter NADPH/NADP+ ratios. Overexpress NADPH-generating enzymes (e.g., glucose-6-phosphate dehydrogenase) or use an NADP+-dependent glyceraldehyde-3-phosphate dehydrogenase to correct any imbalance [16].
The Scientist's Toolkit: Research Reagent Solutions
Table 3: Essential Reagents for Biosensor-Driven Metabolic Engineering
| Reagent / Tool | Category | Function & Application | Example & Notes |
|---|---|---|---|
| Transcription Factor (TF) Biosensors | Sensing | Converts metabolite concentration into transcriptional output for screening or regulation. | Used for dynamic control of naringenin pathway [13]. Tunable via RBS engineering [17]. |
| FRET-Based Biosensors | Sensing / Imaging | Enables real-time, quantitative monitoring of metabolite levels in living cells via conformational change. | Used for lysine, pyruvate, NADPH [17]. iNap sensors for NADPH quantification [17]. |
| Fluorescence Lifetime Imaging (FLIM) | Sensing / Imaging | Provides superior quantification for FRET biosensors, independent of sensor concentration or excitation power. | Ideal for precise quantification of biosensor response in complex cellular environments [18]. |
| Phosphoketolase (PK) Pathway | Metabolic Engineering | Heterologous pathway to enhance acetyl-CoA and E4P supply from CCM. | From Aspergillus nidulans or other microbes; key for lipid and aromatic compound production [16]. |
| Antithetic Integral Feedback Controller | Control Theory | Synthetic circuit providing robust regulation and perfect adaptation in dynamic pathway control. | Used to maintain pathway balance despite perturbations [13]. |
| Central Carbon Metabolism (CCM) | Chassis | The fundamental metabolic network providing precursors, energy, and reducing power. | Optimization of glycolysis, TCA, and PPP in E. coli or yeast is foundational [16]. |
Biosensor Integration and Signaling Logic
The diagram below illustrates the core logic of how a transcription factor-based biosensor integrates with a synthetic genetic circuit to enable high-throughput screening or dynamic pathway regulation.
The targeted engineering of central metabolic intermediates represents a powerful strategy for amplifying the production of value-added compounds in microbial cell factories. The integration of biosensors—particularly those designed for extended metabolite sensing and dynamic regulation—transforms the engineering cycle from a static, trial-and-error process into a responsive and adaptive system. The protocols outlined here, focusing on dynamic control of flavonoid production and rewiring of carbon core metabolism, provide a tangible roadmap for researchers to implement these advanced concepts. As the libraries of characterized transcription factors and synthetic biology tools continue to expand, the precision and scope of biosensor-mediated metabolic engineering will undoubtedly unlock new frontiers in green biomanufacturing.
Engineering Strategies and Implementation in Pathway Regulation
Computational Protein Design and Directed Evolution for Biosensor Engineering
The engineering of high-performance biosensors is a critical endeavor for advancing dynamic metabolic pathway regulation research. These biosensors allow researchers to monitor and control cellular metabolism in real-time, enabling the construction of sophisticated microbial cell factories. Two primary technological paradigms have emerged for creating and optimizing these molecular tools: computational protein design (CPD) and directed evolution (DE). CPD employs advanced algorithms and physics-based models to rationally design protein sequences with desired functions from first principles [19] [20]. In contrast, DE mimics natural selection in the laboratory through iterative rounds of mutagenesis and screening to improve protein functions [21] [22]. This Application Notes and Protocols document provides detailed methodologies for implementing both approaches, framed within the context of biosensor engineering for metabolic pathway regulation. The protocols are designed for researchers, scientists, and drug development professionals working to advance biosensor capabilities for real-time metabolic monitoring and control.
Computational Protein Design of Biosensor Components
Fundamental Principles and Workflow
Computational protein design relies on four key components: protein structure backbone, energy functions, sampling algorithms, and sequence optimization techniques [19]. The process involves designing protein sequences that fold into stable structures capable of performing specific functions, such as binding to target molecules. For biosensor engineering, this typically involves designing binding domains that undergo conformational changes upon ligand binding, which can then be linked to reporter domains.
The basic CPD workflow consists of:
- Backbone Selection: Identifying or generating a protein scaffold with the desired structural topology
- Sequence Design: Optimizing amino acid sequences to stabilize the fold and create functional sites
- Structure Prediction: Validating that designed sequences adopt target conformations
- Experimental Verification: Testing designed proteins for expression, stability, and function [19]
Table 1: Key Computational Tools for Protein Design
| Tool Name | Type | Primary Application | Key Features |
|---|---|---|---|
| Rosetta | Software Suite | Structure prediction & design | Physics-based energy functions, flexible backbone design [19] |
| AlphaFold2 | Deep Learning | Structure prediction | Highly accurate 3D structure predictions from sequence [23] |
| ProteinMPNN | Deep Learning | Sequence design | Neural network for sequence optimization based on backbone structure [23] |
| RFdiffusion | Deep Learning | Structure generation | Generates novel protein structures matching desired specifications [23] |
| RIFdock | Algorithm | Protein-DNA interface design | Samples docks maximizing specific side-chain interactions [23] |
Protocol: Computational Design of DNA-Binding Proteins
This protocol adapts recent advances in computational DBP design for creating biosensor DNA-binding domains that can regulate transcription in response to metabolite binding [23].
Materials:
- High-performance computing cluster with CPU/GPU capabilities
- Rosetta software suite (license required)
- AlphaFold2 installation
- Custom scripts for RIFdock analysis
- E. coli expression strains for experimental validation
Procedure:
Scaffold Library Preparation
- Identify helix-turn-helix (HTH) DNA-binding domains from metagenome sequence databases
- Generate structure predictions using AlphaFold2 for ~26,000 HTH scaffolds
- Filter scaffolds based on prediction confidence (pLDDT > 80) and structural diversity
- Select scaffolds <65 amino acids for optimal biosensor integration [23]
Target-Specific Docking
- Define target DNA sequence and generate B-DNA structure
- Use RIFdock to sample scaffold docks against DNA target
- Maximize potential for specific side chain-base interactions
- Prioritize docks with main-chain phosphate hydrogen bonds
- Generate 200,000-300,000 designed complexes per target [23]
Sequence Optimization
- Perform initial side-chain repacking to remove clashes
- Conduct full sequence design using either:
- Option A (Rosetta): Iterative design with position-specific scoring matrix
- Option B (LigandMPNN): Deep learning-based sequence design
- Execute multiple design iterations with Rosetta backbone relaxation
- Select designs with favorable binding energy (ΔΔG < -15 REU) and >500 Ų interface surface area [23]
Specificity and Preorganization Assessment
- Analyze interface hydrogen bonds, prioritizing bidentate arrangements
- Calculate side-chain preorganization using Rosetta RotamerBoltzmann
- Select designs with native-like preorganization of key contacts
- Filter designs with specificity matching computational models at ≥6 base-pair positions [23]
Validation and Selection
- Predict monomer structures of selected designs using AlphaFold2
- Discard designs deviating from original models (RMSD > 2.0 Å)
- Superimpose predicted structures onto design complexes
- Perform final Rosetta relaxation in DNA context
- Select top 10-20 designs for experimental characterization
Directed Evolution of Biosensors
Advanced Directed Evolution Platforms
Directed evolution remains a powerful complementary approach to computational design, particularly for optimizing complex biosensor properties such as dynamic range, specificity, and sensitivity. Recent advances have automated and accelerated this process through integrated platforms.
Table 2: Directed Evolution Platforms for Biosensor Optimization
| Platform/System | Evolution Mechanism | Throughput | Key Applications |
|---|---|---|---|
| iAutoEvoLab | Automated continuous evolution | ~1 month autonomous operation | Full biosensor development from inactive precursors [24] [25] |
| OrthoRep | In vivo continuous mutagenesis | 10^7-10^8 variant capacity | Growth-coupled evolution of biosensors [24] |
| FACS Screening | Fluorescence-activated cell sorting | 10^8 cells/hour | Biosensor sensitivity and dynamic range optimization [22] |
| Yeast Display | Surface display with sorting | 10^7 variants/round | Transcription factor-based biosensor engineering [23] |
Protocol: Directed Evolution of Transcription Factor-Based Biosensors
This protocol details the directed evolution of transcription factor-based biosensors for metabolite detection, using a lead-sensing PbrR-based biosensor as an exemplar [22].
Materials:
- Fluorescence-activated cell sorter (e.g., BD FACSAria)
- MOPS minimal medium
- Kanamycin antibiotic solution (20 μg/mL)
- pBRR plasmid library with mutant transcription factors
- GFP reporter plasmid
- Lead standard solutions for calibration
Procedure:
Mutant Library Construction
- Design mutagenic primers targeting the transcription factor DNA-binding domain
- Perform error-prone PCR with 0.1-0.5 mM Mn²⁺ to achieve 1-3 amino acid substitutions per variant
- Clone mutated sequences into expression vector with inducible promoter
- Transform into E. coli JudeI host strain to create library >10⁷ CFU capacity
- Verify library diversity by Sanger sequencing of 20-30 random clones [22]
High-Throughput Screening with FACS
- Grow library in MOPS medium to OD₆₀₀ = 0.4-0.6
- Induce expression with 0.1 mM IPTG for 3 hours
- Add target metabolite (e.g., 50 μM Pb²⁺ for PbrR evolution) for 2 hours
- Analyze 10⁸ cells using FACS with 488 nm excitation/530 nm emission
- Collect top 0.1-1% of cells based on fluorescence intensity
- Plate sorted cells on LB-kanamycin for recovery and expansion [22]
Iterative Evolution and Characterization
- Use sorted population as template for subsequent evolution rounds
- Perform 3-4 rounds of evolution with increasing selection stringency
- After each round, isolate single clones for characterization
- Measure biosensor performance parameters:
- Dose-response curves with varying metabolite concentrations
- Specificity testing against structurally similar compounds
- Response time and dynamic range assessment
- Sequence improved variants to identify beneficial mutations [22]
Biosensor Validation in Metabolic Context
- Clone evolved biosensor into metabolic engineering host
- Test performance in real fermentation conditions
- Assess correlation between biosensor output and actual metabolite concentrations
- Validate using analytical methods (HPLC, GC-MS) as gold standard
Integrated Applications in Metabolic Pathway Regulation
Biosensor-Enabled Dynamic Control Systems
The integration of computationally designed or evolved biosensors into metabolic engineering platforms enables dynamic pathway regulation essential for optimizing production of valuable compounds. This approach is particularly valuable for lignocellulosic biomass conversion, where balancing metabolic fluxes is challenging [9].
Implementation Framework:
Biosensor Selection and Integration
- Identify target metabolites for monitoring (e.g., aromatic amino acids, lignin derivatives)
- Integrate biosensor circuits with pathway control elements
- Implement feedback activation and cascading dynamic control strategies [26]
System Optimization and Validation
- Fine-tune expression using promoter and RBS engineering
- Balance metabolic fluxes to prevent intermediate accumulation
- Validate using real-time metabolite monitoring and omics analysis
Table 3: Biosensor Applications in Metabolic Pathway Regulation
| Biosensor Type | Target Metabolite | Application | Performance Metrics |
|---|---|---|---|
| Transcription factor-based | L-Tryptophan | Dynamic regulation of shikimate pathway | 50% increase in lycopene yield [26] |
| HucR-V7/PhucR-based | Vanillin | Feedback control of aromatic aldehyde production | Increased titer and reduced toxicity [26] |
| PadR/PpadC-based | p-Coumaric acid | High-throughput screening of production strains | Increased dynamic range and superior sensitivity [26] |
| TtgR-based | (2S)-Naringenin | Flavonoid pathway optimization | Widest detection range for (2S)-naringenin [26] |
Research Reagent Solutions
Table 4: Essential Research Reagents for Biosensor Engineering
| Reagent/Category | Specific Examples | Function | Application Notes |
|---|---|---|---|
| Host Strains | E. coli JudeI, S. cerevisiae | Biosensor expression & screening | JudeI optimal for transcription factor biosensors [22] |
| Selection Antibiotics | Kanamycin (20 μg/mL) | Maintain plasmid selection | Concentration optimized for biosensor circuits [22] |
| Reporter Proteins | GFP, RFP, mCherry, yeGFP | Biosensor output signal | GFP most common; RFP enables multiplexing [26] |
| Induction Systems | IPTG-inducible promoters | Controlled biosensor expression | 0.1 mM IPTG standard for induction [22] |
| Culture Media | MOPS minimal medium | Defined growth conditions | Essential for metal biosensor evolution [22] |
The synergistic application of computational protein design and directed evolution provides a powerful framework for advancing biosensor engineering for dynamic metabolic pathway regulation. Computational approaches enable precise design of biosensor components with atomic-level accuracy, while directed evolution optimizes complex biosensor properties that are difficult to model in silico. The integration of these engineered biosensors into metabolic engineering pipelines enables real-time monitoring and control of metabolic fluxes, significantly enhancing bioproduction efficiency. As both computational and experimental methodologies continue to advance, particularly with the integration of machine learning and laboratory automation, the development of increasingly sophisticated biosensors will accelerate, enabling more precise dynamic regulation of metabolic pathways for sustainable bioproduction.
Dynamic regulation circuits represent a paradigm shift in metabolic engineering, moving beyond static control to systems that autonomously sense and respond to cellular states. These circuits are primarily engineered to decouple cell growth from product synthesis, thereby maximizing the bioproduction titers, rates, and yields (TRY) that are often limited by metabolic burden and product toxicity [13] [27]. At the core of these systems are biosensors—biological devices that detect specific intracellular metabolites and translate this information into pre-programmed genetic outputs. By implementing feedback control, these circuits enable microbial cell factories to maintain metabolic homeostasis, avoid the accumulation of toxic intermediates, and re-direct flux toward desired products under industrial biomanufacturing conditions [13] [5]. This application note provides a detailed overview of the operating principles, quantitative performance, and experimental protocols for implementing dynamic regulation circuits, with a specific focus on balancing growth and production phases.
Performance Metrics and Quantitative Data
The performance of dynamic regulation circuits is quantified by several key parameters that characterize the biosensor and the overall system's efficacy. Critical biosensor metrics include dynamic range (the ratio between output signal in the induced vs. uninduced state), operating range (the concentration window of the analyte over which the biosensor responds), sensitivity (the minimal analyte concentration that elicits a response), and response time [5]. For the overall circuit, key performance indicators (KPIs) include final product titer (g/L), productivity (g/L/h), and yield (g product/g substrate). Furthermore, the success of growth-production balancing is often evident in the cell density (OD600) achieved and the timing of the metabolic switch.
The table below summarizes representative performance data from recent studies implementing dynamic regulation for bioproduction.
Table 1: Quantitative Performance of Dynamic Regulation Circuits in Bioproduction
| Target Product | Host Organism | Regulation Strategy | Key Metabolite / Signal | Max Titer (g/L) | Cell Density (OD600) | Productivity/Yield | Ref |
|---|---|---|---|---|---|---|---|
| d-Pantothenic Acid (DPA) | Bacillus subtilis | QS-controlled Type I CRISPRi (QICi) | Cell Density (Quorum Sensing) | 14.97 | N/R | Significant improvement in fed-batch | [28] |
| Cadaverine | Escherichia coli | LysP/CadC Lysine Biosensor | L-Lysine | 33.19 | Improved by 21.2% | 48.1% increase vs. constitutive | [27] |
| Riboflavin (RF) | Bacillus subtilis | QS-controlled Type I CRISPRi (QICi) | Cell Density (Quorum Sensing) | N/R | N/R | 2.49-fold increase | [28] |
| Naringenin | Escherichia coli | Extended Biosensor + Antithetic Integral Circuit | Flavonoid Pathway Intermediates | ~0.8 (theoretical) | N/R | Improved robustness | [13] |
| 4-Hydroxycoumarin | Escherichia coli | Engineered PdhR Biosensor | Pyruvate | N/R | N/R | Showcased broad applicability | [6] |
| Trehalose | Escherichia coli | Engineered PdhR Biosensor | Pyruvate | N/R | N/R | Showcased broad applicability | [6] |
N/R: Not explicitly reported in the provided search results.
Experimental Protocols
This section provides a generalized workflow and two detailed protocols for implementing and validating dynamic regulation circuits.
Generalized Workflow for Circuit Implementation
The development and application of a dynamic regulation circuit typically follow a multi-stage process, as visualized below.
Protocol 1: Implementing a Lysine Biosensor for Dynamic Cadaverine Production
This protocol is adapted from a study that achieved 33.19 g/L of cadaverine in a fed-batch fermentation [27].
1. Biosensor Construction and Validation
- Plasmid Construction: Clone the lysine biosensor system into a suitable expression vector. The core components include the transcription factor cadC, the lysine transporter lysP, and a reporter gene (e.g., gfpuv) under the control of the Pcad promoter.
- Sensor Characterization: Transform the biosensor plasmid into a suitable E. coli host (e.g., MG1655). Grow cultures in shake flasks with MOPS medium at varying pH (7.6, 7.0, 5.8) and supplement with different concentrations of L-lysine hydrochloride (e.g., 0-10 g/L) during the mid-exponential phase.
- Measurement: After a defined induction period (e.g., 12 hours), measure fluorescence (excitation ~395 nm, emission ~509 nm) and optical density (OD600). Plot fluorescence/OD600 against lysine concentration to determine the dynamic range and sensitivity of the biosensor.
2. Producer Strain Engineering
- Precursor Enhancement: Genetically modify a production host (e.g., E. coli MG1655) to overproduce the precursor L-lysine. This involves chromosomal modifications to upregulate the lysine biosynthesis pathway (e.g., dapA, lysC).
- Pathway Expression: Integrate and express the cadA gene (encoding lysine decarboxylase) under the control of the biosensor-responsive Pcad promoter. This creates the feedback loop where lysine accumulation triggers its own conversion to cadaverine.
- Metabolic Clean-up: Knock out genes involved in competing pathways or cadaverine degradation (e.g., speE, puuA) to maximize carbon flux toward the desired product.
3. Fed-Batch Fermentation
- Inoculum Preparation: Grow seed cultures in LB medium for 12 hours. Use this to inoculate a seed medium, which is then transferred to a 5 L bioreactor containing a defined production medium [27].
- Fermentation Conditions: Maintain temperature at 37°C, pH at 6.8-7.0 using ammonia water, and dissolved oxygen (DO) at ~30% by adjusting the agitation speed (350-800 rpm).
- Feeding Strategy: Monitor glucose concentration. When it falls below 5 g/L, initiate feeding with a concentrated glucose solution (625 g/L) supplemented with MgSO₄·7H₂O (5 g/L) and (NH₄)₂SO₄ (100 g/L) to maintain a residual sugar concentration of ~10 g/L.
- Analytical Sampling: Periodically sample the broth to measure OD600, glucose, L-lysine, and cadaverine concentrations (e.g., via HPLC).
Protocol 2: Quorum Sensing-Controlled CRISPRi for Metabolic Rewiring
This protocol outlines the use of a Quorum Sensing-controlled Type I CRISPR interference (QICi) system for dynamic gene repression, as applied to D-pantothenic acid and riboflavin production in Bacillus subtilis [28].
1. QICi Toolkit Assembly and Optimization
- Circuit Construction: Assemble the genetic circuit where the quorum sensing (QS) system (e.g., involving phrQ and rapQ) controls the expression of a CRISPR-Cas system. The QS system should be designed to activate Cas protein expression at high cell density.
- crRNA Library Construction: Streamline the cloning of CRISPR RNA (crRNA) expression cassettes targeting key metabolic genes (e.g., citZ for citrate synthase in DPA production).
- System Optimization: Fine-tune the system by engineering key QS components (PhrQ, RapQ) to enhance the QICi efficacy, which has been shown to yield a two-fold improvement in performance [28].
2. Strain Reprogramming and Fed-Batch Fermentation
- Dynamic Regulation: Implement the optimized QICi system to repress target genes (citZ) in a growth-coupled manner. As the culture reaches high density, QS triggers CRISPRi, downregulating central metabolism nodes to redirect flux toward the product.
- Additional Engineering: Couple the dynamic regulation with other strategies such as pantoate pathway engineering, cofactor supply enhancement, and suppression of sporulation for synergistic effects.
- Scale-up Evaluation: Perform fed-batch fermentations in 5 L bioreactors without precursor supplementation. Monitor product titer, cell density, and substrate consumption over time to validate the performance of the dynamic control system.
Pathway Diagrams and Logical Workflows
The logical operation of dynamic regulation circuits for growth and production can be understood through the following control diagram.
The Scientist's Toolkit: Research Reagent Solutions
Successful implementation of dynamic regulation circuits relies on a suite of key reagents and genetic tools. The following table details essential components and their functions.
Table 2: Essential Research Reagents for Dynamic Regulation Circuits
| Reagent / Tool | Function | Example Application / Note |
|---|---|---|
| Transcription Factors (TFs) | Protein-based biosensors that bind a ligand (effector) and regulate transcription of a target gene. | LysP/CadC system for lysine [27]; PdhR for pyruvate [29]. Can be engineered for new effectors. |
| Two-Component Systems (TCSs) | Signal transduction systems involving a sensor kinase and a response regulator for detecting environmental signals. | Useful for sensing extracellular signals like ions, pH, or small molecules [5]. |
| Riboswitches & Toehold Switches | RNA-based biosensors that undergo conformational change upon ligand binding, affecting translation. | Offer compact, tunable, and reversible control of gene expression without protein components [5]. |
| CRISPRi/a Systems | Enables targeted repression (interference) or activation of gene expression via a programmable crRNA. | QICi system for dynamic repression of citZ in B. subtilis [28]. Highly modular and programmable. |
| Quorum Sensing (QS) Systems | Cell-density-dependent signaling systems that activate genetic programs at high biomass. | Used in the QICi toolkit to delay metabolic rewiring until a sufficient cell density is achieved [28]. |
| Fluorescent Reporter Proteins | Generate a measurable output (fluorescence) for biosensor characterization and high-throughput screening. | GFPuv used for characterizing the lysine biosensor's dose-response [27]. |
| Directed Evolution Tools | Methods for improving biosensor properties (sensitivity, dynamic range) through iterative mutagenesis and screening. | FACS sorting combined with mutagenesis libraries to enhance biosensor performance [5]. |
Bifunctional dynamic control represents an advanced paradigm in synthetic biology and metabolic engineering, enabling simultaneous upregulation and downregulation of target cellular processes. Such systems are crucial for overcoming a fundamental challenge in metabolic engineering: balancing cell growth with the production of target compounds, which are often at odds [30]. By integrating metabolite-sensing capabilities with programmable regulation tools like CRISPR interference (CRISPRi) and antisense RNA (asRNA), these systems autonomously redistribute metabolic flux, diverting resources from native pathways to engineered biosynthesis without compromising cellular viability [31] [32]. This application note details the underlying principles, provides validated protocols, and summarizes key performance data for implementing these sophisticated genetic circuits, framed within the broader context of biosensor design for dynamic metabolic pathway regulation.
System Components and Principles of Operation
The core architecture of a bifunctional control system merges a sensor module with an effector module to create a coherent regulatory response.
Metabolite Sensor Modules
The system is initiated by sensor proteins that detect specific intracellular metabolites. For instance, the transcription factor CatR from Pseudomonas putida senses muconic acid (MA), binding to the PMA promoter and activating transcription in the presence of MA [32]. Alternatively, quorum-sensing (QS) systems can be employed for pathway-independent sensing, using components like LuxR and EsaR to activate or derepress promoters in a cell-density-dependent manner [30].
Effector Modules: CRISPRi and Antisense RNA
The sensory signal is transduced to effector modules for precise genetic control:
- CRISPRi: A nuclease-deficient Cas protein (e.g., dCas9, dCas12a) is guided by a gRNA to bind DNA and block transcription. The system's programmability allows for simultaneous regulation of multiple genomic targets [31] [33].
- Antisense RNA (asRNA): Short, engineered RNA strands complementary to target mRNA sequences are expressed. Upon binding, they prevent translation or trigger mRNA degradation. When designed with Hfq-binding tags, asRNA efficiency is enhanced by facilitating RNA-RNA interactions [31].
In a bifunctional setup, a metabolite sensor can be engineered to simultaneously activate a biosynthetic gene and repress a competing native gene. For example, a CatR-activated promoter can drive the expression of both a heterologous enzyme and a gRNA targeting a host gene, thereby implementing simultaneous up- and down-regulation [32] [33].
Enhanced Regulation through Feedback and Sequestration
Basic CRISPRi circuits can suffer from leaky repression and retroactivity. Advanced circuits incorporate:
- gRNA Sequestration: constitutively expressed "sinker" asRNAs sequester leaked gRNAs, preventing unwanted repression by dCas proteins. This strategy has been shown to significantly improve the dynamic range of CRISPRi inverters, particularly during stationary phase [31].
- Feedback Control: Regulating the production of asRNAs or dCas proteins using CRISPRi itself creates a feedback loop that further stabilizes circuit performance and output [31] [34].
Table 1: Key Genetic Components for Bifunctional Control Systems
| Component Type | Example | Function | Key Characteristics |
|---|---|---|---|
| Sensor Protein | CatR | Binds muconic acid, activates PMA promoter | From P. putida; LysR family [32] |
| Sensor Protein | LuxR | Binds AHL, activates Plux promoter | Part of quorum-sensing system [30] |
| Repressor Protein | EsaR | Binds AHL, derepresses PesaR-H | Part of quorum-sensing system [30] |
| CRISPR Protein | dCas12a | Binds DNA guided by crRNA, blocks transcription | Native RNase activity processes crRNAs [33] |
| Antisense RNA | S00 (example) | Binds and sequesters gRNA "0" | Includes Hfq-recruiting tag for stability [31] |
| Terminator | Various (e.g., T1, T7) | Transcriptional termination filter | Reduces basal/leaky expression from promoters [33] |
Experimental Protocols
Protocol 1: Construction of a Metabolite-Sensing CRISPRi/asRNA Circuit
This protocol outlines the creation of a genetic circuit where a metabolite sensor dynamically controls a gRNA to repress a target gene, with asRNA providing leak control.
Materials:
- Plasmids: pSECRVi (or similar backbone for dCas12a expression), pG-FncrRNA (for gRNA expression), pTRC-RFP (reporter plasmid) [33].
- Strains: E. coli DH5α for cloning, production host (e.g., BW25113, BL21) [32] [33].
- Reagents: Gibson Assembly Master Mix, restriction enzymes, antibiotics, inducers (e.g., muconic acid, IPTG).
Procedure:
- Clone the Sensor-activated gRNA Module:
- Amplify the metabolite-responsive promoter (e.g., PMA) and the gRNA scaffold containing a target-specific spacer.
- Assemble these fragments into a medium- or low-copy plasmid using Gibson assembly. The gRNA spacer should be designed to target the -10 region of the promoter of the gene you wish to repress for effective CRISPRi [31] [33].
- Clone the asRNA Sequestration Module:
- Design an asRNA sequence that is fully complementary to the first 20 bp of the gRNA spacer, a 40 bp unique tag, and a portion (e.g., 9 bp) of the CRISPR repeat to disrupt the hairpin structure without compromising orthogonality [31].
- Incorporate an Hfq-binding tag at the 3' end of the asRNA sequence.
- Clone this asRNA sequence under a constitutive promoter onto a compatible plasmid.
- Assemble the Complete Circuit:
- Co-transform the following into your production host:
- Plasmid 1: Constitutive dCas12a expression vector (e.g., pFnSECRVi).
- Plasmid 2: Sensor-driven gRNA module from Step 1.
- Plasmid 3: Constitutive asRNA module from Step 2.
- Reporter plasmid with the target gene (e.g., GFP) for repression assessment.
- Co-transform the following into your production host:
- Validate Circuit Function:
- Inoculate colonies in media with and without the metabolite inducer.
- Monitor cell growth (OD600) and reporter fluorescence over 24-48 hours using a plate reader.
- Expected Outcome: High fluorescence in the absence of the inducer (circuit OFF), and significant repression of fluorescence in the presence of the inducer (circuit ON). The asRNA module should reduce fluorescence in the OFF state compared to a circuit without it [31].
Protocol 2: Application for Dynamic Metabolic Flux Control
This protocol applies the bifunctional system to balance cofactor levels by repressing a native gene while expressing a heterologous, orthogonal copy.
Materials:
- As in Protocol 1, plus genomic DNA from Clostridium acetobutylicum (for gapC).
Procedure:
- Design the Metabolic Genetic Switch:
- Target the native gapA gene (encoding GAPDH in glycolysis) with a gRNA expressed from a metabolite-sensitive promoter (e.g., responsive to glycolytic intermediates) [33].
- Clone the orthologous gapC gene from C. acetobutylicum, which is insensitive to the gRNA due to sequence divergence, under a separate constitutive promoter.
- Integrate and Test:
- Assemble the genetic switch on a plasmid and transform into the host.
- Cultivate the engineered strain in bioreactors or deep-well plates with high-carbon media to create metabolic burden.
- Measure extracellular product titer (e.g., mevalonate or target biochemical) and intracellular metabolite pools (e.g., NADH/NAD+ ratio) via LC-MS/MS.
- Expected Outcome: The dynamic switch should maintain healthier NADH/NAD+ ratios and achieve higher product titers (e.g., mevalonate at >100 g/L in fermenters) compared to strains with static control, by avoiding excessive metabolic imbalance [35] [33].
Experimental Validation and Data Interpretation
The performance of bifunctional control systems is quantifiable through well-established metrics. The following table summarizes typical results from implementing these systems in E. coli.
Table 2: Quantitative Performance of Bifunctional Control Systems in Metabolic Engineering
| Application / System Type | Target Pathway / Process | Key Performance Metric | Result with Dynamic Control | Result with Static Control |
|---|---|---|---|---|
| Quorum-Sensing (lux/esa) [30] | Naringenin Synthesis | Final Titer (μM) | 204 ± 5 μM | < 10 μM |
| Quorum-Sensing (lux/esa) [30] | Salicylic Acid Synthesis | Final Titer | Significant improvement | Lower (specific value not stated) |
| Sensor-Regulator & RNAi [32] | Muconic Acid Synthesis | Final Titer (g/L) | 1.8 g/L | Not specified |
| Glycolysis Flux Biosensor [35] | Mevalonate Synthesis | Final Titer (g/L in fermenter) | 111.3 g/L | Not specified |
| CRISPRi/asRNA Inverter [31] | Genetic Circuit Performance | Dynamic Range (Stationary Phase) | Drastically improved | Crippled performance |
| Thermosensitive T-Switch [36] | Reporter Expression (sfGFP) | Dynamic Range (Fold-Change) | 1819-fold | Not applicable |
Data Interpretation:
- Substantial Titer Improvements: The consistent theme across multiple studies is that dynamic, autonomous control far outperforms static optimization. For instance, in the naringenin pathway, dynamic control prevented the accumulation of inhibitory intermediates, leading to a 20-fold increase in product titer [30].
- Enhanced Genetic Circuit Robustness: The integration of asRNA to sequester leaked gRNAs was critical for maintaining circuit function beyond the exponential growth phase, a common failure point for CRISPRi systems operating under strong promoters [31].
- System Generality: The success across diverse pathways (naringenin, salicylic acid, muconic acid, mevalonate) and inducers (cell density, glycolytic intermediates, specific metabolites) demonstrates the modularity and general applicability of the bifunctional control principle [30] [35] [32].
The Scientist's Toolkit
Table 3: Essential Research Reagent Solutions for Bifunctional Control Systems
| Reagent / Tool | Function / Application | Example Source / Part Number |
|---|---|---|
| dCas12a (FnCas12a, D917A) | Nuclease-deficient CRISPR effector for transcriptional repression | Addgene (e.g., pY002-FndCas12a) [33] |
| Quorum-Sensing Plasmid Kit | Pre-assembled plasmids for LuxR/EsaR-based sensing and regulation | Gupta et al., 2019 [30] |
| Metabolite Sensor Plasmids (CatR/PMA) | Pre-characterized systems for sensing muconic acid or other metabolites | Available upon request from author labs [32] |
| Terminator Filter Library | A collection of transcriptional terminators to fine-tune expression and reduce leak | Journal of Biological Engineering, Supp. Table S4 [33] |
| Hfq-binding asRNA Scaffold | DNA template for synthesizing effective antisense RNAs with enhanced stability | PMC9486968 [31] |
| CRISPRi/asRNA Inverter Circuit | A ready-to-use, validated genetic circuit for testing sequestration | ACS Syn Bio, 2022 [31] |
Visual Synthesis of System Architecture and Workflow
The following diagrams illustrate the core architecture and implementation workflow of a bifunctional control system integrating metabolite sensing, CRISPRi, and antisense RNA.
Dynamic regulation of metabolic pathways is a cornerstone of advanced synthetic biology, enabling the construction of microbial cell factories that autonomously balance cell growth and product synthesis. The layering of genetic circuits represents a sophisticated approach to overcome fundamental performance trade-offs in robustness and speed, allowing for more precise control over complex biological systems [37] [38]. This protocol details the integration of metabolite-responsive biosensors with quorum-sensing (QS) systems to create multi-layered genetic circuits capable of complex metabolic control.
Such integrated systems leverage the strengths of both regulatory mechanisms: metabolite-responsive biosensors provide direct feedback on intracellular metabolic states, while QS systems enable population-level coordination. The resulting layered circuits can perform higher-order Boolean operations and implement dynamic control strategies that are infeasible with single-layer regulation [39] [40]. This application note provides detailed methodologies for constructing, testing, and implementing these systems for diverse metabolic engineering applications, with a particular focus on the synthesis of high-value chemicals.
Theoretical Framework and Design Principles
Circuit Architecture and Operational Logic
Layered genetic circuits function through the strategic interconnection of multiple regulatory layers, creating a sophisticated control system that can process biological information and execute complex decisions. The fundamental architecture typically consists of:
- Sensor Layer: Comprises metabolite-responsive transcription factors or RNA-based biosensors that detect specific intracellular metabolites [41] [38].
- Signal Processing Layer: Incorporates QS components that interpret population density through autoinducer accumulation [42].
- Output Layer: Generates effector molecules (repressors, activators, or enzymes) that directly modulate metabolic flux.
The operational logic follows engineering control principles where layering multiple feedbacks overcomes the traditional robustness-speed performance trade-off limit [37]. Theoretical models and system dynamics analyses demonstrate that layered control integrates the beneficial performance profiles of individual controllers, resulting in systems that are both robust to disturbances and rapid in their response to metabolic demands [37].
Key Regulatory Components
Table 1: Core Components for Layered Genetic Circuit Construction
| Component Type | Example | Function | Key Characteristics |
|---|---|---|---|
| Metabolite Biosensors | Transcription factor-based biosensors [41] | Detect intracellular metabolite levels | Pathway-specific, enable dynamic flux control |
| Quorum Sensing Systems | Lux-type system [42] | Sense cell density via AHL signaling | Population-level coordination, tunable response |
| Signal Transducers | Switchable Transcription Terminators (SWTs) [43] | Convert RNA signals to transcriptional outputs | High fold-change (up to 283x), computational design |
| Orthogonal Regulators | CRISPRi system [42] | Implement logic gates and layered control | Programmable, minimal cross-talk |
| Output Devices | Reporter genes, metabolic enzymes | Execute metabolic pathway modulation | Strong RBS, optimized codons |
Experimental Protocols
Protocol 1: Construction of Metabolite-Responsive Biosensor Modules
Purpose: To create genetic modules that detect specific intracellular metabolites and transduce this information into transcriptional outputs.
Materials:
- Plasmid backbone (e.g., pSG-backbone with carbenicillin resistance) [43]
- Metabolite-responsive transcription factor genes
- Reporter genes (e.g., GFP, mCherry)
- Synthetic terminator sequences (e.g., T500 variants) [43]
- Restriction enzymes and ligase for Golden Gate Assembly [43]
- E. coli DH5α competent cells [43]
Method:
- Promoter Selection: Identify and clone promoter sequences responsive to your target metabolite (e.g., acyl-CoA, malonyl-CoA, or pyruvate-responsive promoters) [38].
- Vector Assembly:
- Amplify the metabolite-responsive promoter using PCR with appropriate flanking restriction sites.
- Digest both the plasmid backbone and promoter fragment with the selected restriction enzymes.
- Ligate the promoter into the vector upstream of a minimal promoter sequence.
- Transform into E. coli DH5α and plate on LB agar with appropriate antibiotics (100 µg/mL carbenicillin) [43].
- Verify constructs by colony PCR and sequencing.
- Characterization:
Troubleshooting:
- High background expression: Incorporate synthetic terminators or optimize RBS strength.
- Low dynamic range: Test promoter mutants or alternative transcription factors.
Protocol 2: Engineering Enhanced Quorum-Sensing Circuits
Purpose: To create QS circuits with high dynamic ranges and minimal leakiness for integration with metabolite-sensing modules.
Materials:
- LuxR and LuxI genes (V. fischeri)
- CRP-binding site oligonucleotides [42]
- Reporter plasmids with eGFP or mCherry
- AHL standards (varying chain lengths)
- E. coli strains for QS characterization
Method:
- CRP-Binding Site Engineering:
- Design oligonucleotides with tandem repeats of the CRP-binding site (1-4 copies) [42].
- Clone these sequences into the luxR-luxI intergenic region using site-directed mutagenesis or Gibson Assembly.
- Verify sequences by Sanger sequencing.
- Lux Box Optimization:
- Redesign the lux box to -10 region sequence to modulate RNA polymerase binding affinity [42].
- Test various spacer lengths and sequences between lux box and -10 element.
- Circuit Characterization:
- Transform constructs into appropriate E. coli host strains.
- Grow cultures with varying AHL concentrations (0 nM to 1 µM).
- Measure reporter output at regular intervals to establish response curves.
- Calculate dynamic range and leakiness for each variant [42].
Troubleshooting:
- High basal expression: Increase CRP-binding site copies or optimize lux box sequence.
- Low maximum output: Strengthen RBS for LuxR expression or test different AHL analogs.
Protocol 3: Layering Biosensor and QS Systems
Purpose: To integrate metabolite-responsive and QS modules into a unified circuit with coordinated regulation.
Materials:
- Characterized metabolite biosensor and QS modules
- Low-copy number plasmid vectors with compatible origins
- Orthogonal repressor systems (e.g., λ Cl) [40]
- E. coli chassis strains optimized for metabolic engineering
Method:
- Circuit Design:
- Design circuit architecture based on desired metabolic control logic.
- Select appropriate connection points between modules (e.g., biosensor output controlling QS component expression).
- Incorporate genetic insulators (e.g., terminators, RNase sites) to minimize context effects [40].
- Multi-Module Assembly:
- Use Golden Gate or Gibson Assembly to combine modules in a stepwise manner [43].
- Assemble complex circuits hierarchically, verifying function at each stage.
- Include selection markers for each module where possible.
- System Validation:
- Test layered circuit performance in batch cultures.
- Measure response to both metabolic inputs and cell density changes.
- Verify orthogonality and absence of cross-talk between modules.
- Quantify metabolic outputs (e.g., target compound production) [42].
Troubleshooting:
- Genetic context effects: Insert transcriptional terminators or redesign 5' UTR regions [40].
- Unexpected logic behavior: Model system dynamics and adjust component ratios.
Signaling Pathway and Circuit Diagrams
Integrated Metabolic and Quorum Sensing Control System
Integrated Metabolic and Quorum Sensing Control System
Layered Feedback Architecture for Performance Optimization
Layered Feedback Architecture for Performance Optimization
Quantitative Performance Data
Characterized Circuit Components and Performance Metrics
Table 2: Performance Metrics of Layered Circuit Components
| Circuit Component | Dynamic Range (ON/OFF) | Response Time | Applications | Reference |
|---|---|---|---|---|
| Switchable Transcription Terminators (SWTs) | 283.11-fold | 2 hours (in vitro) | Multi-layer cascades | [43] |
| CRP-Enhanced QS Promoters | 8-fold improvement vs. wild-type | Cell density-dependent | Salicylic acid production | [42] |
| Layered Feedback Control | Overcomes robustness-speed trade-off | Settling time improvements | Metabolic flux control | [37] |
| Orthogonal AND Gates | Digital performance | Growth phase-dependent | Half-adder circuits | [40] |
| Metabolite Biosensors | Varies by metabolite | Metabolite-dependent | Dynamic pathway regulation | [38] |
Metabolic Engineering Applications and Outcomes
Table 3: Metabolic Engineering Applications of Layered Circuits
| Application | Circuit Design | Performance Outcome | Key Optimization |
|---|---|---|---|
| Salicylic Acid Production | Triple-layer QS circuit controlling 3 metabolic fluxes | 2.08 g/L titer in shake flasks | CRP-binding site engineering [42] |
| 4-Hydroxycoumarin Biosynthesis | Dynamic flux control using QS variants | 10-fold improvement vs. static control | Autonomous metabolic balancing [42] |
| Multi-layer Cascade Circuits | RNA-only layered circuits | 3-layer cascade demonstration | Computational orthogonality design [43] |
| Genetic Half Adder | Layered AND, OR, NOT gates | Single-cell bacterial computation | 5' UTR optimization to prevent interference [40] |
The Scientist's Toolkit: Research Reagent Solutions
Table 4: Essential Research Reagents for Layered Circuit Construction
| Reagent/Category | Specific Examples | Function/Application | Key Considerations |
|---|---|---|---|
| Plasmid Backbones | pSG-backbone [43], pCON [40] | Circuit assembly and maintenance | Copy number, compatibility, selection markers |
| Computational Tools | NUPACK [43], Multi-tube design algorithms | Orthogonal sequence design | Minimizes crosstalk in complex circuits |
| Characterization Assays | Fluorescence measurement [43], EMSA [42] | Circuit performance quantification | Standardized protocols enable comparison |
| Genetic Insulators | Synthetic terminators (T500) [43], 5' UTR RNA processing [40] | Buffer context-dependent effects | Critical for predictable layered circuits |
| Orthogonal Regulators | CRISPRi [42], σ54-dependent systems [40] | Implement logic operations | Minimize interference with host machinery |
The strategic layering of metabolite-responsive biosensors with quorum-sensing systems represents a significant advancement in synthetic biology's capacity for dynamic metabolic control. The protocols outlined herein provide researchers with a comprehensive framework for designing, constructing, and characterizing these sophisticated genetic circuits.
Future developments in this field will likely focus on expanding the library of orthogonal components, refining computational design tools, and implementing more complex multi-input control systems. As synthetic biology progresses toward more ambitious applications in therapeutic development and bioproduction, layered genetic circuits will play an increasingly vital role in achieving precise, robust, and autonomous control over biological systems [38] [39]. The integration of machine learning approaches with high-throughput characterization techniques will further accelerate the design-build-test cycles for these complex systems, ultimately enabling the construction of increasingly sophisticated genetic control systems for metabolic engineering and therapeutic applications.
The construction of efficient microbial cell factories is pivotal for the sustainable production of valuable chemicals. A significant challenge in this domain is balancing high-level product synthesis with essential cellular growth and function. This article presents application notes and protocols for achieving high-titer production of flavonoids, glucaric acid, and N-acetylglucosamine, framing these case studies within the broader thesis that biosensor design for dynamic metabolic pathway regulation is a critical enabling technology. We demonstrate how biosensor-driven strategies—facilitating high-throughput screening and intelligent dynamic control—have been instrumental in overcoming metabolic bottlenecks and pushing production titers to gram-scale levels, thereby enhancing the economic viability of microbial biosynthesis.
Application Notes & Protocols
Case Study 1: High-Titer Production of Glucaric Acid
2.1.1 Application Note Glucaric acid is a valuable dicarboxylic acid with applications in polymers, detergents, and pharmaceuticals. Its commercial production via chemical oxidation of glucose faces challenges of low selectivity and environmental pollution. Metabolic engineering of Saccharomyces cerevisiae presents a sustainable alternative [44]. Key strategies for achieving high titers include:
- Enzyme Fusion Technology: Fusion of the key pathway enzymes, Arabidopsis thaliana MIOX4 (myo-inositol oxygenase) and Pseudomonas syringae Udh (uronate dehydrogenase), using a peptide linker (EA3K)3 resulted in a 5.7-fold increase in glucaric acid production compared to the expression of free enzymes [44].
- Biosensor-Driven High-Through Screening (HTS): An E. coli glucaric acid-responsive biosensor was employed to screen an opi1 mutant S. cerevisiae library with the fused MIOX4-Udh protein integrated into delta sequence sites. This HTS approach identified a high-producing strain, GA16, which achieved 4.9 g/L in shake flask fermentation [44].
- Metabolic Flux Optimization: Downregulation of ZWF1 (glucose-6-phosphate dehydrogenase) and overexpression of INM1 (inositol monophosphatase) and ITR1 (inositol transporter) increased the intracellular supply of the precursor myo-inositol. These modifications in the final strain, GA-ZII, boosted the titer to 8.49 g/L in shake flasks and 15.6 g/L in a 5-L fed-batch bioreactor [44].
2.1.2 Detailed Protocol: Biosensor-Assisted Screening of a Yeast Library
- Objective: To identify high-glucaric acid-producing S. cerevisiae strains from a mutant library using a glucaric acid biosensor.
- Materials:
- Engineered S. cerevisiae library (e.g., opi1 mutant with MIOX4-Udh integrated at delta sites).
- Reporter E. coli strain harboring the glucaric acid biosensor (e.g., plasmid with transcription factor cdaR and GFP reporter).
- Selective media (appropriate antibiotics).
- Deep 96-well culture plates.
- Fluorescence microplate reader.
- Procedure:
- Library Cultivation: Inoculate the yeast library in deep 96-well plates containing a suitable production medium. Incubate with shaking for a specified period to allow glucaric acid production.
- Biosensor Co-culture/Exposure: Transfer a sample of the fermentation supernatant from each well to a new plate containing the biosensor E. coli strain in fresh medium. The biosensor strain is engineered to produce Green Fluorescent Protein (GFP) in proportion to extracellular glucaric acid concentration [45].
- Fluorescence Measurement: After incubating the biosensor plate, measure the GFP fluorescence intensity using a microplate reader.
- Strain Isolation: Identify wells showing the highest fluorescence signals. Recover the corresponding yeast strains from the original cultivation plate for further validation and scale-up fermentation.
2.1.3 Pathway Engineering and Regulation Logic The following diagram illustrates the metabolic pathway and key engineering strategies for enhancing glucaric acid production in yeast, including the enzyme fusion and regulatory targets.
Diagram 1: Engineered glucaric acid biosynthetic pathway in S. cerevisiae. Key metabolic engineering strategies are highlighted, including enzyme fusion (blue), biosensor screening (blue), precursor flux enhancement (green), and competitive pathway downregulation (red). Abbreviations: G6P, Glucose-6-phosphate; MI, myo-inositol; MIOX, myo-inositol oxygenase; Udh, uronate dehydrogenase; ZWF1, glucose-6-phosphate dehydrogenase; INM1, inositol monophosphatase; ITR1, inositol transporter; HTS, high-throughput screening.
Case Study 2: High-Titer Production of N-Acetylglucosamine
2.2.1 Application Note N-Acetylglucosamine (GlcNAc) is an amino sugar widely used in health supplements and cosmetics. Microbial production in E. coli is a competitive method, but its biosynthesis directly competes with central carbon metabolism for precursors. A strategy of catabolic division of labor using mixed carbon sources has proven highly effective [46] [47]:
- Carbon Source Specialization: By deleting the pfkA gene (phosphofructokinase) and enhancing glycerol utilization via a glpK mutant, carbon flux was strategically partitioned. Glycerol was primarily utilized for cell growth and central metabolism, while glucose was conserved for GlcNAc synthesis [46].
- Precursor Flux Optimization: Further refinement was achieved by knocking out the zwf gene (glucose-6-phosphate dehydrogenase), which diverts carbon to the pentose phosphate pathway. This channeled more glucose-6-phosphate toward GlcNAc [47].
- Performance: This systematic engineering in strain GLALD-7 resulted in a GlcNAc titer of 179.7 g/L in a 5-L bioreactor using a mixed glycerol/glucose feed. A subsequent engineered strain, NAG-1, achieved a remarkable titer of 249 g/L with a yield of 0.791 g/g glucose [46] [47].
2.2.2 Detailed Protocol: Fed-Batch Fermentation with Mixed Carbon Sources
- Objective: To achieve high-density fermentation and high-yield GlcNAc production using a defined ratio of glycerol and glucose.
- Materials:
- Engineered E. coli strain (e.g., GLALD-7 or NAG-1).
- Fermentation medium (e.g., defined or semi-defined).
- Carbon feed solutions: Glucose (400 g/L), Glycerol (200 g/L).
- 5-L Bioreactor with pH, dissolved oxygen (DO), and temperature control.
- Procedure:
- Inoculum Preparation: Grow a seed culture of the engineered strain overnight.
- Bioreactor Initialization: Transfer the seed culture to the bioreactor containing the initial batch medium.
- Fed-Batch Fermentation:
- Maintain optimal environmental conditions (e.g., pH 6.8, 37°C, DO > 30%).
- Initiate the feed when the initial carbon source is depleted, indicated by a spike in DO.
- Use a mixed carbon feed with a controlled glycerol-to-glucose mass ratio (e.g., 1:8). The feeding rate should be adjusted to maintain a low residual sugar concentration.
- Harvest: Terminate the fermentation after ~72 hours or when productivity declines. Analyze GlcNAc titer and yield.
2.2.3 Carbon Flux Partitioning Logic The diagram below visualizes the strategy of catabolic division of labor for redirecting metabolic flux toward N-acetylglucosamine biosynthesis.
Diagram 2: Metabolic strategy for high-level GlcNAc production in E. coli. The "catabolic division of labor" uses engineered pathways (green for enhanced, red for blocked) to partition mixed carbon sources: glycerol is directed toward supporting cell growth, while glucose is channeled efficiently into the GlcNAc biosynthetic pathway. Abbreviations: G6P, Glucose-6-phosphate; F6P, Fructose-6-phosphate; PPP, Pentose Phosphate Pathway.
Case Study 3: High-Titer Production of Flavonoids
2.3.1 Application Note Flavonoids like apigenin and kaempferol have significant nutraceutical value. Their production in E. coli has been advanced through rapid prototyping platforms that facilitate the quick assembly and testing of metabolic pathways [48].
- Pathway Extension from Gatekeeper Flavonoids: Starting from high-titer producing strains of gatekeeper (2S)-flavanones (e.g., naringenin), pathways were extended by expressing flavone synthases (FNS-I or FNS-II) to produce flavones (apigenin, chrysin, luteolin), or by co-expressing flavanone 3-dioxygenase (F3H) and flavonol synthase (FLS) to produce the flavonol kaempferol [48].
- Precursor Balancing: The use of a plasmid (pTyr+) overexpressing feedback-resistant enzymes (aroG, tyrA) and phosphoenolpyruvate synthase (ppsA) boosted the intracellular tyrosine pool, a key precursor. This allowed for high apigenin (80.2 mg/L) and kaempferol (42.4 mg/L) titers in rich medium without tyrosine supplementation [48].
- Performance: In cultures supplemented with 3 mM tyrosine, titers reached 128 mg/L for apigenin and 151 mg/L for kaempferol in deep-well plate cultivations, demonstrating the effectiveness of the pathway prototyping approach [48].
2.3.2 Detailed Protocol: Rapid Prototyping for Flavonoid Pathway Assembly
- Objective: To rapidly construct and screen different enzyme combinations for optimizing flavone and flavonol production.
- Materials:
- E. coli chassis strain with enhanced precursor supply (e.g., ΔtyrR ΔpheLA DKO).
- Gatekeeper flavonoid production plasmid (e.g., for naringenin).
- Library of expression vectors harboring different FNS, F3H, or FLS genes.
- Transformation reagents.
- 96-DeepWell plates.
- LC-MS for product quantification.
- Procedure:
- Pathway Assembly: Transform the gatekeeper flavonoid production plasmid along with a library of pathway extension plasmids (e.g., expressing different FNS-II enzymes) into the host strain.
- Micro-Scale Cultivation: Inoculate transformations in 96-deepwell plates with rich medium, with or without precursor supplementation (e.g., tyrosine).
- Fermentation and Extraction: Incubate the plates for 48-72 hours. Centrifuge the plates and extract metabolites from the supernatant or whole broth with a suitable solvent like methanol.
- Analysis and Strain Selection: Analyze the extracts using LC-MS to quantify flavonoid production. Select the best-performing strain for each target flavonoid for further scale-up.
Table 1: Summary of high-titer production performances for target molecules.
| Target Molecule | Host Organism | Key Strategy | Highest Reported Titer | Scale |
|---|---|---|---|---|
| Glucaric Acid | Saccharomyces cerevisiae | Enzyme Fusion, Biosensor HTS, Flux Optimization | 15.6 g/L [44] | 5-L Bioreactor |
| N-Acetylglucosamine (GlcNAc) | Escherichia coli | Catabolic Division of Labor (Mixed Glycerol/Glucose) | 249 g/L [47] | 5-L Bioreactor |
| Apigenin (Flavonoid) | Escherichia coli | Rapid Prototyping, Precursor Balancing | 128 mg/L [48] | 96-DeepWell Plate |
| Kaempferol (Flavonoid) | Escherichia coli | Rapid Prototyping, Precursor Balancing | 151 mg/L [48] | 96-DeepWell Plate |
The Scientist's Toolkit
Table 2: Essential research reagents and tools for biosensor-driven pathway engineering.
| Tool / Reagent | Function / Application | Example Use Case |
|---|---|---|
| Transcription Factor (TF) Biosensors | Converts metabolite concentration into measurable output (e.g., GFP); enables HTS. | Glucaric acid biosensor (CdaR) for screening yeast libraries [44] [45]. |
| Quorum Sensing (QS) Systems | Enables population-density-dependent dynamic regulation of gene expression. | EsaI/EsaR system to downregulate glycolysis and increase glucaric acid titer [49]. |
| Enzyme Fusion Tags & Linkers | Improves catalytic efficiency of pathway enzymes by substrate channeling. | MIOX4-Udh fusion with (EA3K)3 linker for enhanced glucaric acid production [44]. |
| Orthogonal Expression Systems | Allows tunable, host-independent gene expression to minimize regulatory interference. | Sigma factor toolbox for optimizing naringenin pathway in E. coli [50]. |
| Mixed Carbon Source Fermentation | Enables catabolic division of labor to decouple growth from production. | Glycerol for growth & glucose for GlcNAc synthesis in engineered E. coli [46] [47]. |
| Rapid Prototyping Platform | Facilitates high-throughput assembly and testing of pathway variants. | Screening FNS and FLS enzyme libraries for flavone production in E. coli [48]. |
Addressing Stability, Robustness, and Implementation Challenges
Overcoming Stability and Robustness Issues in Multi-Step Genetic Circuits
The engineering of complex, multi-step genetic circuits is a cornerstone of advanced synthetic biology, enabling sophisticated applications in dynamic metabolic regulation, therapeutic drug development, and biosensing [51]. However, the predictable design of these systems is fundamentally hampered by stability and robustness issues that emerge from intricate circuit-host interactions [52] [53]. These interactions often lead to a loss of circuit function over time, posing a significant barrier to reliable implementation in both industrial and research settings.
A primary source of instability is the metabolic burden imposed by synthetic circuits on host cells. This burden manifests as a redirection of finite cellular resources—such as ribosomes, RNA polymerases, and nucleotides—away from essential host functions toward the expression of heterologous circuit genes [52] [54]. This disruption can reduce host growth rates, and in turn, create a strong selective pressure for non-producing mutant cells that have inactivated the costly circuit. These faster-growing mutants can rapidly outcompete the engineered population, leading to a dramatic decline in population-level circuit performance [54] [53]. For multi-step circuits, this problem is compounded by resource competition between modules and emergent feedback contextual factors, which can convolute circuit behavior and lead to unexpected failures [52].
This Application Note outlines the principal mechanisms behind circuit failure and provides detailed, actionable protocols grounded in a "host-aware" design framework. By integrating control strategies that monitor and respond to intracellular states, these methods enhance the evolutionary longevity and functional robustness of multi-layered genetic circuits, thereby ensuring more reliable performance for dynamic metabolic pathway regulation.
Key Challenges to Circuit Stability
Circuit-Host Interactions and Metabolic Burden
Synthetic gene circuits do not operate in isolation; their functionality is deeply intertwined with the host cell's physiology. Two key feedback contextual factors are major contributors to unstable circuit behavior:
- Growth Feedback: A multiscale feedback loop exists where circuit expression consumes cellular resources, burdening the host and reducing its growth rate. This reduced growth rate, in turn, alters the circuit's behavior by changing the dilution rate of circuit components and the availability of resources [52].
- Resource Competition: In a multi-step circuit, different modules compete for a finite, shared pool of transcriptional and translational machinery (e.g., RNA polymerases, ribosomes). This competition can lead to unintended coupling between modules, where the activity of one module indirectly represses another by depleting essential resources [52]. In bacterial systems, competition for translational resources (ribosomes) is often the primary bottleneck, whereas in mammalian cells, competition for transcriptional resources (RNAP) is more dominant [52] [54].
Mutant Emergence and Evolutionary Failure
The burden imposed by a synthetic circuit creates a direct evolutionary pressure. Mutants that arise spontaneously and have lost or reduced circuit function gain a growth advantage because they are no longer allocating resources to the circuit. In a competitive growth environment, such as a fermenter or a serially passaged culture, these faster-growing mutants will eventually dominate the population [54] [53]. The failure rate η(W) and the relative fitness advantage of mutants α are key parameters determining the speed of this functional decline [53].
Several molecular mechanisms can lead to mutant generation:
- Plasmid loss due to segregation errors during cell division [53].
- Recombination-mediated deletion of circuit parts, especially those with repeated sequences [53].
- Insertion of transposable elements into circuit components or essential host functions [53].
- Point mutations or small indels in promoters, coding sequences, or ribosome binding sites that reduce or abolish circuit gene expression [54] [53].
The table below summarizes quantitative data on how design choices impact circuit longevity.
Table 1: Impact of Circuit Design and Context on Evolutionary Longevity
| Factor | Impact on Circuit Longevity | Key Findings | Source |
|---|---|---|---|
| Transcription Rate (ωA) | Negative Correlation | Higher transcription rates increase initial output (P0) but reduce the time for output to fall by half (τ50) due to increased burden. | [54] |
| Negative Autoregulation | Positive (Short-term) | Prolongs the time output remains within a narrow window (τ±10) of its initial value. | [54] |
| Growth-Based Feedback | Positive (Long-term) | Extends the functional half-life (τ50) of the circuit more effectively than intra-circuit feedback. | [54] |
| Genomic Integration | Positive | Prevents plasmid loss-mediated circuit failure, significantly enhancing long-term stability compared to plasmid-based systems. | [53] |
| Host Mutation Rate | Positive Correlation | Using reduced-genome E. coli strains with transposable elements removed reduced circuit failure rates by 10^3–10^5 fold. | [53] |
Host-Aware Control Strategies for Enhanced Stability
To mitigate the challenges described above, "host-aware" control strategies that dynamically regulate circuit activity in response to intracellular states have been developed. These controllers can be categorized by their input and actuation mechanism.
Table 2: Performance Comparison of Genetic Controller Architectures
| Controller Architecture | Control Input | Actuation Mechanism | Short-Term Performance (τ±10) | Long-Term Performance (τ50) | Key Advantage |
|---|---|---|---|---|---|
| Open-Loop | N/A | N/A | Baseline | Baseline | Simple design, high initial output. |
| Intra-Circuit Feedback | Output protein level | Transcriptional (TF) | Good | Moderate | Effective at maintaining set-point in the short term. |
| Intra-Circuit Feedback | Output protein level | Post-transcriptional (sRNA) | Very Good | Good | Strong control with reduced controller burden. |
| Growth-Based Feedback | Host growth rate | Transcriptional or Post-transcriptional | Moderate | Best | Directly counteracts the selective advantage of mutants. |
| Multi-Input Controller | e.g., Output + Growth | Combined | Best | Best | Optimizes both short-term performance and long-term persistence. |
Implementing a Post-Transcriptional Feedback Controller
This protocol details the implementation of a high-performance negative feedback controller using a small RNA (sRNA) to silence the mRNA of a circuit gene, thereby reducing burden and enhancing evolutionary longevity [54].
Experimental Protocol: sRNA-Mediated Feedback Controller
Principle: The controller senses the concentration of a target circuit protein (e.g., pA) and actuates a response via a transcription factor (TF) that drives the expression of a silencing sRNA. The sRNA binds to the mRNA of pA, preventing its translation and promoting degradation.
Materials:
- Plasmid System: A high-copy plasmid expressing the gene of interest (e.g.,
gene A) under a constitutive promoter. A compatible low- or medium-copy plasmid harboring the feedback controller. - Controller Parts:
- Sensing Module: A promoter (P_sense) activated by the protein pA.
- Actuation Module: A gene encoding a transcription factor (TF) under Psense, which in turn drives expression of the sRNA from a TF-responsive promoter (PTF).
- sRNA Scaffold: A designed sRNA sequence with high complementarity to the 5' UTR and/or coding region of the
gene AmRNA.
- Host Strain: An engineered E. coli strain such as DH5α or a reduced-genome variant (e.g., MDS42) to lower the background mutation rate [53].
- Culture Conditions: LB medium with appropriate antibiotics for plasmid maintenance.
Procedure:
- Cloning and Transformation:
- Assemble the
gene Aexpression plasmid and the controller plasmid using a DNA assembly method (e.g., Golden Gate Assembly [55]). - Co-transform both plasmids into the selected E. coli host strain. Include control strains with
gene Aplasmid only (open-loop) and with a non-functional sRNA controller.
- Assemble the
Serial Passaging Experiment:
- Inoculate 3 mL of LB medium with antibiotics with a single colony of the engineered strain. Incubate at 37°C with shaking (220 rpm) for 24 hours.
- Every 24 hours, perform a 1:1000 dilution of the culture into fresh, pre-warmed medium. This simulates long-term growth under batch conditions and allows mutant competition to emerge [54].
- Continue passaging for at least 7-14 days.
Monitoring and Data Collection:
- Fluorescence Measurement: If
gene Ais a fluorescent protein (e.g., GFP), measure fluorescence at each passage using a plate reader. Normalize fluorescence by optical density (OD600) to determine output per cell. - Population Analysis: Periodically, plate diluted cultures on agar plates to isolate single colonies. Image the plates to quantify the distribution of fluorescence across the population, identifying the emergence of non-producing mutants.
- Data Fitting: Fit the population-level output data to calculate the longevity metrics τ±10 and τ50, as defined in [54].
- Fluorescence Measurement: If
Troubleshooting:
- High Leakiness: If the sRNA controller has high expression in the absence of pA, optimize the ribosome binding site (RBS) of the TF or sRNA, or use a weaker P_sense promoter.
- Oscillations: If the feedback is too strong, it can cause undesirable oscillations in protein levels. Tune the feedback strength by modulating the copy number of the controller plasmid or the affinity of the sRNA for its target.
Diagram 1: sRNA feedback controller pathway. The controller uses the target protein (pA) to activate its own silencing via an sRNA, creating a dynamic, burden-reducing feedback loop.
Implementing a Multi-Layered Circuit with Orthogonal Parts
For multi-step circuits, such as those required for complex metabolic regulation, avoiding resource competition and crosstalk is critical. This protocol describes the construction of a multi-layered cascade using orthogonal, de-novo-designed RNA regulators [55].
Experimental Protocol: Constructing a Three-Layer RNA Cascade Circuit
Principle: A cascade circuit is built using orthogonal Switchable Transcription Terminators (SWTs), where the output RNA from one layer acts as the input trigger for the next, ensuring minimal crosstalk and reduced protein-based burden.
Materials:
- SWT Library: A set of pre-designed and validated orthogonal SWT parts. Each SWT consists of a toehold domain for trigger RNA binding and a terminator domain (e.g., T500 variant) that halts transcription until activated [55].
- Reporter System: A fluorescent RNA aptamer (e.g., 3WJdB) transcribed upon SWT activation.
- Cell-Free System: A purified E. coli-based or commercial cell-free transcription-translation system (e.g., PURExpress) to enable rapid prototyping.
- Plasmids & Cloning: High-copy plasmids with T7 promoters for in vitro transcription. Golden Gate Assembly kits.
Procedure:
- Circuit Design and In Silico Validation:
- Design the DNA templates for the three-layer cascade. Each layer consists of a T7 promoter driving an SWT, which, when activated, transcribes the trigger RNA for the next layer. The final layer transcribes the 3WJdB reporter.
- Use the NUPACK software package to perform a multi-tube orthogonality analysis. Confirm that each trigger RNA strongly binds only to its cognate SWT and has minimal interaction (crosstalk) with non-cognate SWTs [55].
Plasmid Construction:
- Assemble the individual layer plasmids and the final reporter plasmid separately using Golden Gate Assembly.
- Transform into E. coli DH5α for propagation. Isolate and sequence-verify the plasmids.
In Vitro Transcription and Testing:
- Template Preparation: Linearize the plasmid templates by PCR to create DNA fragments containing the T7 promoter and the circuit sequence.
- Transcription Reaction: For each circuit configuration, prepare a 30 μL reaction containing:
- 5-40 nM of linear DNA template.
- 40 μM of DFHBI-1T (fluorophore for 3WJdB).
- 0.5 mM of NTPs.
- 1.5 μL of T7 RNA Polymerase (50 U/μL).
- 0.75 μL of ribonuclease inhibitor.
- Reaction buffer (40 mM Tris-HCl pH 7.9, 6 mM MgCl₂, 2 mM spermidine, 1 mM DTT).
- Incubate the reaction at 37°C in a 384-well plate for 2 hours.
Fluorescence Measurement and Analysis:
- Measure the 3WJdB fluorescence (Ex/Em: 472/507 nm) using a plate reader.
- For each circuit, calculate the Fold Change as the normalized fluorescence in the ON state (with initial input trigger) divided by the normalized fluorescence in the OFF state (without input) [55].
- A successful three-layer cascade will show a high fold change, demonstrating signal propagation with minimal leakage.
Troubleshooting:
- Low Fold Change: This indicates high leakage or poor activation. Redesign the SWT's toehold or terminator domain to improve performance. Test different terminator variants (e.g., T500 mutants).
- Signal Drop-Off: If the signal weakens across layers, the trigger RNA from one stage may be insufficient to fully activate the next. Optimize the promoter strength or SWT design of the intermediate layers.
Diagram 2: A three-layer RNA cascade circuit. Signal propagation is mediated entirely by orthogonal RNA molecules, reducing metabolic burden and crosstalk compared to protein-based systems.
Table 3: Research Reagent Solutions for Stable Circuit Design
| Reagent / Resource | Function | Example & Notes |
|---|---|---|
| Reduced-Genome Host Strains | Lowers the background mutation rate by removing transposable elements and genomic islands, drastically reducing IS-mediated circuit failure. | E. coli MDS42 [53]. |
| Orthogonal RNA Regulators | Enables construction of multi-layer circuits with minimal resource competition and crosstalk. Reduces protein-based burden. | Switchable Transcription Terminators (SWTs), Small Transcription Activating RNAs (STARs) [55]. |
| Cell-Free Expression Systems | Allows for rapid, isolated prototyping of genetic circuits without complex host interactions, enabling quick debugging and optimization. | PURExpress, homemade E. coli lysate systems [55]. |
| Software for Orthogonality Design | Computationally designs and predicts interactions between synthetic biological parts to ensure they function independently in complex circuits. | NUPACK package for nucleic acid sequence design and analysis [55]. |
| Genomic Integration Tools | Prevents plasmid loss by stably inserting the circuit into the host chromosome, enhancing long-term genetic stability. | CRISPR-based integration, phage integrases [53]. |
The stability and robustness of multi-step genetic circuits are not inherent but must be deliberately engineered through host-aware design principles. As detailed in this Application Note, successful strategies involve moving beyond simple, open-loop designs and incorporating dynamic control systems that respond to intracellular states like protein output and growth rate. The implementation of post-transcriptional controllers and the use of orthogonal RNA-based parts provide powerful methods to minimize metabolic burden and module interference, thereby extending functional longevity.
Integrating these strategies—from selecting evolutionarily robust host strains to implementing sophisticated feedback control in circuit logic—enables the construction of high-performance genetic circuits. These advances are pivotal for the next generation of reliable biological devices, particularly in demanding applications such as dynamic metabolic pathway regulation and long-term biosensing, where sustained and predictable function is paramount.
Integration of Antithetic Feedback Controllers for Enhanced Robustness
The pursuit of robust and efficient microbial cell factories for biomanufacturing is often challenged by environmental fluctuations, metabolic imbalances, and intrinsic noise in cellular processes. Static metabolic engineering approaches are frequently unable to maintain optimal performance under industrial-scale variable conditions. Dynamic regulation strategies, particularly those employing biosensor-enabled feedback control, present a promising solution to these limitations [13]. Among these strategies, the antithetic integral feedback (AIF) motif has emerged as a foundational synthetic biology circuit that guarantees robust perfect adaptation (RPA)—the ability to maintain precise regulation of a target molecular species despite constant disturbances or parametric uncertainties [56] [57].
This application note explores the integration of antithetic feedback controllers within metabolic pathways, focusing on practical implementation strategies to enhance robustness. We provide a detailed analysis of the AIF mechanism, its extension with proportional and derivative components, and a protocol for implementing an AIF-controlled flavonoid pathway in Escherichia coli. The content is structured to equip researchers with both theoretical understanding and practical methodologies for incorporating these controllers into metabolic engineering projects.
Theoretical Foundation of Antithetic Integral Feedback
Core Mechanism and Robust Perfect Adaptation
The antithetic integral feedback controller is a biomolecular circuit that achieves integral control through a stoichiometric sequestration mechanism. The core controller consists of two species, Z₁ and Z₂, which bind to form an irreversible complex at a rate proportional to the product of their concentrations. One controller species (Z₁) is produced at a constant rate, while the other (Z₂) is produced at a rate proportional to the current level of the controlled system output [56].
The fundamental dynamics can be represented as:
- dZ₁/dt = μ - η·Z₁·Z₂
- dZ₂/dt = θ·Xₗ - η·Z₁·Z₂
Where μ is the constant production rate of Z₁, θ is the measurement gain of the controlled species Xₗ, and η is the sequestration rate. The actuation of the controlled process is typically achieved through the concentration of Z₁, which regulates the production rate of an upstream pathway species [56] [57].
The key property of this system is its ability to maintain the mean concentration of the controlled species Xₗ at a precise set-point defined by the ratio μ/θ, independent of the network's specific kinetic parameters. This property, known as robust perfect adaptation, allows the system to reject constant disturbances and maintain homeostasis [56] [57].
Table 1: Key Properties of the Antithetic Integral Feedback Motif
| Property | Mathematical Description | Biological Significance |
|---|---|---|
| Robust Perfect Adaptation | limt→∞ E[Xₗ(t)] = μ/θ | Maintains precise regulation despite parameter variations and constant disturbances [57] |
| Stoichiometric Sequestration | Z₁ + Z₂ → ∅ | Enables integration of error signal through molecular binding [56] |
| Controller Stability | Conditions independent of controller parameters | Ensures reliable performance across cellular contexts [56] |
Performance Limitations and Enhanced Architectures
A significant limitation of the standalone AIF controller is that it can lead to increased variance in the controlled species compared to open-loop constitutive expression. This elevated cell-to-cell heterogeneity represents a performance trade-off for achieving perfect adaptation [56].
To address this limitation, researchers have developed hybrid architectures that combine the AIF motif with additional regulatory components:
Proportional-Integral (PI) Control: Adding a proportional component to the AIF controller can reduce stationary variance and improve transient performance. The proportional action can be implemented through a repressing Hill-type function that responds to the output species [56] [57].
Proportional-Integral-Derivative (PID) Control: Further enhancement through derivative action can suppress fluctuations more effectively and improve response time. Derivative components can be implemented through incoherent feedforward loops or by placing integrators in negative feedback configurations [57] [58].
These enhanced architectures create a hierarchy of controllers offering different trade-offs between complexity, performance, and implementability. The addition of proportional action has been shown to potentially reduce variance below constitutive levels, though this may come at the cost of increased settling time [56].
Application Case Study: Regulated Flavonoid Production
The flavonoid biosynthesis pathway, particularly naringenin production in E. coli, serves as an excellent case study for implementing antithetic feedback control. Naringenin is a central flavonoid scaffold with pharmaceutical and nutraceutical applications, but its microbial production faces challenges in achieving economically viable titers due to metabolic imbalances and pathway inefficiencies [13] [59].
The pathway consists of four enzymatic steps starting from the L-tyrosine precursor:
- Conversion of L-tyrosine to p-coumaric acid by tyrosine ammonia lyase (TAL)
- Conversion of p-coumaric acid to p-coumaroyl-CoA by 4-coumarate:CoA ligase (4CL)
- Formation of naringenin chalcone by chalcone synthase (CHS)
- Cyclization to naringenin by chalcone isomerase (CHI) [13]
The control objective is to maintain optimal flux through this heterologous pathway while minimizing the accumulation of potentially toxic intermediates and balancing metabolic burden on the host.
Extended Metabolic Biosensor Integration
An extended metabolic biosensor approach is employed where a transcription factor (TF) responsive to a downstream effector metabolite is combined with the AIF controller. The FdeR transcription factor from Herbaspirillum seropedicae, which activates gene expression in the presence of naringenin, serves as the sensing component [13] [59].
In this configuration, the biosensor detects naringenin concentration (output), while the AIF controller regulates upstream pathway enzymes (input) to maintain naringenin at the desired set-point. This creates a closed-loop system that dynamically adjusts pathway flux based on real-time metabolic conditions [13].
Table 2: Implementation Components for AIF-Controlled Naringenin Pathway
| Component | Type | Function in Control System |
|---|---|---|
| FdeR Transcription Factor | Sensor | Detects naringenin concentration and transduces signal [59] |
| Orthogonal Quorum-Sensing Molecules (Qₚ, Qₛ) | Communicator | Enable multicellular control implementation [58] |
| Sequestration Pair (Z₁, Z₂) | Actuator | Implements integral control through binding reaction [56] |
| pCAP Promoter | Regulator | Tunable promoter for fine-tuning controller gains [59] |
| Fluorescent Reporter (GFP) | Monitor | Enables tracking of biosensor response and system performance [59] |
Experimental Protocols
Protocol 1: Biosensor Library Assembly and Characterization
This protocol details the construction and characterization of a naringenin-responsive biosensor library for implementation in the AIF-controlled pathway [59].
Materials:
- Plasmid Backbones: High-copy (p15A origin) and medium-copy (pSC101 origin) plasmids
- Biological Parts: FdeR coding sequence, operator region (fdeO), reporter genes (GFP, YFP)
- Promoter Library: P1, P2, P3, P4 promoters of varying strengths
- RBS Library: 5 RBS sequences with different translation initiation rates
- Host Strain: E. coli MG1655 or equivalent
- Media: M9 minimal media with varied carbon sources (glucose, glycerol, sodium acetate)
Procedure:
Modular Assembly of Biosensor Constructs
- Assemble the FdeR expression module using Golden Gate or Gibson Assembly with combinations of promoters and RBSs from the library.
- Clone the sensing module containing the fdeO operator followed by a GFP reporter gene.
- Transform constructs into E. coli and verify through colony PCR and sequencing.
Dose-Response Characterization
- Grow biosensor strains overnight in M9 glucose medium at 37°C with appropriate antibiotics.
- Dilute cultures to OD₆₀₀ = 0.05 in fresh medium containing naringenin concentrations from 0 to 800 μM.
- Measure fluorescence and OD₆₀₀ every 30 minutes for 18 hours using a plate reader.
- Calculate normalized fluorescence (fluorescence/OD₆₀₀) and plot dose-response curves.
Dynamic Range Assessment
- Determine the dynamic range as the fold-change between maximal and minimal GFP expression.
- Calculate EC₅₀ from dose-response curves using nonlinear regression with Hill equation.
- Select constructs with Hill coefficients >2 and dynamic range >50-fold for controller implementation.
Context Dependency Testing
- Test selected constructs in different media (M9, SOB, LB) with various carbon sources.
- Assess performance under industrial-relevant conditions including substrate shifts and nutrient limitations.
Protocol 2: Implementation of Antithetic Integral Feedback Controller
This protocol describes the implementation of the complete AIF-controlled naringenin pathway in E. coli [13] [56].
Materials:
- Controller Plasmids: Vectors containing genes for Z₁ and Z₂ sequestration pair
- Pathway Plasmids: Plasmids encoding TAL, 4CL, CHS, and CHI enzymes
- Induction System: Tunable expression system for controller components (e.g., arabinose-inducible)
- Analytical Equipment: HPLC for naringenin quantification
Procedure:
Strain Construction
- Transform the naringenin biosensor construct (from Protocol 1) into production host.
- Introduce pathway plasmids with enzyme expression under control of Z₁-regulated promoters.
- Incorporate controller plasmids expressing Z₁ and Z₂ sequestration pair.
- Verify all components through antibiotic selection and colony PCR.
Controller Tuning
- Vary RBS strengths for Z₁ and Z₂ production to adjust integral gain.
- Test different sequestration rates (η) by engineering binding affinities between Z₁ and Z₂.
- Measure steady-state naringenin levels and convergence to set-point (μ/θ).
Performance Validation
- Grow controlled strain in bioreactor with continuous monitoring of OD and fluorescence.
- Introduce disturbances at mid-exponential phase (e.g., substrate pulse, temperature shift).
- Sample periodically for naringenin quantification by HPLC.
- Compare performance against constitutive and unregulated strains.
Robustness Assessment
- Test across different cultivation conditions (media, temperature, pH).
- Measure population heterogeneity through single-cell fluorescence microscopy.
- Quantify adaptation precision as variance from set-point after disturbance.
The Scientist's Toolkit
Table 3: Research Reagent Solutions for Antithetic Feedback Implementation
| Reagent/Resource | Function | Example Sources/References |
|---|---|---|
| FdeR Transcription Factor | Naringenin biosensor component | Herbaspirillum seropedicae; engineered variants [59] |
| Orthogonal Quorum-Sensing Systems | Intercellular communication in multicellular implementations | LuxI/LuxR, LasI/LasR, orthogonal engineered pairs [58] |
| Sequestration Pairs | Implementation of integral control through binding | Toxin/antitoxin, sigma/anti-sigma, mRNA/antisense RNA pairs [56] |
| Tunable Promoter Library | Fine-tuning controller gains and dynamic range | Synthetic promoters, RBS library, degradation tags [59] |
| Reporter Proteins | Monitoring biosensor response and system performance | GFP, YFP, other fluorescent proteins with varying half-lives [59] |
Visualization Schematics
Antithetic Integral Feedback Mechanism
Design-Build-Test-Learn Workflow
The integration of antithetic feedback controllers with metabolic pathways represents a significant advancement in synthetic biology's capacity to create robust cellular factories. The AIF motif provides a theoretically grounded framework for achieving robust perfect adaptation, while its extension through proportional and derivative components addresses performance limitations in variance and transient response. The implementation protocol for naringenin production illustrates a practical pathway to deploying these controllers in biomanufacturing contexts. As the field progresses, the combination of mechanistic modeling with machine learning approaches will further enhance our ability to design context-aware controllers that maintain performance across diverse industrial conditions.
Biosensor Tuning Under Industrial Biomanufacturing Operating Constraints
The integration of biosensors into industrial biomanufacturing represents a paradigm shift from static to dynamic metabolic control, enabling microbial cell factories to autonomously respond to fluctuating production environments. Traditional metabolic engineering has largely focused on the direct construction of synthetic pathways, often overlooking the critical role of dynamic regulation that natural systems exploit for robust performance [5]. In industrial settings, where parameters like nutrient levels, pH, and dissolved oxygen constantly vary despite attempts to tightly control reactor conditions, this oversight becomes particularly problematic, leading to reduced productivity and pathway imbalances [5]. Biosensors address these challenges by serving as biological components that detect specific intracellular or environmental signals and convert them into measurable outputs, thereby enabling real-time monitoring and control of bioprocesses [60] [61].
The tuning of these biosensors for optimal performance under industrial operating constraints presents unique challenges that differ markedly from laboratory applications. Industrial production processes demand increased yields and consistent product quality while minimizing microbial stress exposure and enhancing metabolic accuracy [62]. Biosensors must maintain functionality and reliability despite harsh stresses including extreme temperatures, pH variations, and high concentrations of toxic compounds or metabolites [62]. Furthermore, the transition from laboratory-scale validation to industrial implementation introduces multi-scale problems where physiological responses interact with vessel-specific physical conditions [62]. This application note provides a comprehensive framework for the systematic optimization of biosensor performance under these demanding industrial constraints, with specific protocols for parameter quantification, tuning methodologies, and implementation strategies tailored for dynamic metabolic pathway regulation.
Performance Parameters for Industrial Biosensor Tuning
For industrial applications, biosensors must be characterized against a standardized set of quantitative performance metrics that collectively determine their operational effectiveness in biomanufacturing environments. These parameters should be optimized not in isolation but with consideration of their interrelationships and trade-offs, which significantly impact overall biosensor performance.
Table 1: Key Performance Parameters for Industrial Biosensor Tuning
| Parameter | Definition | Industrial Significance | Optimal Range for Industry |
|---|---|---|---|
| Dynamic Range | Span between minimal and maximal detectable signals [5] | Determines applicability across varying metabolite concentrations | 3-4 orders of magnitude [5] |
| Operating Range | Concentration window for optimal biosensor performance [5] | Must align with relevant intracellular metabolite levels | Pathway-dependent (μM-mM) [5] |
| Response Time | Speed at which biosensor reacts to changes [5] | Critical for real-time process control; slow response hinders controllability | Seconds to minutes for fast regulation [5] |
| Signal-to-Noise Ratio | Clarity and reliability of output signal [5] | High noise obscures subtle metabolite differences, reducing resolution | >5:1 for reliable detection [5] |
| Sensitivity | Minimal detectable concentration change [5] | Determines ability to detect metabolically relevant fluctuations | nM-μM range for most metabolites [5] |
| Specificity | Selectivity for target analyte over similar molecules | Prevents false responses in complex fermentation broths | Varies with pathway complexity |
Thorough biosensor characterization is essential to ensure functional reliability and scalability in industrial environments [5]. The dose-response curve, which maps output signal as a function of analyte concentration, defines the sensor's sensitivity and dynamic range, ensuring operation within a useful detection window for desired metabolite concentrations [5]. Additionally, response time dynamics describe how quickly a biosensor reaches its maximum signal after exposure to the target, becoming pivotal for applications requiring rapid decision-making or real-time monitoring [5]. Signal noise, another key consideration, reflects output variability under constant input conditions, where high levels can obscure subtle differences in metabolite concentrations, reducing sensor resolution and complicating high-throughput screening workflows [5].
Figure 1: Interrelationship between key biosensor performance parameters and industrial constraints. Dynamic and static parameters must be balanced against operational challenges for effective industrial implementation.
Systematic Optimization Approaches
Experimental Design (DoE) for Biosensor Optimization
The systematic optimization of biosensors for industrial applications requires methodologies that efficiently account for multiple interacting variables. Experimental Design (DoE) represents a powerful chemometric approach that enables comprehensive optimization while minimizing experimental effort [63]. Unlike traditional one-variable-at-a-time approaches, DoE facilitates the development of data-driven models that connect variations in input parameters to sensor outputs, while accounting for potential interactions between variables that often elude detection in univariate strategies [63].
The DoE workflow initiates by identifying all factors that may exhibit a causality relationship with the targeted output signal (response). Subsequent steps involve establishing experimental ranges and distributing experiments within the experimental domain. Responses gathered from predetermined points are utilized to construct a mathematical model through linear regression, elucidating the relationship between outcomes and experimental conditions [63]. This approach provides comprehensive, global knowledge of the optimization space, enabling prediction of responses at any point within the experimental domain, including areas where direct experiments haven't been conducted [63].
Table 2: Experimental Design Strategies for Biosensor Optimization
| Design Type | Experimental Requirements | Model Capability | Optimal Use Case |
|---|---|---|---|
| Full Factorial | 2^k experiments for k variables [63] | First-order with interactions [63] | Initial screening of significant factors |
| Central Composite | Factorial points + center points + axial points [63] | Second-order (quadratic) models [63] | Response surface modeling for fine-tuning |
| Mixture Design | Components sum to 100% [63] | Constrained optimization [63] | Formulation optimization with interdependencies |
For biosensors exhibiting approximately linear response with respect to independent variables, first-order orthogonal designs like full factorial designs can yield substantial information with minimal experimental effort [63]. However, when responses follow quadratic functions, second-order models become essential, with central composite designs augmenting initial factorial designs to estimate quadratic terms and enhance predictive capacity [63]. Mixture designs are particularly valuable when optimizing formulations where components must sum to 100%, such as in media formulation or immobilization matrix development [63].
Molecular Engineering Strategies
At the molecular level, several well-established strategies enable fine-tuning of biosensor parameters to meet industrial requirements. These approaches leverage synthetic biology tools to modify biosensor components systematically:
Promoter Engineering: Modification of promoter sequences and strength represents a fundamental approach for adjusting biosensor sensitivity and dynamic range [5] [9]. Strong promoters typically increase sensitivity but may reduce dynamic range, while weaker promoters often exhibit the opposite effect [5].
Ribosome Binding Site (RBS) Optimization: Varying the number and position of RBS sequences enables precise control over translation efficiency, directly impacting biosensor output magnitude and response characteristics [5] [9]. Computational tools can predict RBS strength for systematic optimization.
Operator Region Manipulation: Altering the number and position of operator regions where transcription factors bind can significantly impact dose-response curves, particularly for transcription factor-based biosensors [5].
Chimeric Fusion Proteins: Creating fusion proteins between DNA-binding domains and ligand-binding domains from different transcription factors can engineer novel biosensor specificities, expanding the range of detectable compounds [5].
Directed Evolution: Implementing high-throughput techniques like cell sorting combined with directed evolution strategies can lead to improved sensitivity and specificity when natural biosensor components don't meet industrial requirements [5].
Protocol: Industrial Tuning of Transcription Factor-Based Biosensors
Background and Principles
Transcription factor (TF)-based biosensors constitute a major class of protein-based biosensors that regulate gene expression by binding DNA in response to specific metabolites [5]. These biosensors typically consist of a transcription factor that responds to a target ligand and a corresponding promoter that controls reporter gene expression. In industrial applications, TF-based biosensors have been successfully deployed for detecting diverse analytes including alcohols, flavonoids, organic acids, and aromatic compounds [5] [26].
This protocol describes a systematic methodology for tuning TF-based biosensors to achieve optimal performance under industrial biomanufacturing constraints, with particular emphasis on dynamic range, response time, and operational stability. The protocol assumes prior identification of a TF-promoter pair with basic functionality for the target metabolite.
Materials and Equipment
Table 3: Essential Research Reagent Solutions for Biosensor Tuning
| Reagent/Material | Function | Industrial Application Considerations |
|---|---|---|
| Plasmid Library with Promoter Variants | Provides genetic diversity for promoter engineering [5] | Maintain adequate library complexity (>10^4 variants) for sufficient sampling of parameter space |
| RBS Library Calculator | Computational design of RBS sequences with varying strengths [5] | Use predictive algorithms (e.g., RBS Calculator) to cover >100-fold translation efficiency range |
| Flow Cytometer with Cell Sorter | High-throughput quantification and isolation of optimized variants [5] | Must maintain sterility for industrial strain development; capable of processing >10^7 events/hour |
| Microfluidic Bioreactor System | Mimics industrial-scale conditions in lab setting [62] | Should control dissolved O2, pH, temperature with industrial-relevant dynamics and gradients |
| Design of Experiments Software | Statistical planning and analysis of optimization experiments [63] | Capable of handling factorial, response surface, and mixture designs with multiple constraints |
Step-by-Step Procedure
Step 1: Initial Characterization of Native Biosensor
- Inoculate engineered biosensor strain in appropriate industrial-relevant medium
- Expose to analyte gradient (typically 0.1-10x expected industrial concentration range)
- Measure dose-response curve using fluorescence (for reporter-based systems) or other output signal
- Quantify dynamic range, EC50/IC50, background signal, and response time
- Establish baseline performance metrics for subsequent optimization
Step 2: Experimental Design Setup
- Identify critical factors for optimization (e.g., promoter strength, RBS strength, TF expression level, operator sequence)
- Define feasible ranges for each factor based on molecular biological constraints
- Select appropriate experimental design (typically starting with fractional factorial for >4 factors)
- Generate experimental matrix specifying genetic constructs to be built
- Allocate resources for parallel construction and characterization
Step 3: Library Construction and Transformation
- Implement library construction using appropriate method (Golden Gate assembly, Gibson assembly, etc.)
- Include appropriate selection markers and genomic integration sequences if applicable
- Transform into industrial production host strain
- Verify library diversity by sequencing 24-48 random clones
Step 4: High-Throughput Screening Under Simulated Industrial Conditions
- Cultivate biosensor variants in microtiter plates with simulated industrial conditions:
- pH gradients (6.5-7.5 for most bacterial systems)
- Temperature fluctuations (±2°C around setpoint)
- Oscillating nutrient availability (feast-famine cycles)
- For each variant, measure:
- Output signal intensity across analyte concentration series
- Response time from analyte addition to 90% maximal signal
- Growth rate and final biomass (to assess metabolic burden)
- Signal stability over 24-48 hour period
Step 5: Data Analysis and Model Building
- Fit response surfaces for each performance metric vs. genetic factors
- Identify significant main effects and interaction terms
- Construct multi-objective optimization function incorporating industrial weights
- Validate model predictions by testing additional constructs not in original design
- Iterate experimental design if model shows lack of fit
Step 6: Scale-Up Validation
- Select 3-5 top-performing variants for bench-scale bioreactor validation
- Operate bioreactors with industry-relevant parameters and control strategies
- Challenge biosensors with realistic process disturbances (nutrient pulses, temporary oxygen limitation)
- Assess performance over extended cultivation period (5-10 generations)
- Evaluate genetic stability through endpoint sequencing
Troubleshooting and Industrial Adaptation
Slow Response Time: Implement hybrid approaches that combine stable systems with faster-acting components, such as riboswitches [5]. Consider engineering allosteric regulation points in the transcription factor itself.
High Signal Noise: Modify genetic context to reduce transcriptional bursting. Incorporate noise-filtering genetic circuits or implement digital response rather than analog output.
Narrow Dynamic Range: Employ promoter engineering with intermediate strength variants. Implement tandem operator sites with cooperative binding characteristics.
Limited Operational Stability: Ensure genomic integration rather than plasmid-based systems for industrial deployment. Include redundant regulatory mechanisms to compensate for mutation effects.
Industrial Implementation Case Studies
Lignocellulosic Biomass Conversion
In lignocellulosic biomass conversion for production of biofuels and biochemicals, biosensors have been successfully implemented to address challenges related to substrate inhibition and pathway imbalances [9]. Specifically, transcription factor-based biosensors responsive to key intermediates in the shikimate pathway have enabled dynamic regulation of aromatic compound production [9] [26]. For instance, HucR-based vanillin biosensors and PadR-based p-coumaric acid biosensors have been engineered with expanded dynamic ranges and superior sensitivity, allowing real-time monitoring and control of these valuable compounds during microbial fermentation of lignocellulosic hydrolysates [26].
Implementation in industrial settings required careful tuning of operating ranges to accommodate the complex mixture of inhibitors and substrates present in real lignocellulosic feedstocks, as opposed to clean laboratory media [9]. This was achieved through directed evolution of transcription factor specificity under gradually increasing concentrations of authentic hydrolysate, ultimately producing biosensor variants that maintained functionality under industrial conditions [9].
Astaxanthin Production in Microalgae
In the industrial production of astaxanthin from the microalga Haematococcus pluvialis, biosensors were implemented to optimize harvest timing and reduce production costs by approximately 30% [64]. The production process involves two distinct cultivation stages: a green stage for biomass accumulation followed by a nutrient-deficient stage that induces astaxanthin biosynthesis [64].
Four specialized biosensors were developed and tuned for this application:
- An optical biosensor for monitoring cell turbidity and concentration
- A fluorescence-based sensor for tracking photosynthetic activity and carotenoid accumulation
- An electrochemical biosensor using screen-printed electrodes for astaxanthin quantification
- A nanowire-FET biosensor based on photosystem II activity for sensitive astaxanthin detection [64]
Tuning these biosensors for industrial deployment required optimizing their stability for continuous operation in photobioreactor environments and ensuring sufficient detection limits to accurately monitor the astaxanthin accumulation profile, which reaches approximately 4% of dry biomass [64]. The successful implementation demonstrated how biosensor networks, rather than individual sensors, can collectively address the multi-parameter optimization challenges inherent in industrial bioprocesses.
The tuning of biosensors for industrial biomanufacturing requires a systematic approach that balances multiple performance parameters against the constraints of scale-up environments. Through the application of statistical experimental design, molecular engineering strategies, and rigorous validation under industrially relevant conditions, biosensors can be optimized to deliver the reliability, stability, and dynamic performance necessary for implementation in commercial bioprocesses. The continued advancement of biosensor technology, particularly through integration with machine learning and adaptive control algorithms, promises to further enhance their capability to regulate complex metabolic pathways under the dynamic conditions characteristic of industrial biomanufacturing.
Mitigating Non-Specific Adsorption and Signal Interference in Complex Media
Non-specific adsorption (NSA) and signal interference present formidable challenges in biosensor applications, particularly within complex media such as blood, serum, and fermentation broths. These phenomena significantly compromise key analytical performance metrics including sensitivity, specificity, and reproducibility [65] [66]. For researchers investigating dynamic metabolic pathway regulation, where accurate, real-time monitoring of metabolite concentrations is paramount, overcoming these limitations is essential for obtaining reliable data [13] [6]. NSA occurs when non-target molecules, such as proteins, lipids, or other cellular components, physisorb onto the biosensor surface through hydrophobic forces, ionic interactions, van der Waals forces, and hydrogen bonding [65] [66]. This fouling leads to elevated background signals, false positives, reduced dynamic range, and can obscure the specific signal from target metabolites, ultimately impeding the accurate feedback control necessary for engineered metabolic pathways [65] [66] [6].
This Application Note provides a structured framework of strategies and detailed protocols designed to mitigate NSA and signal interference, specifically tailored for biosensors deployed in complex biological environments relevant to metabolic engineering and drug development research.
Quantitative Comparison of Mitigation Strategies
The following tables summarize the key characteristics and performance metrics of established methods for reducing NSA and signal interference.
Table 1: Performance Comparison of Passive Antifouling Materials
| Material Class | Example Materials | Mechanism of Action | Reported Performance | Compatibility |
|---|---|---|---|---|
| Polymer Brushes | POEGMA, PEG [67] | Creates a hydrated, neutral barrier that resists protein adhesion | Extends Debye length; enables attomolar detection in PBS [67] | Electrochemical, Optical, BioFETs |
| Proteins | BSA, Casein, Milk Proteins [65] | Blocks vacant surface sites through passive adsorption | Standard for ELISA & Western blot; limited stability [65] | General purpose, microplates |
| Hydrogels | Dextran, Polyacrylamide | Hydrated network sterically hinders approach of foulants | Common in SPR biosensors; can reduce accessibility [68] | SPR, Optical |
| Carbon Nanomaterials | Gii-carbon, graphene [69] | Innate antifouling properties and high conductivity | Reduces need for coatings; improves S/N ratio [69] | Electrochemical |
| Surfactant-Modified MIPs | SDS-modified P4VP, CTAB-modified PMAA [70] | Surfactants mask external functional groups on polymers | Reduces non-specific binding on MIPs by ~60-70% [70] | Electrochemical Sensors |
Table 2: Active NSA Removal Methods and Noise Reduction Techniques
| Method | Principle | Key Implementation Parameter | Impact on Signal & Noise |
|---|---|---|---|
| Electromechanical | Generates surface shear forces to physically desorb weakly bound molecules [65] | Specific frequency/amplitude depending on transducer | Can reduce baseline drift; risk of damaging fragile bioreceptors |
| Acoustic (e.g., SAW) | Uses sound waves to create interfacial forces [65] | Power and frequency of acoustic waves | Effective for surface regeneration; can be integrated in microfluidics |
| Hydrodynamic | Relies on controlled fluid flow to generate shear forces [65] | Flow rate and channel geometry design | Simple to implement; may require higher sample volumes |
| Donnan Potential Extension | Uses polymer brushes (POEGMA) to create a net charge layer extending the Debye length [67] | Polymer brush density and thickness | Enables detection of large antibodies in physiological buffer (1X PBS) [67] |
| Rigorous Electrical Testing | Uses infrequent DC sweeps instead of continuous static/AC measurements to distinguish drift from signal [67] | Sweep frequency and data analysis protocol | Mitigates misinterpretation of signal drift as analyte binding [67] |
Detailed Experimental Protocols
Protocol 1: Surface Passivation with POEGMA Brush for BioFETs
This protocol details the application of a poly(oligo(ethylene glycol) methyl ether methacrylate) (POEGMA) brush on a biosensor surface to mitigate biofouling and extend the Debye length for enhanced sensitivity in high-ionic-strength solutions [67].
Key Reagents & Materials:
- Sensor substrate (e.g., CNT thin-film transistor)
- Oligo(ethylene glycol) methyl ether methacrylate (OEGMA) monomer
- ATRP initiator (e.g., α-bromoisobutyryl bromide)
- Copper(II) bromide, Copper(I) bromide, and PMDETA ligand
- Anhydrous ethanol and methanol
- Nitrogen or argon gas supply
Procedure:
- Surface Initiation:
- Clean the sensor substrate thoroughly with oxygen plasma.
- Immerse the substrate in a 1% (v/v) solution of ATRP initiator in anhydrous toluene for 30 minutes under an inert atmosphere to immobilize the initiator on the surface.
- Rinse sequentially with toluene, methanol, and ethanol to remove any physisorbed initiator. Dry under a stream of inert gas.
- Polymer Brush Growth:
- Prepare the polymerization solution in a schlenk flask under inert gas. For 10 mL: dissolve 1.0 g of OEGMA monomer in a 1:1 (v/v) mixture of ethanol and water. Add 7.0 μL of PMDETA ligand.
- Degas the solution by bubbling with inert gas for 20 minutes.
- Add 2.8 mg of Cu(I)Br and 0.6 mg of Cu(II)Br to the flask to initiate the reaction.
- Immediately transfer the activated sensor substrate into the flask. Seal and allow the reaction to proceed for 1-2 hours at room temperature with gentle agitation.
- Termination and Cleaning:
- Carefully remove the substrate from the reaction mixture and rinse extensively with ultrapure water and ethanol to terminate the polymerization and remove catalyst residues.
- Characterize the resulting POEGMA brush layer using ellipsometry (target thickness: 20-50 nm) and contact angle measurement (target < 30°).
- Surface Initiation:
Troubleshooting:
- Inconsistent Brush Thickness: Ensure rigorous degassing of the polymerization solution to prevent catalyst deactivation.
- High Contact Angle: This may indicate insufficient polymerization or contamination; repeat the initiation step with fresh reagents.
- Performance Validation: The success of the coating can be functionally validated by measuring the impedance or NSA after exposure to 100% serum or 1X PBS [67].
Protocol 2: Reducing Drift and Screening in CNT-Based BioFETs
This protocol outlines a stringent electrical testing methodology to differentiate authentic biomarker binding signals from inherent device signal drift, a critical step for achieving reliable quantification [67].
Key Reagents & Materials:
- POEGMA-functionalized CNT BioFET (from Protocol 1)
- Handheld potentiostat with a pseudo-reference electrode (e.g., Pd)
- Automated fluidic handling system or precise pipettes
- Analyte solutions in 1X PBS
- Control solutions (1X PBS only, isotype control antibodies)
Procedure:
- Device Preparation and Baseline Acquisition:
- Integrate the sensor into a stable testing configuration that minimizes mechanical vibration and thermal fluctuations.
- Apply a continuous gate voltage to condition the device in 1X PBS for 15-30 minutes until a stable baseline is observed.
- Acquire baseline I-V curves using infrequent DC sweeps (e.g., a single sweep every 2-5 minutes) rather than continuous static or AC measurements. This is crucial for deconvoluting drift from the analytical signal.
- Analyte Introduction and Signal Measurement:
- Dispense the target analyte solution (in 1X PBS) onto the sensor channel.
- Incubate for a defined period (e.g., 10-15 minutes) under no-flow or very low-flow conditions to allow for specific binding.
- Do not take continuous measurements during this incubation. Only perform a DC sweep at the end of the incubation period.
- Control Experiment:
- Run a parallel, identical experiment using a control device on the same chip that lacks the specific capture antibody but is otherwise identical. This controls for any bulk solution effects or pure drift.
- Compare the I-V sweep from the active sensor to that of the control sensor. A significant shift in the active sensor's characteristics (e.g., on-current, threshold voltage) compared to the negligible change in the control confirms specific detection.
- Data Analysis:
- Plot the key parameter (e.g., on-current at a fixed voltage) from each DC sweep against time.
- The signal from the target binding should manifest as a step-change between sweeps, while drift would appear as a continuous, gradual slope. The control device data provides the baseline drift profile.
- Device Preparation and Baseline Acquisition:
Troubleshooting:
- High Drift in Control: Ensure proper device encapsulation and passivation. Verify the stability of the pseudo-reference electrode potential [67].
- No Signal in Active Channel: Confirm the activity and correct immobilization of the capture antibodies within the POEGMA brush layer.
- Signal in Control Channel: Indicates significant NSA or electrical cross-talk; revisit the passivation quality and device layout.
Protocol 3: Surfactant Modification of Molecularly Imprinted Polymers (MIPs)
This protocol describes a post-synthesis modification of MIPs using surfactants to electrostatically mask external functional groups responsible for non-specific binding, thereby enhancing selectivity [70].
Key Reagents & Materials:
- Synthesized MIP and Non-Imprinted Polymer (NIP) particles (e.g., poly(4-vinylpyridine) or polymethacrylic acid)
- Surfactants: Sodium Dodecyl Sulfate (SDS) for positive masking, Cetyltrimethylammonium Bromide (CTAB) for negative masking
- Template molecule (e.g., Sulfamethoxazole, SMX)
- Incubation buffer (e.g., phosphate buffer, pH 7.4)
- Centrifugation filters or equipment
Procedure:
- Surfactant Solution Preparation:
- Prepare a 10 mM solution of the appropriate surfactant (SDS or CTAB) in incubation buffer.
- Polymer Modification:
- Disperse 10 mg of the MIP (or NIP) particles in 1 mL of the surfactant solution.
- Incubate the mixture for 1 hour at room temperature with gentle agitation to allow the surfactant molecules to bind to the external functional groups of the polymer.
- Washing and Storage:
- Centrifuge the mixture and carefully remove the supernatant.
- Wash the modified particles three times with pure incubation buffer to remove any unbound surfactant.
- Re-suspend the modified MIPs in buffer for immediate use or store at 4°C.
- Validation:
- Compare the binding isotherms of the surfactant-modified MIPs and NIPs for the template (SMX) and structural analogs (e.g., sulfadiazine). Successful modification is indicated by a significant reduction in the binding capacity of the NIP, while the MIP retains high specific binding, leading to a high imprinting factor [70].
- Surfactant Solution Preparation:
Troubleshooting:
- Loss of MIP Binding Capacity: The surfactant concentration may be too high, leading to partial blockage of specific cavities. Titrate the surfactant concentration to find an optimum.
- Ineffective NSA Reduction: Ensure the surfactant charge is appropriate for the polymer's external functional groups (e.g., use SDS for pyridine groups in P4VP).
Visual Guide to Strategies and Workflows
Antifouling and Sensing Mechanisms
The following diagram illustrates the core mechanisms of two primary antifouling strategies: the creation of a passive barrier and the active removal of foulants.
Experimental Workflow for BioFET Development
This workflow outlines the key steps in developing a stable and sensitive BioFET for complex media, integrating the protocols described above.
The Scientist's Toolkit: Essential Research Reagents
Table 3: Key Reagents for Mitigating NSA and Interference
| Reagent/Material | Primary Function | Application Notes |
|---|---|---|
| POEGMA | Polymer brush for antifouling and Debye length extension [67] | Critical for BioFETs in physiological buffer; synthesized via ATRP. |
| SDS & CTAB Surfactants | Mask external functional groups on MIPs to reduce NSA [70] | Use SDS for cationic polymers (e.g., P4VP), CTAB for anionic (e.g., PMAA). |
| PEG Derivatives | Forms hydrophilic antifouling monolayers or coatings [67] [69] | Versatile; can be used as a brush or cross-linked layer. |
| BSA | Protein-based blocking agent for passive surface passivation [65] | Inexpensive and widely used; can be unstable over long measurements. |
| Carbon Nanomaterials (Gii) | High-conductivity, innate antifouling transducer material [69] | Reduces need for additional coatings, minimizing signal barrier effects. |
| Pseudo-Reference Electrodes (Pd) | Stable gate potential for portable BioFETs [67] | Enables miniaturization and point-of-care use, replacing bulky Ag/AgCl. |
Optimizing Dynamic Range and Sensitivity for Different Metabolic Contexts
The precise regulation of synthetic metabolic pathways in dynamic cellular environments requires biosensors that are not only specific but also exhibit optimized performance characteristics. Key among these are dynamic range and sensitivity, which determine a biosensor's ability to reliably detect and respond to changes in metabolite concentration [5]. The dynamic range defines the span between the minimal and maximal detectable signals, while sensitivity reflects the biosensor's responsiveness within its operational window [5]. Proper characterization and optimization of these parameters are fundamental to applications in high-throughput screening, dynamic metabolic control, and real-time monitoring in both industrial biomanufacturing and therapeutic contexts [71] [5].
Core Performance Metrics for Biosensor Optimization
The performance of genetically encoded biosensors is quantified by several interlinked metrics. A thorough understanding of these parameters is essential for selecting or engineering the appropriate biosensor for a specific metabolic context.
Table 1: Key Performance Metrics for Biosensor Characterization
| Metric | Definition | Impact on Metabolic Regulation |
|---|---|---|
| Dynamic Range | The ratio between the maximal and minimal output signals in response to a saturating input [5]. | Determines the amplitude of genetic response, influencing the strength of metabolic pathway activation or repression. |
| Operating Range | The concentration window of the target analyte where the biosensor functions optimally [5]. | Defines the metabolite concentration range over which effective regulation occurs, crucial for avoiding saturation or insensitivity. |
| Sensitivity (Response Threshold) | The lowest analyte concentration that produces a statistically significant signal; related to the dose-response curve's slope [5]. | Affects the detection limit for low-abundance metabolites and the precision of feedback control in pathways. |
| Response Time | The speed at which the biosensor reaches its maximum output signal after analyte exposure [5]. | Critical for rapid feedback in dynamic environments; slow responses can lead to oscillations or instability in pathway control. |
| Signal-to-Noise Ratio | The ratio of the specific output signal to the background variability [5]. | High SNR is vital for reliably distinguishing true metabolic fluctuations from stochastic cellular noise during screening. |
Table 2: Biosensor Types and Their Characteristic Properties
| Category | Biosensor Type | Sensing Principle | Typical Response Characteristics | Advantages for Metabolic Engineering |
|---|---|---|---|---|
| Protein-Based | Transcription Factors (TFs) | Ligand binding induces DNA interaction to regulate gene expression [5]. | Moderate sensitivity; direct gene regulation [5]. | Suitable for high-throughput screening; broad analyte range [5]. |
| Protein-Based | Two-Component Systems (TCSs) | Sensor kinase autophosphorylates and transfers signal to a response regulator [5]. | High adaptability; environmental signal detection [5]. | Modular signaling; applicable in varied environments [5]. |
| RNA-Based | Riboswitches | Ligand-induced RNA conformational change affects translation [5]. | Tunable response; reversible [5]. | Compact; integrates well into metabolic regulation [5]. |
| RNA-Based | Toehold Switches | Base-pairing with a trigger RNA activates translation [5]. | High specificity; programmable [5]. | Enables logic-gated pathway control; useful for RNA-level diagnostics and production [5]. |
Figure 1: Workflow for core biosensor performance characterization. This sequence outlines the essential steps for evaluating key metrics that define a biosensor's functionality in metabolic contexts.
Quantitative Data and Characterization Methods
Dose-Response Analysis
The dose-response curve is the foundational characterization for any biosensor, mapping the output signal as a function of analyte concentration [5]. This curve allows for the quantitative determination of the dynamic range, operating range, sensitivity, and response threshold.
Protocol 3.1.1: Generating a Dose-Response Curve
- Culture Preparation: Inoculate a strain harboring the biosensor construct. Grow cultures to mid-exponential phase in a defined medium.
- Analyte Titration: Aliquot cultures into separate vessels. Spike with a known concentration of the target analyte to create a titration series covering several orders of magnitude (e.g., from 0 µM to a saturating concentration). Include a negative control with no analyte.
- Signal Measurement: For fluorescent biosensors, measure fluorescence intensity (e.g., GFP, RFP) using a plate reader or flow cytometer. For colorimetric outputs, measure absorbance. Normalize fluorescence/absorbance by cell density (OD₆₀₀).
- Data Fitting and Analysis: Plot the normalized output signal against the logarithm of the analyte concentration. Fit the data to a sigmoidal function (e.g., Hill equation) using scientific software (e.g., Prism, Python, R). From the fitted curve, extract the EC₅₀ (concentration at half-maximal response), the Hill coefficient (cooperativity), the minimum signal (basal level), and the maximum signal (saturated level). The dynamic range is calculated as the ratio of the maximum to the minimum signal.
Dynamic Performance Assessment
For applications requiring real-time control, dynamic performance metrics like response time and signal-to-noise ratio are as critical as steady-state parameters [5].
Protocol 3.2.1: Measuring Response Time and Signal-to-Noise Ratio
- Setup: Grow the biosensor strain in a controlled bioreactor or microfluidic device to maintain constant environmental conditions. Use a high-frequency data acquisition system.
- Stimulus Application: Rapidly introduce a pulse of analyte to achieve a final concentration at or above the EC₅₀.
- Kinetic Monitoring: Continuously measure the output signal (e.g., fluorescence) with high temporal resolution (e.g., every 30-60 seconds) until a new steady state is reached.
- Calculation of Response Time: The response time is typically defined as the time taken for the signal to shift from its initial baseline to 90% of its final, new steady-state value after stimulus application.
- Calculation of Signal-to-Noise Ratio (SNR):
- Measure the mean output signal (S) from replicates under a constant analyte concentration.
- Measure the standard deviation (σ) of the output signal from the same replicates under the same conditions.
- Calculate SNR as: SNR = S / σ. A higher SNR indicates a more reliable and detectable output.
Table 3: Target Performance Metrics for Different Metabolic Applications
| Metabolic Context | Recommended Dynamic Range (Min) | Desired Response Time | Critical Performance Factor |
|---|---|---|---|
| High-Throughput Library Screening | >10-fold [5] | < Cell doubling time | High Signal-to-Noise Ratio [5] |
| Dynamic Pathway Regulation | >5-fold [5] | Fast (minutes) [5] | Linear Operating Range |
| Metabolite Monitoring in Bioprocessing | >20-fold | Medium (hours) | Stability & Robustness [5] |
| Therapeutic Drug Delivery | Application-dependent | Application-dependent | Specificity & Orthogonality |
Engineering Strategies for Optimization
Optimization strategies focus on tuning the genetic components of the biosensor to achieve the desired performance profile for a specific application.
Figure 2: Engineering strategies for biosensor optimization. This diagram outlines multiple molecular biology approaches to improve biosensor performance, from promoter tuning to directed evolution.
Protocol 4.1: Tuning Dynamic Range and Sensitivity via Promoter and RBS Engineering
- Promoter Library Construction: Generate a library of variants for the promoter controlling the expression of the biosensor's sensing element (e.g., transcription factor). This can be achieved by using degenerate primers or a curated set of synthetic promoters with varying strengths.
- RBS Library Construction: Similarly, create a library of Ribosome Binding Site (RBS) sequences with calculated varying translation initiation rates for the sensing element.
- Library Transformation: Co-transform the promoter and RBS libraries along with the rest of the biosensor construct into the host microbial chassis.
- Screening & Selection: Screen the resulting library by measuring the biosensor's dynamic range and sensitivity (EC₅₀) using the methods in Protocol 3.1.1. This can be done via fluorescence-activated cell sorting (FACS) or in a microtiter plate format.
- Validation: Isolate clones with desired characteristics (e.g., high dynamic range, shifted EC₅₀) and validate their performance in biological replicates.
Protocol 4.2: Directed Evolution for Enhanced Biosensor Performance
- Diversity Generation: Introduce random mutations into the gene encoding the key sensing component (e.g., transcription factor ligand-binding domain, riboswitch aptamer) using error-prone PCR or DNA shuffling.
- Selection Pressure: Design a selection strategy that links the desired biosensor output to cell survival or antibiotic resistance. For example, couple biosensor activation to the expression of an essential gene or an antibiotic resistance marker in the presence of the target metabolite.
- Iterative Rounds: Grow the mutant library under the selection pressure. Isolve the surviving clones and subject them to further rounds of mutagenesis and selection to accumulate beneficial mutations.
- High-Throughput Screening: Use FACS to screen for clones exhibiting an improved signal-to-noise ratio or a broader dynamic range, as described in Protocol 3.2.1.
The Scientist's Toolkit: Research Reagent Solutions
Table 4: Essential Reagents and Materials for Biosensor Development
| Reagent / Material | Function / Application | Example Notes |
|---|---|---|
| Plasmid Vectors with Modular Cloning Sites | Scaffold for assembling biosensor components (promoter, sensor, output). | Essential for Golden Gate, MoClo, or Gibson assembly for rapid prototyping. |
| Promoter & RBS Libraries | Tuning the expression level of biosensor components to optimize performance. | Commercial libraries or custom-designed variant sets are available. |
| Fluorescent Protein Reporters (e.g., GFP, RFP) | Providing a quantifiable optical output for the biosensor activity. | Different spectral properties allow for multiplexing. |
| Chemical Inducers / Analogue Molecules | Used for characterizing dose-response in the absence of the native metabolite. | Helpful for initial testing and tuning. |
| Flow Cytometer / Fluorescence-Activated Cell Sorter (FACS) | High-throughput, single-cell analysis and sorting of biosensor libraries. | Critical for screening large mutant libraries and assessing population heterogeneity. |
| Microplate Reader | Measuring fluorescence/absorbance of biosensor cultures in a high-throughput format. | Allows for kinetic and endpoint assays in 96- or 384-well plates. |
| Controlled Bioreactors / Microfluidic Devices | Maintaining constant growth conditions and applying precise analyte pulses for dynamic studies. | Enables accurate measurement of response times. |
Application Notes for Metabolic Contexts
High-Throughput Screening for Strain Development
For screening mutant libraries, prioritize biosensors with a high dynamic range (>10-fold) and an excellent signal-to-noise ratio to clearly distinguish high-performing clones [5]. The operating range should align with the expected metabolite concentrations in your library. TF-based biosensors are often suitable for this context due to their direct gene regulation and broad analyte range [5].
Dynamic Regulation for Pathway Balancing
In dynamic regulation, the response time is paramount. A slow biosensor cannot effectively manage rapid metabolic fluctuations, potentially leading to instability [5]. Consider faster-acting systems like riboswitches or hybrid designs that combine stable TFs with fast RNA components [5]. The biosensor should have a linear operating range over the relevant metabolite concentrations to enable proportional control.
Challenges and Future Outlook
Current challenges include the limited availability of orthogonal biosensors, context-dependent performance, and difficulties in tuning parameters independently (e.g., a trade-off often exists between dynamic range and threshold) [5]. Future advancements will leverage machine learning and computer-in-the-loop approaches to guide the design and experimental evolution of biosensors, paving the way for more robust and predictable dynamic regulation of metabolism [5].
Analytical Frameworks and Performance Assessment Methodologies
Comparative Pathway Analysis for Identifying Unique Metabolic Capabilities
Within metabolic engineering and synthetic biology, the ability to dynamically regulate pathway flux is paramount for optimizing the production of target compounds and maintaining cellular fitness. A critical first step in implementing such sophisticated control is the thorough identification and comparison of an organism's metabolic capabilities. Comparative pathway analysis provides a powerful suite of computational and experimental methods to uncover these unique capabilities, directly informing the rational design of genetic circuits for dynamic regulation [13]. This application note details integrated protocols for performing these analyses, with a specific focus on generating quantitative insights that can guide subsequent biosensor design for robust pathway engineering in industrial and therapeutic applications.
Computational Analysis Using Elementary Modes
Elementary Mode Analysis (EMA) is a cornerstone constraint-based method for structurally analyzing metabolic networks. Each Elementary Mode (EM) represents a minimal, steady-state functional unit of the network, and the complete set of EMs defines the network's entire metabolic potential [72].
Protocol: Calculating and Comparing Elementary Modes
Objective: To identify all stoichiometrically feasible pathways in a metabolic network and quantify their utilization under different conditions.
Materials & Software:
- Metabolic Network Reconstruction: A stoichiometric model of the target organism (e.g., in SBML format).
- Software Tools: COBRA Toolbox for MATLAB, CellNetAnalyzer, or the
cobrapypackage for Python. - Computing Environment: A standard desktop computer is sufficient for small-to-medium networks; high-performance computing may be required for genome-scale models.
Procedure:
- Network Compilation: Define the system boundary by specifying external metabolites (inputs/outputs). Ensure all reactions are elementally and charge-balanced.
- Algorithm Execution: Use the
calculateElementaryModesfunction in CellNetAnalyzer or an equivalent function in your chosen software to compute the full set of EMs. - Pathway Categorization: Manually inspect and group EMs based on their metabolic functions (e.g., ATP production, biomass synthesis, target compound secretion).
- Quantitative Flux Decomposition: For a given experimental flux distribution (e.g., from
13C-flux analysis), decompose the fluxes onto the set of EMs using a method that minimizes the length of the weight vector, which assigns a unique flux value to each EM [72]. This identifies the dominant metabolic routes actually used by the cell.
Workflow and Output
The computational workflow from network reconstruction to the identification of dominant pathways is summarized below.
Table 1: Example Output from EMA of a Glycolytic Network. This table summarizes the results of a quantitative flux decomposition for a yeast glycolysis model, highlighting dominant and minor pathways [72].
| Elementary Mode ID | Pathway Description | Flux Value (mmol·min⁻¹·L⁻¹) | Functional Category |
|---|---|---|---|
| EM8 | Glucose → Ethanol | 55.5 | Standard Glycolysis |
| EM7 | Glucose → Ethanol + Glycerol | 18.2 | Redox Balancing |
| EM5 | Glucose → Glycogen | 2.1 | Carbon Storage |
| Other EMs | Various routes to Succinate, Trehalose | < 1.0 | Secondary Metabolism |
Experimental Validation with Biosensors
Computational predictions require experimental validation. Transcription factor (TF)-based biosensors are ideal tools for this, as they convert intracellular metabolite concentrations into a quantifiable output, providing a real-time readout of pathway activity [13] [6].
Protocol: Profiling Metabolites with Engineered Biosensors
Objective: To experimentally measure the dynamics of key pathway metabolites using specific and extended TF-based biosensors.
Materials:
- Strains: Engineered microbial host (e.g., E. coli) harboring either a specific TF-based biosensor plasmid or an extended biosensor circuit.
- Inducers/Chemicals: Target metabolite (e.g., pyruvate, naringenin) for sensor characterization.
- Equipment: Microplate reader for luminescence/fluorescence, bioreactor for controlled culturing.
Procedure:
- Biosensor Calibration: Grow the biosensor strain in a minimal medium and expose it to a concentration gradient of the pure target metabolite. Measure the output signal (e.g., luminescence) and fit the dose-response curve to determine the dynamic range and sensitivity [6].
- Extended Biosensor Application: For targets without a natural TF, employ an extended biosensor design. This involves introducing a bio-conversion pathway that transforms the target metabolite into an effector molecule detectable by an available TF [13].
- Dynamic Pathway Monitoring: Cultivate production strains (e.g., naringenin-producing E. coli) and sample at regular intervals. Measure the biosensor output to infer the temporal dynamics of the pathway intermediate or product.
- Data Interpretation: Normalize the biosensor signal to cell density (e.g., OD₆₀₀). Convert the normalized output to relative metabolite concentrations using the calibration curve from Step 1.
Biosensor Application Workflow
The process of applying a biosensor to monitor metabolic activity in a production strain is illustrated below.
Table 2: Research Reagent Solutions for Biosensor-Based Pathway Analysis.
| Item | Function in Protocol | Example(s) |
|---|---|---|
| Pyruvate Biosensor (PdhR-based) | Dynamic monitoring of central carbon metabolism flux, a key node connecting glycolysis and TCA [6]. | Engineered E. coli PdhR-pydhR-lux system with improved sensitivity [6]. |
| Extended Biosensor Circuit | Enables sensing of non-native metabolites by linking them to a downstream TF effector via a metabolic converter module [13]. | Circuit for flavonoid naringenin sensing [13]. |
| Constitutive Biosensor (rrnB P1-lux) | Serves as a non-specific control to assess overall cellular metabolic activity and stress [73]. | E. coli rrnB P1-luxCDABE for monitoring metabolic activity shifts [73]. |
| Antithetic Integral Feedback Controller | A synthetic genetic circuit used in closed-loop regulation to maintain pathway output at a desired set-point, ensuring robustness [13]. | Combined with extended biosensors for regulated flavonoid production [13]. |
Integrated Data Analysis and Interpretation
The final stage involves correlating computational predictions with experimental data to draw robust conclusions about an organism's unique metabolic capabilities.
Protocol: Correlating EMA and Biosensor Data
Objective: To validate computational models and identify constraints that shape metabolic phenotypes.
Procedure:
- Data Alignment: Overlay the experimentally derived metabolite dynamics from Section 3.1 onto the corresponding reactions in the elementary mode structure from Section 2.1.
- Constraint Identification: If high flux is predicted through an EM but the corresponding biosensor shows low metabolite accumulation, this may indicate post-transcriptional regulation or enzyme kinetics as a limiting factor. Conversely, metabolite accumulation can point to imbalanced flux, suggesting a prime target for dynamic regulation.
- Identification of Unique Capabilities: A unique metabolic capability is confirmed when:
- EMA identifies an EM that is specific to one organism or condition.
- Biosensor data validates the activity of this EM in vivo.
- The EM provides a functional advantage, such as the ability to utilize a unique carbon source or generate a valuable cofactor more efficiently.
Integrated Analysis Logic
The logic for integrating computational and experimental data to identify unique, validated metabolic capabilities is shown in the following decision flow.
Biosensor-Enabled High-Throughput Screening for Strain Development
Biosensor-enabled high-throughput screening (HTS) represents a transformative approach in metabolic engineering and synthetic biology, accelerating the development of robust microbial strains for industrial bioproduction. These biological tools detect specific intracellular metabolites or environmental conditions and convert this information into a measurable signal, typically fluorescence [74] [9]. This capability allows researchers to rapidly screen vast libraries of microbial variants to identify individuals with superior traits, such as enhanced product yield, improved substrate utilization, or greater stress tolerance. The integration of biosensors into HTS platforms has become particularly valuable for optimizing complex metabolic pathways, overcoming traditional bottlenecks associated with low-throughput analytical methods [75] [76]. This application note details the principles, protocols, and practical implementation of biosensor-enabled HTS, providing a framework for its application in dynamic metabolic pathway regulation research.
Key Biosensor Classes and Their Applications in HTS
Biosensors for HTS are categorized based on their core sensing mechanism, each with distinct advantages for specific applications in strain development. The table below summarizes the primary biosensor classes used in metabolic engineering.
Table 1: Key Biosensor Classes for High-Throughput Screening
| Biosensor Class | Sensing Mechanism | Measurable Output | Key Applications in Strain Development | Examples |
|---|---|---|---|---|
| Transcription Factor (TF)-Based | TF binds metabolite, triggering transcriptional activation/repression of a reporter gene [9] | Fluorescence (e.g., GFP), Luminescence | Detection of specific metabolites (e.g., sugars, organic acids), pathway intermediates [75] | CaiF for l-carnitine [77]; CarR for p-coumaric acid [75] |
| FRET-Based | Conformational change upon analyte binding alters energy transfer between two fluorophores [74] [78] | Fluorescence Emission Ratio | Real-time monitoring of small molecules (e.g., hormones, ATP, ABA) with ratiometric quantification [74] [78] | ATeams for ATP [78]; ABACUS for Abscisic Acid [74] |
| Intrinsic FP-Based | Analyte directly alters the fluorescent protein's chromophore environment [74] | Fluorescence Intensity or Excitation Ratio | Sensing redox potential, ion concentration, and pH at subcellular resolution [74] | roGFP for glutathione redox potential [74] |
| Whole-Cell | Integrated sensing, regulatory circuit, and reporter within a living cell [9] | Fluorescence, Colorimetry | Environmental monitoring, detection of pathogen/toxin presence [9] | N/A |
Case Study: HTS for High-Yield Caffeic Acid Production
A recent study demonstrates the powerful synergy between biosensors and FACS for strain development. The goal was to enhance microbial production of caffeic acid (CA), a valuable phenolic compound [75].
Quantitative Outcomes of the Screening Campaign
The biosensor-driven HTS platform yielded significant improvements in both enzyme activity and final product titer, as summarized below.
Table 2: Quantitative Outcomes of the Caffeic Acid HTS Platform [75]
| Parameter | Baseline/Control | Post-HTS Result | Improvement Factor |
|---|---|---|---|
| FjTAL Mutant Catalytic Activity | Baseline | - | 6.85-fold |
| Caffeic Acid Titer in Bioreactor | - | 9.61 g L⁻¹ | Highest reported titer to date |
| Biosensor Dynamic Range | Control biosensor | 10⁻⁴ mM – 10 mM | 1000-fold wider |
| Biosensor Output Signal | Control biosensor | - | 3.3-fold higher |
Experimental Protocol: Biosensor Engineering and HTS
Objective: To rapidly isolate E. coli variants with improved p-coumaric acid (p-CA) production and enhanced tolerance to phenolic acid cytotoxicity.
Materials:
- Strain: E. coli host cell.
- Biosensor Plasmid: CarR transcription factor from Acetobacterium woodii configured to drive a fluorescent reporter (e.g., GFP) in response to p-CA [75].
- Library: Diversity library of enzyme mutants (e.g., tyrosine ammonia-lyase) or genomic variants.
- Equipment: Fluorescence-Activated Cell Sorter (FACS), microplate reader, bioreactor.
- Media: Lysogeny Broth (LB) or defined minimal media supplemented with appropriate carbon sources and selection antibiotics.
Procedure:
Biosensor Optimization:
- Systematically engineer the biosensor to minimize background signal and maximize the dynamic range. This involves optimizing promoter strength, ribosome binding sites (RBS), and linker sequences [9] [75].
- Validate the optimized biosensor by measuring the fluorescence output across a gradient of p-CA concentrations. Confirm specificity and a dose-responsive signal output.
Library Transformation and Cultivation:
- Co-transform the engineered biosensor plasmid and the diversity library (e.g., mutant TAL genes) into the E. coli host strain.
- Plate transformed cells on solid selective media and incubate to form colonies. Alternatively, for larger libraries, inoculate directly into liquid selective media and grow to mid-log phase.
High-Throughput Screening via FACS:
- For liquid cultures, dilute cells to an optimal density for sorting (e.g., ~1-10 million cells mL⁻¹).
- Use FACS to analyze and sort the population based on biosensor fluorescence. Gate the population to isolate the top 0.1-1% of cells exhibiting the highest fluorescence intensity, indicating high intracellular p-CA concentration [75].
- Collect the sorted high-performing cells into a recovery medium.
Validation and Strain Characterization:
- Plate the sorted cells to obtain single colonies.
- Inoculate individual clones into deep-well plates for small-scale production. Quantify p-CA and CA titers using standard analytical methods (e.g., HPLC) to validate the FACS results.
- Scale-up fermentation of the best-performing validated strains in bioreactors to assess performance under controlled conditions.
Diagram 1: HTS Workflow for Strain Development.
The Scientist's Toolkit: Essential Research Reagents
Successful implementation of a biosensor-enabled HTS platform requires a suite of key reagents and tools, as detailed below.
Table 3: Essential Reagents for Biosensor-Based HTS
| Reagent/Material | Function/Description | Application Example |
|---|---|---|
| Transcription Factor (e.g., CarR) | Core sensing element; binds a specific metabolite to activate reporter gene expression [75]. | Sensing phenolic acids like p-coumaric acid for caffeic acid production [75]. |
| Reporter Protein (e.g., GFP) | Generates a quantifiable signal (fluorescence) in response to biosensor activation. | Fluorescence readout for FACS or microplate reader detection [9] [75]. |
| Error-Prone PCR Kits | Generates random mutagenesis libraries for enzyme or pathway engineering [76]. | Creating diversity in enzyme libraries (e.g., tyrosine ammonia-lyase) to improve catalytic activity [75] [76]. |
| Fluorescence-Activated Cell Sorter (FACS) | Instrument for ultra-high-speed analysis and sorting of single cells based on fluorescence [75]. | Isolating rare high-producing cells from a library of millions of variants. |
| Specialized Growth Media | Media formulated with selective antibiotics and defined carbon sources to maintain plasmid pressure and support target pathway. | Cultivating engineered strains during library screening and validation. |
Pathway Logic and Dynamic Regulation
Beyond screening, biosensors can be integrated into dynamic metabolic control circuits. In such systems, the biosensor directly regulates the expression of critical pathway genes in response to metabolite levels, creating a feedback loop that automatically balances metabolism and minimizes intermediate accumulation [9].
Diagram 2: Biosensor Feedback for Dynamic Control.
The future of biosensor-enabled HTS lies in its convergence with systems biology and machine learning (ML). The large, high-quality datasets generated by HTS are ideal for training ML models, which can, in turn, predict more effective biosensor designs or optimal metabolic engineering strategies, creating a powerful virtuous cycle for strain development [9] [76].
Application Notes
Product titer quantification is a cornerstone of biomanufacturing and metabolic engineering, providing an essential, quantitative measure of pathway efficiency and cellular factory performance. This quantitative assessment is crucial for optimizing the production of a wide range of biological products, from viral vectors for gene therapy to valuable small molecules. The integration of advanced analytical techniques and computational modeling has significantly enhanced our ability to accurately measure and interpret titer data, enabling more precise dynamic regulation of metabolic pathways.
For gene therapy applications, the accurate quantification of viral vector titers, such as recombinant adeno-associated virus (rAAV) capsids, is critical for process development and quality control. Recent advances in analytical methods like biolayer interferometry (BLI) with AAVX biosensors (AAVX-BLI) allow for high-throughput capsid titer measurement across multiple serotypes (rAAV2, -5, -8, -9) with reduced measurement variance and error compared to traditional ELISA methods [79]. This technique demonstrates a wide dynamic range (1 × 10¹⁰ – 1 × 10¹² capsids/mL) and can be applied in both upstream and downstream processing contexts, including transfection optimization studies and dynamic binding capacity measurements for purification processes [79].
In metabolic engineering, product titer validation enables the implementation of dynamic regulation strategies through transcription factor-based biosensors. These biosensors detect intracellular metabolite levels and elicit regulatory responses to maintain pathway balance under industrial biomanufacturing conditions [13]. For instance, in the flavonoid naringenin pathway, extended metabolic biosensors can be cascaded with bio-conversion pathways to create context-aware synthetic genetic circuits that respond to environmental fluctuations [13]. This approach addresses the robustness pitfalls of static control by applying feedback regulation, potentially leading to higher titers than achievable with static regulation alone.
The quantitative analysis of titration data must account for methodological artifacts that can compromise accuracy. The "hook effect" observed in biosensor performance—parabolic or flat response curves at extreme analyte concentrations—can lead to significant measurement errors if not properly characterized and modeled [80]. Computational models that simulate biosensor operation and account for factors such as immobilised antibody binding site density and competitive binding kinetics are essential for optimizing design parameters and ensuring accurate quantification across the entire concentration range [80].
Table 1: Comparison of Quantitative Titer Measurement Platforms
| Platform/Method | Dynamic Range | Measurement Variance | Sample Throughput | Key Applications |
|---|---|---|---|---|
| AAVX-BLI [79] | 1 × 10¹⁰ – 1 × 10¹² capsids/mL | Reduced vs. ELISA | High | rAAV serotype quantification, process development |
| ELISA [79] | Serotype-dependent | 10-20% | Medium | Traditional capsid titer measurement |
| Electrochemical Biosensor [80] | pM to mM range | Concentration-dependent | Medium | Small molecule detection in complex media |
| Transcription Factor-Based Biosensors [13] | Tunable dynamic range | Context-dependent | High | Dynamic pathway regulation, screening |
Mathematical modeling provides a powerful framework for interpreting titer data and predicting system behavior. The application of ordinary differential equations (ODEs) and the Hill equation enables quantitative analysis of cooperative binding in signaling pathways, facilitating better hypothesis development regarding pathway efficiency and regulation [81]. For plant hormone signaling pathways such as abscisic acid (ABA)-mediated responses, these models can simulate the relationship between hormone concentrations and biosensor output, validating experimental results in a cost-effective manner [81].
The emerging approach of context-aware biosensor design through biology-guided machine learning represents a significant advancement in titer validation methodologies. By characterizing biosensor performance under varied genetic and environmental contexts (promoters, RBSs, media, supplements), researchers can develop predictive models that account for context-dependent dynamic parameters, enabling optimal condition selection for desired biosensor specifications [59]. This integrated approach is particularly valuable for precision fermentation applications where maintaining production efficiency at industrial scale requires robust performance under variable conditions.
Experimental Protocols
Protocol 1: AAV Capsid Titer Quantification Using AAVX-BLI
Principle
This method utilizes biolayer interferometry (BLI) with AAVX-functionalized biosensors to directly quantify adeno-associated virus (AAV) capsid titers across multiple serotypes. The technique measures changes in interference patterns resulting from binding events at the biosensor surface, enabling label-free concentration measurement [79].
Materials
- Octet AAVX biosensors
- AAVX-BLI buffer solutions
- Serotype-specific AAV reference standards
- 96-well microplate (black)
- BLI instrument (Octet system)
- Regeneration buffer (low-pH)
Procedure
- Biosensor Hydration: Hydrate AAVX biosensors in appropriate buffer for 10 minutes prior to use.
- Instrument Calibration: Calibrate BLI instrument according to manufacturer specifications.
- Sample Preparation: Dilute AAV samples in Octet Sample Diluent to fall within the dynamic range (1 × 10¹⁰ – 1 × 10¹² capsids/mL).
- Baseline Measurement: Immerse biosensors in reference buffer for 60 seconds to establish baseline.
- Sample Loading: Transfer biosensors to sample wells for 300 seconds to monitor association phase.
- Dissociation Phase: Transfer biosensors to reference buffer for 300 seconds to monitor dissociation.
- Data Analysis: Calculate capsid titer from binding kinetics using reference standard curve.
- Biosensor Regeneration: Regenerate biosensors using low-pH regeneration buffer between measurements for reuse [79].
Notes
- Biosensor regeneration capacity varies by sample matrix, with lysate samples showing reduced regeneration compared to purified samples.
- For complex matrices (e.g., cell lysate), consider extended regeneration protocols with increased cycle number and contact time with regeneration buffer.
- The method shows reduced variance and error compared to ELISA, with applicability across rAAV2, -5, -8, and -9 serotypes.
Protocol 2: Quantitative Antibody Titer Calibration Using Reference Standards
Principle
This protocol describes the calibration of quantitative antibody titer measurements using international standards to establish traceable quantification, with application to seroepidemiological studies and immunity assessment [82].
Materials
- WHO international standard (e.g., 3rd anti-measles WHO standard)
- BioPlex 2200 MMRV IgG assay system
- Reference method materials (e.g., plaque reduction neutralization test)
- Serial dilution buffers
- Quality control samples
Procedure
- Standard Preparation: Prepare 2-fold serial dilutions of WHO international standard.
- Calibration Curve Generation: Measure dilutions on analytical platform (e.g., BioPlex 2200) to generate calibration curve.
- Quality Control: Include quality control samples with known concentrations to validate curve.
- Sample Analysis: Measure unknown samples following established protocol.
- Data Transformation: Convert instrument signal (e.g., relative fluorescence intensity) to quantitative titer using calibration curve.
- Method Comparison: Compare results with reference method (e.g., PRNT) to establish correlation.
- Threshold Determination: Use receiver operating characteristic (ROC) analysis to define equivocal zones and optimal cutoffs [82].
Notes
- Correlation between different methods (e.g., EIA and PRNT) may be poor in low-titer samples due to differences in what is measured (total IgG vs. neutralizing antibodies).
- Establishing equivocal zones requiring confirmation by reference methods prevents underestimation of immunity through false-negative results.
- The quantitative values can be used for seroepidemiological studies to assess population immunity levels.
Protocol 3: Dynamic Pathway Regulation Using Extended Metabolic Biosensors
Principle
This protocol utilizes transcription factor-based biosensors in combination with antithetic integral feedback control to dynamically regulate metabolic pathways, enabling robust production under industrial biomanufacturing conditions [13].
Materials
- Engineered production strain (e.g., E. coli with naringenin pathway)
- FdeR-based naringenin biosensor constructs
- Fluorescence reporter (e.g., GFP)
- Inducer compounds
- Bioreactor or microfermentation system
- Analytical equipment (HPLC, plate reader)
Procedure
- Strain Preparation: Transform production host with biosensor circuit and production pathway.
- Culture Conditions: Grow engineered strains under appropriate media and conditions (e.g., M9 with 0.4% glucose).
- Biosensor Characterization: Expose biosensor strains to target compound concentration range (e.g., 400 μM naringenin) to establish dose-response.
- Dynamic Monitoring: Measure fluorescence output over time (e.g., 7 hours) to characterize biosensor dynamics.
- Pathway Operation: Cultivate strains under production conditions while monitoring biosensor response and product titer.
- Feedback Implementation: Utilize biosensor output to dynamically regulate pathway gene expression.
- Validation: Correlate biosensor response with product titer using analytical methods (e.g., HPLC) [13] [59].
Notes
- Biosensor performance is highly context-dependent, varying with promoter strength, RBS selection, media composition, and growth phase.
- Optimal biosensor dynamic range should match expected intracellular metabolite concentrations.
- Machine learning approaches can predict biosensor performance across different genetic and environmental contexts.
Table 2: Key Parameters for Biosensor-Enabled Pathway Optimization
| Parameter | Impact on Titer Validation | Optimization Strategy |
|---|---|---|
| Sample Matrix [79] | Affects measurement accuracy and biosensor regeneration | Use matrix-matched standards; implement extended regeneration for complex matrices |
| Dynamic Range [79] [80] | Determines applicable concentration range | Select method with appropriate range; watch for hook effects at extremes |
| Context Dependence [59] | Affects biosensor response in different conditions | Characterize under relevant conditions; use predictive modeling |
| Correlation with Reference Methods [82] | Determines clinical/regulatory utility | Establish equivocal zones; use ROC analysis for cutoff determination |
| Temporal Resolution [13] | Enables dynamic regulation | Implement real-time monitoring; optimize measurement frequency |
Pathway Visualizations
Dynamic Regulation of Metabolic Pathways for Enhanced Product Titer
AAV Capsid Titer Quantification Workflow Using AAVX-BLI
The Scientist's Toolkit: Research Reagent Solutions
Table 3: Essential Research Reagents for Product Titer Validation
| Reagent/Platform | Function | Application Context |
|---|---|---|
| Octet AAVX Biosensors [79] | AAV capsid capture and quantification | High-throughput rAAV titer measurement across serotypes |
| POROS CaptureSelect AAVX Affinity Resin [79] | AAV purification with serotype flexibility | Downstream processing and dynamic binding capacity studies |
| FdeR Transcription Factor [13] [59] | Naringenin biosensing | Dynamic regulation of flavonoid pathways in E. coli |
| WHO International Standards [82] | Antibody titer calibration | Traceable quantification for seroepidemiological studies |
| Abscisic Acid (ABA) Biosensors [81] | Plant hormone signaling studies | Quantification of ABA-mediated stress responses |
| Hill Equation Parameters [81] | Modeling cooperative binding | Simulation of ligand-receptor interactions in signaling |
| Antithetic Integral Feedback Circuits [13] | Robust pathway control | Maintaining production stability despite fluctuations |
Growth-Coupled Selection Systems Linking Productivity to Cellular Fitness
Growth-coupled selection represents a paradigm-shifting approach in metabolic engineering that directly links the production of target compounds to microbial growth and survival. This strategy strategically rewires cellular metabolism so that product synthesis becomes essential for biomass formation, harnessing the power of natural selection to drive strain optimization [83]. By creating synthetic auxotrophs that depend on target pathway flux for growth, researchers can bypass traditional screening bottlenecks and leverage adaptive laboratory evolution (ALE) to rapidly enhance production strains [84]. The fundamental principle involves designing metabolic networks where product formation becomes obligatory for cellular fitness, creating a direct evolutionary pressure to optimize the linked biosynthetic pathways [85].
This approach has demonstrated remarkable success across various applications, from optimizing central metabolism to implementing entirely non-native pathways in microbial hosts. The methodology has evolved from initial conceptual frameworks to sophisticated computational design tools that can predict optimal genetic interventions for coupling specific products to growth [86]. Within the context of biosensor design for dynamic metabolic pathway regulation, growth-coupling provides a powerful selection mechanism that can complement or replace external biosensor systems by making the cell's own fitness contingent upon pathway performance.
Theoretical Foundations and Classification
Categories of Growth-Coupling Strength
The strength of growth-coupling can be systematically classified based on the relationship between target metabolite production and growth rate across all possible metabolic states [86]. This classification is quantitatively represented through metabolic production envelopes, which plot the accessible flux space between growth rate and production rate.
Table 1: Classification of Growth-Coupling Strengths
| Coupling Type | Mathematical Definition | Physiological Characteristic | Production Envelope Feature |
|---|---|---|---|
| Weak GC (wGC) | Production > 0 only at elevated growth rates | Production as overflow metabolism | Zero production at low growth rates, increasing with growth |
| Holistic GC (hGC) | Lower production bound > 0 for all growth rates > 0 | Production mandatory for any growth | Positive minimum production at all growth rates > 0 |
| Strong GC (sGC) | Production > 0 for all metabolic states including zero growth | Production as mandatory byproduct | Positive production even without growth |
The production envelope boundaries follow convex properties due to the linear constraints defining the metabolic flux space [86]. This mathematical characteristic enables computational identification of intervention strategies that raise the lower production boundary across all growth rates, thereby increasing the overall coupling strength.
Fundamental Coupling Principles
Two primary metabolic principles enable growth-coupled production:
Essential Carbon Drain Principle: The metabolism is curtailed through strategic gene deletions so that product formation becomes an essential carbon drain that cannot be bypassed. This creates a scenario where carbon flux must be diverted through the target product to enable biomass formation [86].
Cofactor/Redox Balancing Principle: Metabolic networks are engineered so that cofactors (NAD(P)H, ATP) or redox balancing can only be achieved through target product synthesis. This is particularly effective under anaerobic conditions where electron acceptor options are limited [86].
These principles often work synergistically, with the most effective strategies combining both approaches to create multiple layers of dependency between growth and production [86].
Computational Design Framework
Algorithmic Approaches and Tools
Table 2: Computational Frameworks for Growth-Coupled Strain Design
| Algorithm | Core Methodology | Primary Objective | Key Features | Applications |
|---|---|---|---|---|
| OptKnock | Bilevel optimization | Maximize production at maximal growth | Identifies reaction knockouts | Native metabolite production [85] |
| OptGene | Genetic algorithm | Optimize nonlinear objectives | Handles large knockout numbers | Complex pathway optimization [85] |
| gcOpt | MILP with fixed growth rate | Maximize minimal production at medium growth | Prioritizes GC strength | Ethanol, amino acid production [86] |
| MCSEnumerator | Elementary mode analysis | Find minimal cut sets | Guaranteed functionality removal | Core metabolism engineering [86] |
gcOpt Implementation Protocol
The gcOpt algorithm represents an advanced approach specifically designed to identify strain designs with elevated growth-coupling strength:
gcOpt Workflow
The mathematical formulation for gcOpt involves a bi-level optimization structure:
Where K represents the set of reaction knockouts, kmax is the maximum number of knockouts allowed, μfix is the fixed growth rate, and v_product is the production flux of the target metabolite [86].
Computational Implementation Protocol
Materials and Software Requirements:
- COBRA Toolbox for MATLAB
- TOMLAB optimization package
- Genome-scale metabolic model (e.g., iAF1260 for E. coli)
- Defined substrate conditions and constraints
Step-by-Step Procedure:
Model Preparation
- Load appropriate genome-scale metabolic model
- Set substrate uptake constraints (e.g., glucose: 20 mmol/gDW/h)
- Define oxygen conditions (aerobic: 20 mmol/gDW/h, anaerobic: 0)
- Set ATP maintenance requirement (ATPM > 0 for sGC designs)
Parameter Configuration
- Define target metabolite and exchange reaction
- Set fixed growth rate (μ_fix = 0.1 h⁻¹ recommended)
- Specify maximum number of knockouts (typically 3-10)
- Define optimization objective (minimal guaranteed production)
Algorithm Execution
- Implement gcOpt using mixed-integer linear programming
- Iterate through possible knockout combinations
- Screen for solutions with highest minimal production rates
- Validate feasibility of identified knockout sets
Solution Validation
- Compute production envelopes for top designs
- Verify growth-coupling strength classification
- Check for non-unique phenotype issues
- Apply objective function tilting if necessary [85]
Experimental Implementation: Creatine Production Case Study
Strain Design and Engineering
A recent groundbreaking application of growth-coupled selection demonstrated microbial production of creatine, an important energy storage molecule previously produced exclusively in vertebrates [87]. The implementation followed a comprehensive model-driven approach:
Pathway Engineering:
- Heterologous expression of glycine amidinotransferase
- Implementation of complete creatine biosynthetic pathway
- Optimization of precursor supply (glycine and arginine)
Growth-Coupling Strategy:
- Model-driven identification of essential knockouts
- Coupling of ATP regeneration to creatine synthesis
- Strategic interruption of competing nitrogen metabolism
The designed strain allowed selection of superior creatine producers through growth-coupled design, where improved creatine flux directly correlated with enhanced fitness [87] [88].
Adaptive Laboratory Evolution Protocol
Materials and Reagents:
Table 3: Essential Research Reagents for Growth-Coupled Selection
| Reagent Category | Specific Examples | Function in Experimental Protocol |
|---|---|---|
| Selection Strains | Synthetic auxotrophs with pathway deletions | Platform for coupling growth to production |
| Evolution Media | Minimal media with limiting substrate | Selective pressure for pathway optimization |
| Molecular Biology Tools | CRISPR-Cas, MAGE, Error-prone PCR | Library generation and pathway optimization |
| Analytical Standards | Creatine, glycine, arginine references | Quantification of production metrics |
| -Omics Tools | Genome sequencing, transcriptomics | Identification of adaptive mutations |
Step-by-Step Evolution Protocol:
Strain Construction
- Start with base production strain expressing heterologous creatine pathway
- Implement computational predicted knockouts using CRISPR-Cas9
- Verify genotype through sequencing and phenotypic characterization
Adaptive Evolution
- Inoculate knockout strain in minimal media with growth-limiting substrates
- Maintain selective pressure by substrate limitation or auxotrophies
- Serial passage at mid-exponential phase (OD ≈ 0.3-0.5)
- Monitor growth rates daily using optical density measurements
Selection and Screening
- Isolate clones from evolution endpoint showing improved growth
- Screen for enhanced creatine production via HPLC or LC-MS
- Sequence genomes of improved clones to identify causal mutations
Strain Validation
- Characterize evolved strains in bioreactor conditions
- Quantify TRY metrics (titer, rate, yield)
- Validate genetic stability through serial passages
Through multiple design-build-test-learn (DBTL) cycles combining growth-coupled selection with adaptive evolution, the creatine production titer increased by 58% over the baseline strain [87].
Integration with Biosensor Design for Dynamic Regulation
Synergistic Framework Implementation
Growth-coupled selection systems provide a powerful complement to biosensor-mediated dynamic regulation through synthetic metabolite auxotrophies. The integration creates a comprehensive fitness landscape where both internal metabolic fluxes and external biosensor systems converge to optimize production.
Integrated Regulation System
Implementation Protocol for Combined Systems
Materials:
- Biosensor plasmids with inducible promoters
- Synthetic auxotroph host strains
- Fluorescent reporter genes for biosensor characterization
- Microfluidic or chemostat evolution platforms
Procedure:
Biosensor Integration
- Clone biosensor circuits responsive to pathway intermediates
- Link biosensor output to pathway regulation (activation/repression)
- Characterize biosensor dynamic range and sensitivity
Growth-Coupling Implementation
- Design essential metabolite auxotrophies linked to pathway performance
- Implement computational-predicted knockouts
- Validate growth-production coupling in controlled bioreactors
System Validation
- Monitor real-time biosensor output and growth dynamics
- Quantify production yields under varying selective pressures
- Characterize evolutionary trajectories through genome sequencing
This integrated approach creates a powerful evolutionary feedback loop where biosensors optimize short-term pathway regulation while growth-coupling provides long-term evolutionary pressure for strain improvement [84].
Applications and Performance Metrics
Quantitative Performance Assessment
Table 4: Performance Metrics of Growth-Coupled Production Systems
| Target Product | Host Organism | Coupling Strength | Yield Improvement | Key Genetic Interventions |
|---|---|---|---|---|
| Creatine | Escherichia coli | Strong GC | 58% increase | Glycine amidinotransferase optimization [87] |
| Ethanol | Escherichia coli | Strong GC | >80% theoretical | Anaerobic knockouts [86] |
| N-Hexanol | Escherichia coli | Weak GC | Significant | NAD+ coupling to hexanoic acid [83] |
| L-Glutamate | Corynebacterium glutamicum | Growth-coupled | Enhanced | Phosphoketolase evolution [84] |
| Isobutanol | Escherichia coli | Anaerobic GC | High titer | Redox balancing knockouts [84] |
The performance metrics demonstrate the broad applicability of growth-coupling across diverse products and host organisms. The strongest improvements are typically observed when comprehensive computational design is combined with experimental evolution in multiple DBTL cycles.
Troubleshooting and Optimization Guidelines
Common Implementation Challenges
- Insufficient Coupling Strength: Address by increasing knockout stringency or incorporating cofactor balancing constraints
- Growth Impairment: Implement gradual adaptation through ALE or introduce compensatory mutations
- Genetic Instability: Utilize toxin-antitoxin systems or periodic selection pressure
- Non-Unique Phenotypes: Apply objective function tilting to eliminate alternative optimal solutions [85]
Optimization Recommendations
- Employ multiple selection strains with increasing stringency for stepwise pathway optimization
- Combine growth-coupling with biosensor systems for multidimensional optimization
- Utilize genome-scale models rather than core metabolism models for comprehensive design
- Implement continuous evolution platforms (chemostats) for sustained selective pressure
The integration of growth-coupled selection with biosensor design represents a powerful paradigm for next-generation cell factory development, enabling autonomous optimization of metabolic pathways through evolutionary design principles. This approach significantly accelerates the DBTL cycle by using growth as a high-throughput readout for pathway performance, while creating stable production strains that maintain high productivity through inherent fitness constraints [83] [84].
Comparative Analysis of Different Biosensor Architectures and Host Organisms
Biosensors are indispensable tools in synthetic biology and metabolic engineering, functioning as critical components for dynamic pathway regulation. By detecting specific intracellular or extracellular signals and transducing them into measurable outputs, they enable real-time monitoring and control of metabolic fluxes in living cells [5]. The architectural design of a biosensor and its compatibility with a host organism are primary determinants of its performance and applicability. These engineered systems are pivotal for advancing robust biomanufacturing processes and precision therapeutics, as they allow engineered organisms to maintain optimal function amidst environmental fluctuations [5] [9]. This application note provides a comparative analysis of major biosensor architectures, their quantitative performance metrics, and detailed protocols for their implementation in common host organisms, specifically focusing on their role in dynamic metabolic pathway regulation.
Biosensor Architectures: Mechanisms and Performance Metrics
Biosensors typically consist of a sensor module, which detects a specific input, and an actuator module, which produces a quantifiable or functional output [5]. The two primary categories are protein-based and nucleic acid-based sensors, each with distinct sensing principles and response characteristics.
Table 1: Comparative Analysis of Major Biosensor Architectures
| Category | Biosensor Type | Sensing Principle | Key Advantages | Typical Host Organisms |
|---|---|---|---|---|
| Protein-Based | Transcription Factors (TFs) | Ligand binding induces conformational change, regulating DNA binding and gene expression [5]. | Broad analyte range; direct gene regulation; suitable for high-throughput screening [5]. | E. coli, S. cerevisiae [59] |
| Protein-Based | Two-Component Systems (TCSs) | Sensor kinase autophosphorylates in response to signal and transfers phosphate to a response regulator [5]. | High adaptability; excellent for environmental signal detection; modular signaling [5]. | E. coli, B. subtilis |
| Protein-Based | G-Protein Coupled Receptors (GPCRs) | Ligand binding activates intracellular G-proteins, triggering downstream signaling cascades [5]. | High sensitivity; complex signal amplification; widely tunable; compatible with eukaryotic systems [5]. | S. cerevisiae, mammalian cells |
| RNA-Based | Riboswitches | Ligand binding induces conformational changes in the mRNA leader sequence, affecting translation or transcription [5]. | Compact size; tunable response; reversible; integrates well into metabolic regulation [5]. | E. coli, B. subtilis |
| RNA-Based | Toehold Switches | Binding of a trigger RNA molecule disrupts a hairpin structure, activating translation of a downstream reporter gene [5]. | High specificity; fully programmable; enables sophisticated logic-gated pathway control [5]. | E. coli |
The performance of these architectures is evaluated against several key metrics [5]:
- Dynamic Range: The ratio between the maximum and minimum output signals.
- Operating Range: The concentration window of the analyte over which the biosensor functions optimally.
- Response Time: The speed at which the biosensor reacts to a change in analyte concentration.
- Signal-to-Noise Ratio: The ratio of the specific output signal to the background variability.
A critical trade-off often exists between dynamic range and response threshold, which must be balanced through careful design [5]. Furthermore, for dynamic regulation, performance parameters such as rise-time and signal noise become increasingly important, as slow response times or high noise can significantly hinder controllability [5].
Experimental Protocol: Implementation and Characterization of a Transcription Factor-Based Biosensor
The following protocol outlines the steps for constructing and characterizing a TF-based biosensor in E. coli, based on the DBTL (Design-Build-Test-Learn) cycle exemplified in naringenin biosensor development [59].
Biosensor Construction and Assembly
Materials:
- DNA Parts Library: A collection of genetic components including promoters of varying strengths, ribosome binding sites (RBSs), coding sequences for the transcription factor (e.g., FdeR for naringenin), terminator sequences, and a reporter gene (e.g., GFP) [59].
- Host Strain: An appropriate microbial chassis such as E. coli DH10B or MG1655.
- Assembly Reagents: DNA assembly master mix (e.g., Gibson Assembly or Golden Gate).
- Growth Media: Lysogeny Broth (LB) or defined minimal media (e.g., M9).
Procedure:
- Design: Select a combination of genetic parts from the library. For example, choose a promoter and RBS for the TF expression, and a corresponding operator-reporter module (e.g., fdeO-GFP) [59].
- Build: Assemble the selected parts into a plasmid vector using a standardized DNA assembly method. Transform the assembled construct into the chosen E. coli host strain and plate on selective agar [59].
- Colony Screening: After incubation, pick successful transformants and inoculate them into deep-well plates containing liquid selective media. Grow the cultures overnight to create stock libraries.
Functional Characterization and Dose-Response Analysis
Materials:
- Microplate reader capable of measuring absorbance and fluorescence (e.g., OD600 and GFP fluorescence).
- Black-walled, clear-bottom 96-well or 384-well microplates.
- Stock solution of the target analyte (e.g., naringenin). Prepare a serial dilution in an appropriate solvent [59].
Procedure:
- Culture Inoculation: Dilute overnight cultures of the biosensor strain 1:100 into fresh media in a microplate.
- Analyte Induction: Add different concentrations of the target analyte to the wells. Include a negative control (solvent only).
- Kinetic Measurement: Place the microplate in the pre-warmed plate reader and initiate a kinetic cycle. Measure the OD600 and fluorescence at regular intervals (e.g., every 10-15 minutes) over 6-24 hours.
- Data Processing: At the endpoint (or for each time point), normalize the fluorescence signal by the cell density (RFU/OD600). Plot the normalized fluorescence against the analyte concentration to generate a dose-response curve [59].
- Parameter Extraction: From the dose-response curve, calculate the dynamic range, operational range (EC50), and Hill coefficient using appropriate software (e.g., Prism, Python).
Diagram 1: The DBTL cycle for biosensor optimization, highlighting the influence of environmental context on the testing phase.
Case Study: Quantitative Analysis of a Transporter-Based Biosensor
The SweetTrac1 biosensor, developed from the Arabidopsis thaliana SWEET1 sugar transporter, demonstrates the expansion of biosensor architectures beyond TFs and RNAs to include membrane transporters [89].
Objective: To create a genetically encoded biosensor that translates substrate binding during the transport cycle into a detectable fluorescence change, enabling real-time monitoring of transporter activity in vivo [89].
Protocol:
- Sensor Generation: A circularly permuted superfolded green fluorescent protein (cpsfGFP) was inserted into the intracellular loop connecting the third and fourth transmembrane helices of AtSWEET1 [89].
- Linker Optimization: A gene library of chimera variants with degenerate linkers (2-3 amino acids) was created. Fluorescence-activated cell sorting (FACS) was used to screen hundreds of thousands of cells, isolating highly fluorescent variants for further testing [89].
- Functional Validation: The lead candidate, SweetTrac1, was characterized as follows:
- Transport Assay: The biosensor was expressed in a hexose-transporter-deficient yeast strain (EBY4000). [14C]-glucose influx was measured to confirm the biosensor retained wild-type-like transport function [89].
- Fluorescence Response: Glucose was added to yeast cells expressing SweetTrac1, and fluorescence intensity was measured, showing a concentration-dependent increase [89].
- Binding Specificity: Key amino acids in the substrate-binding site were mutated. Mutations that abolished glucose transport also abolished the fluorescence response, confirming the signal is correlated with specific binding events [89].
Quantitative Analysis: A mathematical model based on mass action kinetics was formulated to correlate the fluorescence response of SweetTrac1 with glucose transport kinetics. The analysis suggested that SWEETs are low-affinity, symmetric transporters that rapidly equilibrate sugar concentrations across the membrane [89]. This case study highlights the potential of transporter-based biosensors for in vivo biochemical studies and metabolic flux analysis.
The Scientist's Toolkit: Essential Research Reagents
Table 2: Key Reagents for Biosensor Development and Characterization
| Reagent / Material | Function / Application | Example Use Case |
|---|---|---|
| Circularly Permuted GFP (cpGFP) | Engineered fluorescent protein that changes fluorescence upon conformational change in a fused partner protein [89]. | Insertion into transporter proteins (e.g., SweetTrac1, AmTrac) to create biosensors [89]. |
| Fluorescence-Activated Cell Sorter (FACS) | High-throughput screening of large cell libraries based on fluorescence intensity [89] [59]. | Rapid isolation of biosensor variants with desired output characteristics from a combinatorial library [89]. |
| Transcription Factor Parts Library | A curated collection of promoters, RBSs, and operator sequences for modular biosensor construction [59]. | Systematic assembly of TF-based biosensors with varied dynamic ranges and sensitivities, as done for the FdeR naringenin sensor [59]. |
| Microplate Reader with Kinetic Capability | Instrument for measuring optical density and fluorescence in multi-well plates over time. | Generating kinetic data and dose-response curves for biosensor characterization [59]. |
| Mathematical Modeling Software | Tools for fitting data to kinetic models and predicting biosensor behavior [89] [59]. | Correlating fluorescence response with analyte concentration or transport rate (e.g., SweetTrac1 model) [89]. |
Context-Dependent Performance and Advanced Workflows
A critical consideration in biosensor design is context dependence—the performance of a genetic circuit can be significantly influenced by the host's environmental conditions, including growth media, carbon sources, and supplements [59]. For instance, the dynamic response of an FdeR-based naringenin biosensor varied substantially across 16 different combinations of media and supplements [59]. This underscores the necessity of characterizing biosensors under conditions that mimic their intended application.
To manage this complexity, a biology-guided machine learning approach is increasingly adopted. This involves [59]:
- Building a combinatorial library of biosensor genetic parts.
- Characterizing the dynamic responses under a wide range of environmental conditions.
- Using the data to calibrate a mechanistic model of the biosensor's dynamics.
- Employing the model to train a machine learning algorithm that can predict optimal biosensor designs and operational conditions for specific requirements.
Diagram 2: Signaling pathway of a transcription factor-based biosensor. The input analyte binds to the TF, enabling it to activate transcription of a reporter gene, producing a measurable fluorescent output.
The strategic selection of biosensor architecture and host organism is fundamental to success in dynamic metabolic pathway regulation. Protein-based systems like TFs offer maturity and a broad analyte range, while RNA-based devices provide high programmability and compact design. The emerging class of transporter-based biosensors opens new avenues for monitoring metabolite flux directly. As the field advances, the integration of high-throughput characterization, mechanistic modeling, and machine learning into a DBTL framework is essential for de-risking the design process and creating robust, context-aware biosensors. These tools are poised to become cornerstones of the bioeconomy, enabling the precise and scalable control of biological systems for industrial biomanufacturing and therapeutic applications [5] [9].
Conclusion
Biosensor technology has revolutionized dynamic metabolic pathway regulation by enabling real-time monitoring and intelligent control of fermentation processes. The integration of advanced computational design, layered genetic circuits, and robust feedback controllers has addressed critical challenges in pathway balancing and industrial scaling. Future directions should focus on expanding the biosensor repertoire for novel metabolites, improving clinical translation through rigorous validation, and leveraging AI-driven design for enhanced performance. These advancements promise to accelerate therapeutic development and establish biosensors as indispensable tools in next-generation biomanufacturing and drug discovery pipelines.
References
- 1. Transcription factor-based biosensors for screening and ... [https://pmc.ncbi.nlm.nih.gov/articles/PMC9939652/]
- 2. Innovations from Design to Applications in Synthetic Biology [https://www.mdpi.com/2079-6374/15/4/221]
- 3. Highly multiplexed design of an allosteric transcription ... [https://www.nature.com/articles/s41467-024-54260-8]
- 4. Transcription factor-based biosensors for detection of ... [https://www.sciencedirect.com/science/article/pii/S187167842300047X]
- 5. Challenges and Opportunities in Smart Biosensing for ... [https://pmc.ncbi.nlm.nih.gov/articles/PMC12455640/]
- 6. Engineering genetic circuits for dynamic control of central ... [https://www.sciencedirect.com/science/article/abs/pii/S109671762500093X]
- 7. Beyond the niche - unlocking the full potential of synthetic ... [https://www.nature.com/articles/s41467-025-65808-7]
- 8. High content design of riboswitch biosensors [https://www.sciencedirect.com/science/article/abs/pii/S0956566322009277]
- 9. Advancing lignocellulosic conversion though biosensor ... [https://pubs.rsc.org/en/content/articlehtml/2025/gc/d5gc03618f]
- 10. Aptamers, Riboswitches, and Ribozymes in S. cerevisiae ... [https://pmc.ncbi.nlm.nih.gov/articles/PMC8002509/]
- 11. Gene Regulation by Riboswitches and Ribozymes [https://www.mskcc.org/research/ski/labs/dinshaw-patel/gene-regulation-riboswitches-and-ribozymes]
- 12. aptamers, riboswitches, ribozymes and DNAzymes [https://pubs.rsc.org/en/content/articlelanding/2020/cs/d0cs00617c]
- 13. Extended Metabolic Biosensor Design for Dynamic Pathway ... [https://pmc.ncbi.nlm.nih.gov/articles/PMC7334618/]
- 14. Genetically encoded tools for measuring and manipulating ... [https://pmc.ncbi.nlm.nih.gov/articles/PMC9093021/]
- 15. Biosensor-enabled pathway optimization in metabolic ... [https://www.sciencedirect.com/science/article/abs/pii/S0958166922000222]
- 16. Advances in the optimization of central carbon metabolism in ... [https://pmc.ncbi.nlm.nih.gov/articles/PMC10122336/]
- 17. Design, Optimization and Application of Small Molecule ... [https://www.frontiersin.org/journals/microbiology/articles/10.3389/fmicb.2017.02012/full]
- 18. Quantitative Imaging of Genetically Encoded Fluorescence ... [https://www.mdpi.com/2079-6374/13/10/939]
- 19. Computational Protein Design: Advancing Biotechnology ... [https://www.sciencedirect.com/science/article/abs/pii/S0079610725000380]
- 20. Computational protein design: Advancing biotechnology ... [https://pubmed.ncbi.nlm.nih.gov/40683605/]
- 21. Directed Evolution of Fluorescent Genetically Encoded ... [https://pubmed.ncbi.nlm.nih.gov/40090897/]
- 22. Development of a highly sensitive PbrR-based biosensor ... [https://www.sciencedirect.com/science/article/abs/pii/S0304389425004017]
- 23. Computational design of sequence-specific DNA-binding ... [https://www.nature.com/articles/s41594-025-01669-4]
- 24. An industrial automated laboratory for programmable ... [https://www.nature.com/articles/s44286-025-00303-w]
- 25. Automated Lab Accelerates Programmable Protein Evolution [https://bioengineer.org/automated-lab-accelerates-programmable-protein-evolution/]
- 26. Engineering and Application of Biosensors for Aromatic ... [https://pmc.ncbi.nlm.nih.gov/articles/PMC12566513/]
- 27. Development of a lysine biosensor for the dynamic regulation ... [https://microbialcellfactories.biomedcentral.com/articles/10.1186/s12934-025-02772-3]
- 28. A quorum sensing-controlled type I CRISPRi toolkit for ... [https://pubmed.ncbi.nlm.nih.gov/40682826/]
- 29. Transcription factor-based biosensors for screening and ... [https://www.frontiersin.org/journals/bioengineering-and-biotechnology/articles/10.3389/fbioe.2023.1118702/full]
- 30. Development of an autonomous and bifunctional quorum ... [https://pmc.ncbi.nlm.nih.gov/articles/PMC6926038/]
- 31. Overcoming Leak Sensitivity in CRISPRi Circuits Using ... [https://pmc.ncbi.nlm.nih.gov/articles/PMC9486968/]
- 32. Sensor-regulator and RNAi based bifunctional dynamic ... [https://www.nature.com/articles/s41467-018-05466-0]
- 33. Modular and signal-responsive transcriptional regulation ... [https://jbioleng.biomedcentral.com/articles/10.1186/s13036-025-00526-8]
- 34. Dynamic range tuning through guide RNA diversion [https://www.sciencedirect.com/science/article/pii/S1871678423000353]
- 35. Development of bifunctional biosensors for sensing and ... [https://pubmed.ncbi.nlm.nih.gov/34610458/]
- 36. Reversible thermal regulation for bifunctional dynamic ... [https://www.nature.com/articles/s41467-021-21654-x]
- 37. Layered feedback control overcomes performance trade-off ... [https://pmc.ncbi.nlm.nih.gov/articles/PMC9474519/]
- 38. Review Genetic circuits for metabolic flux optimization [https://www.sciencedirect.com/science/article/pii/S0966842X24000040]
- 39. Multi-layered computational gene networks by engineered ... [https://www.sciencedirect.com/science/article/pii/S0092867424007165]
- 40. Layering genetic circuits to build a single cell, bacterial half ... [https://bmcbiol.biomedcentral.com/articles/10.1186/s12915-015-0146-0]
- 41. Advances in the dynamic control of metabolic pathways ... [https://www.sciencedirect.com/science/article/pii/S2667370323000358]
- 42. Redesigning regulatory components of quorum-sensing ... [https://www.nature.com/articles/s41467-022-29933-x]
- 43. Construction of multilayered gene circuits using de-novo ... [https://pmc.ncbi.nlm.nih.gov/articles/PMC11539451/]
- 44. Efficient Production of Glucaric Acid by Engineered ... [https://pmc.ncbi.nlm.nih.gov/articles/PMC10304745/]
- 45. One-pot two-strain system based on glucaric acid ... [https://www.sciencedirect.com/science/article/abs/pii/S1096717618302076]
- 46. Highly Efficient Production of N-Acetyl-glucosamine in ... [https://pubmed.ncbi.nlm.nih.gov/34004112/]
- 47. Robust production of N-acetyl-glucosamine in engineered ... [https://www.sciencedirect.com/science/article/pii/S2405805X25000663]
- 48. Expanding flavone and flavonol production capabilities in ... [https://www.frontiersin.org/journals/bioengineering-and-biotechnology/articles/10.3389/fbioe.2023.1275651/full]
- 49. Biosensor-enabled Pathway Optimization in Metabolic ... [https://pmc.ncbi.nlm.nih.gov/articles/PMC9177593/]
- 50. Biosensor-driven, model-based optimization of the ... [https://pubmed.ncbi.nlm.nih.gov/35346204/]
- 51. A Network Approach to Genetic Circuit Designs - PMC [https://pmc.ncbi.nlm.nih.gov/articles/PMC9486963/]
- 52. Context-Dependent Redesign of Robust Synthetic Gene ... [https://pmc.ncbi.nlm.nih.gov/articles/PMC11223972/]
- 53. Design patterns for engineering genetic stability - PMC [https://pmc.ncbi.nlm.nih.gov/articles/PMC8294169/]
- 54. Genetic controllers for enhancing the evolutionary ... [https://www.nature.com/articles/s41467-025-63627-4]
- 55. Construction of multilayered gene circuits using de-novo ... [https://jbioleng.biomedcentral.com/articles/10.1186/s13036-024-00459-8]
- 56. Antithetic proportional-integral feedback for reduced ... [https://pmc.ncbi.nlm.nih.gov/articles/PMC6030643/]
- 57. A hierarchy of biomolecular proportional-integral-derivative ... [https://www.nature.com/articles/s41467-022-29640-7]
- 58. Multicellular PID control for robust regulation of biological ... [https://pmc.ncbi.nlm.nih.gov/articles/PMC11775662/]
- 59. Context-Aware Biosensor Design Through Biology-Guided ... [https://pmc.ncbi.nlm.nih.gov/articles/PMC12186671/]
- 60. Recent advances in biosensors: structure, principles ... [https://www.sciencedirect.com/science/article/abs/pii/S1046202325001665]
- 61. Engineering and Application of Biosensors for Aromatic ... [https://www.mdpi.com/2076-2607/13/10/2358]
- 62. Industrial bioprocess control and optimization in the context ... [https://www.sciencedirect.com/science/article/abs/pii/S0734975009001153]
- 63. Perspectives on systematic optimization of ultrasensitive ... [https://pubs.rsc.org/en/content/articlehtml/2024/tc/d4tc02131b]
- 64. Biosensors and Sensors for the industrial biosynthesis ... [https://cordis.europa.eu/project/id/232522/reporting]
- 65. Non-Specific Adsorption Reduction Methods in Biosensing [https://pmc.ncbi.nlm.nih.gov/articles/PMC6603772/]
- 66. Promising Solutions to Address the Non-Specific ... [https://www.mdpi.com/2227-9040/13/3/92]
- 67. Addressing Signal Drift and Screening for Detection of ... [https://pmc.ncbi.nlm.nih.gov/articles/PMC12327215/]
- 68. Biosensors and their applications – A review - PMC [https://pmc.ncbi.nlm.nih.gov/articles/PMC4862100/]
- 69. A guide to reducing noise and increasing sensitivity in ... [https://blog.igii.uk/a-guide-to-reducing-noise-and-increasing-sensitivity-in-biosensors]
- 70. Innovative approaches to suppress non-specific adsorption ... [https://www.sciencedirect.com/science/article/abs/pii/S0956566324000563]
- 71. The advancement of biosensor design and construction ... [https://www.sciencedirect.com/science/article/pii/S2405805X25000158]
- 72. Quantitative elementary mode analysis of metabolic pathways [https://pmc.ncbi.nlm.nih.gov/articles/PMC1508158/]
- 73. Comparative Analysis of Cell Metabolic Activity Sensing by ... [https://www.mdpi.com/2079-6374/12/9/763]
- 74. Looking through the lens of quantitative biology [https://pmc.ncbi.nlm.nih.gov/articles/PMC10095858/]
- 75. Engineering a biosensor based high-throughput screening ... [https://pubmed.ncbi.nlm.nih.gov/41033575/]
- 76. Accelerating enzyme discovery and engineering with high ... [https://pubs.rsc.org/en/content/articlehtml/2025/np/d4np00031e]
- 77. Extending dynamic and operational range of the biosensor ... [https://www.sciencedirect.com/science/article/pii/S2405805X25000596]
- 78. Genetically encoded biosensors of metabolic function for the ... [https://pmc.ncbi.nlm.nih.gov/articles/PMC12408211/]
- 79. Biolayer interferometry for adeno-associated virus capsid titer ... [https://pmc.ncbi.nlm.nih.gov/articles/PMC11365433/]
- 80. Quantitative analysis of the response of an electrochemical ... [https://www.sciencedirect.com/science/article/abs/pii/S095656630400421X]
- 81. Quantifying Plant Signaling Pathways by Integrating ... [https://pmc.ncbi.nlm.nih.gov/articles/PMC11352283/]
- 82. Calibration and Evaluation of Quantitative Antibody Titers ... [https://pmc.ncbi.nlm.nih.gov/articles/PMC5216424/]
- 83. Growth-coupled selection of synthetic modules to ... [https://www.nature.com/articles/s41467-021-25665-6]
- 84. Synthetic auxotrophs accelerate cell factory development ... [https://link.springer.com/article/10.1007/s11705-024-2454-9]
- 85. Model-driven evaluation of the production potential for growth ... [https://pmc.ncbi.nlm.nih.gov/articles/PMC3125152/]
- 86. Determination of growth-coupling strategies and their ... [https://bmcbioinformatics.biomedcentral.com/articles/10.1186/s12859-019-2946-7]
- 87. Microbial production of creatine using growth-coupled ... [https://pubmed.ncbi.nlm.nih.gov/40712832/]
- 88. Microbial production of creatine using growth-coupled ... [https://systemsbiology.ucsd.edu/publications/2025/microbial-production-creatine-using-growth-coupled-selection-systems]
- 89. Development and quantitative analysis of a biosensor ... [https://pmc.ncbi.nlm.nih.gov/articles/PMC8794804/]