ecFactory: A Computational Pipeline for Predicting Metabolic Engineering Gene Targets
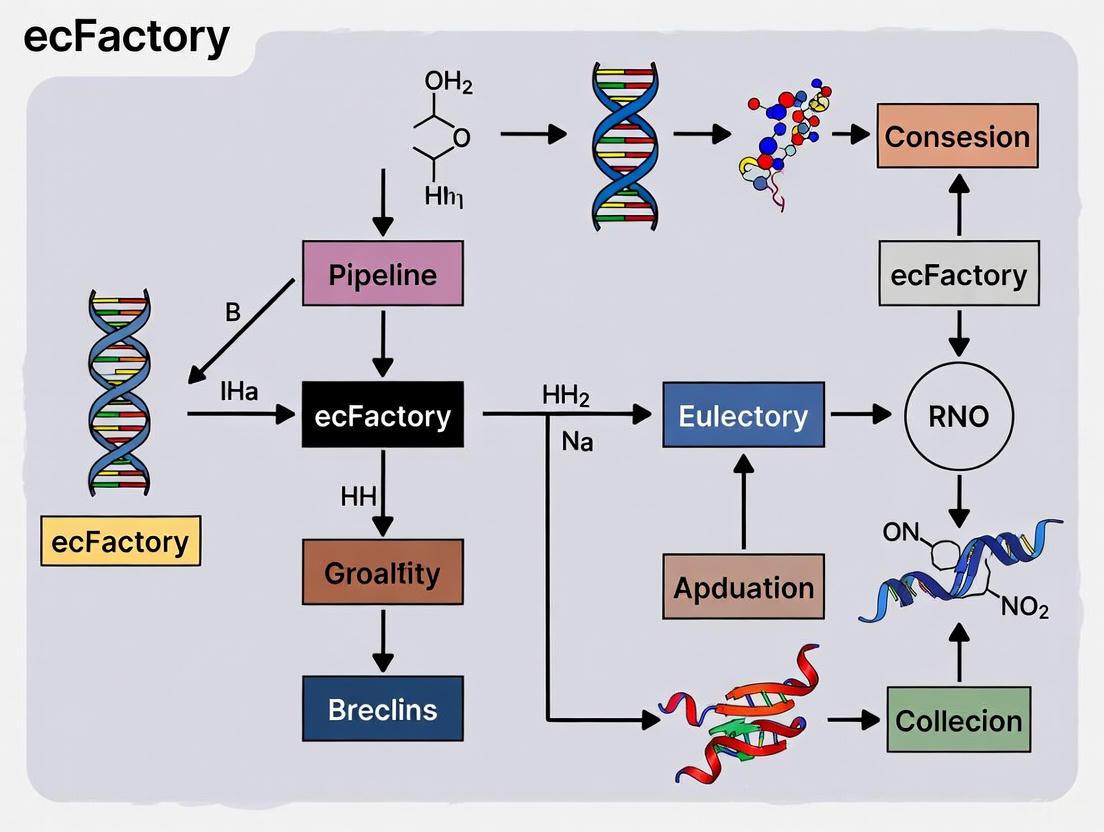
This article provides a comprehensive overview of the ecFactory computational pipeline, a method designed for the systematic prediction of gene targets in metabolic engineering.
ecFactory: A Computational Pipeline for Predicting Metabolic Engineering Gene Targets
Abstract
This article provides a comprehensive overview of the ecFactory computational pipeline, a method designed for the systematic prediction of gene targets in metabolic engineering. Tailored for researchers, scientists, and drug development professionals, we explore the foundational principles that underpin the pipeline, which integrates the FSEOF algorithm with enzyme-constrained genome-scale metabolic models (ecModels) to identify targets for overexpression, knock-down, or knock-out. The scope includes a detailed, step-by-step guide to its methodology and application in projects like enhancing 2-phenylethanol and heme production in yeast. Furthermore, the article addresses common troubleshooting and optimization strategies and conducts a critical validation and comparison of ecFactory's performance against other computational approaches, highlighting its role in accelerating the development of efficient microbial cell factories for valuable chemicals.
The Foundation of ecFactory: Principles and Core Concepts for Predictive Metabolic Engineering
Constraint-Based Modeling (CBM) is a powerful computational framework for analyzing metabolism at the genome scale. This approach uses genome-scale metabolic models (GEMs), which are in silico representations of an organism's entire metabolic network, encompassing all known metabolic reactions and associated genes [1]. CBM operates on the principle of imposing physical and biochemical constraints—such as mass-balance, reaction reversibility, and enzyme capacity—to define a feasible solution space of possible metabolic behaviors, rather than seeking a single unique solution [1]. This makes it particularly valuable for studying complex systems where precise kinetic parameters are unavailable.
The primary methodology for simulating these models is Flux Balance Analysis (FBA). FBA identifies an optimal metabolic flux distribution within the solution space, typically by maximizing an objective function such as biomass production, which serves as a proxy for cellular growth [1]. The ability to predict metabolic phenotypes from genomic information has led to widespread applications of CBM in biotechnology for strain engineering and in biomedicine for understanding host-microbiome interactions and disease mechanisms [2] [3] [4].
From GEMs to Enzyme-Constrained Models (ecModels)
Standard GEMs have a key limitation: they typically do not explicitly account for the proteomic costs of metabolism, such as the cellular investment in enzyme synthesis and the catalytic capacity of enzymes. Enzyme-constrained models (ecModels) address this gap by incorporating enzyme kinetics and proteomic constraints into the modeling framework [5].
The GECKO (Enzyme-Constrained using Kinetic and Omics data) toolbox was developed to enhance existing GEMs with these enzymatic constraints. GECKO expands a conventional GEM by incorporating three key elements [5]:
- Enzyme Pseudoreactions: Reactions that represent the consumption of resources for enzyme production.
- kcat Constraints: The incorporation of enzyme turnover numbers (
kcat) to define the catalytic capacity of an enzyme, thereby setting a maximum flux for its associated reaction. - Total Enzyme Pool Constraint: A global constraint that reflects the limited total protein mass available for metabolic enzymes.
The latest version, GECKO 2.0, features an automated framework for building and updating ecModels, supports a wider range of organisms, and includes improved algorithms for matching and applying kinetic parameters from databases like BRENDA [5]. This toolbox has been used to generate ecModels for key model organisms, including S. cerevisiae, E. coli, and H. sapiens [5] [6].
Table 1: Key Components of the GECKO Toolbox for Constructing ecModels
| Component | Description | Function in Model Construction |
|---|---|---|
| Enzyme Database | Kinetic parameters (e.g., kcat values) sourced from BRENDA. | Provides catalytic rates to constrain reaction fluxes. |
| GEM Importer | Integrates a standard genome-scale metabolic model. | Provides the stoichiometric core network. |
| Enzyme Addition Module | Adds enzyme usage pseudoreactions and links them to metabolic genes. | Introduces proteomic costs into the metabolic network. |
| kcat Matching Algorithm | Hierarchical procedure for assigning kcat values to reactions. | Fills gaps in kinetic data, even for less-studied organisms. |
| Proteomics Integrator | Module for incorporating absolute proteomics data. | Constrains enzyme levels based on experimental measurements. |
| Simulation Utilities | Functions for simulating growth and phenotypes with ecModels. | Enables prediction of metabolic behavior under constraints. |
The ecFactory Pipeline for Predicting Gene Targets
The ecFactory method is a computational pipeline that leverages ecModels for the systematic identification of metabolic engineering targets. It combines the principles of FSEOF (Flux Scanning with Enforced Objective Function) with the enhanced predictive power of enzyme-constrained models [7]. The primary goal of ecFactory is to pinpoint genes for overexpression, knock-down, or knock-out to enhance the production of a desired metabolite.
The method operates through a multi-step computational protocol [7]:
- Simulation with Production Objective: An ecModel is simulated under conditions that enforce a high production rate of the target metabolite.
- Flux Profile Analysis: The resulting flux distribution is analyzed to identify reactions whose fluxes increase alongside the enforced production.
- Enzyme Usage Analysis: The model calculates the required levels of enzymes to support the new flux distribution.
- Target Prioritization: Genes encoding enzymes that are predicted to be heavily utilized or flux-limiting are flagged as potential overexpression targets. Conversely, genes associated with competing pathways may be suggested for deletion.
This pipeline has been successfully applied to predict gene targets for increased production of compounds like 2-phenylethanol and heme in S. cerevisiae [7].
Figure 1: The ecFactory workflow for predicting gene targets. The pipeline starts with a metabolic model, enhances it with enzymatic constraints, and uses a scanning algorithm to identify genes that influence the production of a target metabolite.
Application Note: A Multi-Scale Case Study in Aging Research
Constraint-based modeling is particularly powerful for investigating complex, multi-scale biological systems. A notable application is the study of host-microbiome metabolic interactions during aging [3].
Experimental Background and Objective
Aging is associated with significant changes in the gut microbiome, but the molecular mechanisms and their impact on host health remain unclear. Researchers aimed to characterize the metabolic interplay between the host and its gut microbiome throughout the aging process and identify specific pathways that could influence aging phenotypes [3].
Integrated Experimental and Modeling Protocol
Step 1: Multi-omics Data Generation
- Input: Colon, liver, and brain tissues from mice across a lifespan (2 to 30 months).
- Methods:
- Metagenomics: Shotgun and long-read sequencing of fecal samples to profile the gut microbiome. This resulted in 181 Metagenome-Assembled Genomes (MAGs).
- Transcriptomics: RNA sequencing of host tissues.
- Metabolomics: Profiling of metabolic compounds.
- Output: Taxonomic and functional profiles of the microbiome; host gene expression data; metabolite measurements [3].
Step 2: Metabolic Network Reconstruction
- For each of the 181 bacterial MAGs, a genome-scale metabolic model was reconstructed using the
gapseqtool. - A separate metabolic model was used for the host (Recon 2.2), with instances for the colon, liver, and brain.
- These models were integrated into a single metaorganism metabolic model, connecting the host tissues via the bloodstream and linking them to the microbiome model via the gut lumen [3].
Step 3: Model Simulation and Analysis
- The integrated model was used to simulate metabolic states under different conditions.
- Correlation Analysis: Statistical associations were computed between microbial metabolic functions (reactions) and host transcript levels.
- Aging Trajectory Analysis: The models were contextualized with age-specific data to predict how metabolic interaction patterns shift with age [3].
Step 4: Validation
- Predictions of microbiome-dependent host functions were compared against transcriptomic data from germ-free (GF) mice and conventionalized (CONVD) mice to identify genes responsive to microbial colonization [3].
Key Findings and Output
The modeling effort revealed a pronounced age-related decline in metabolic activity within the gut microbiome. It predicted a specific reduction in beneficial metabolic interactions, including a downregulation of essential host pathways in nucleotide metabolism that rely on microbial support. These pathways are critical for maintaining intestinal barrier function and cellular homeostasis, providing a mechanistic link between microbiome changes and age-related host physiology decline [3].
Table 2: Key Metabolic Changes Predicted by the Aging Host-Microbiome Model
| Aspect Analyzed | Finding in Aged Mice | Predicted Impact on Host |
|---|---|---|
| Overall Microbiome Activity | Pronounced reduction | Lower contribution to host energy and metabolite pools. |
| Inter-bacterial Interactions | Reduced beneficial metabolite exchange | Less stable and less resilient microbial community. |
| Host Nucleotide Metabolism | Significantly downregulated | Compromised intestinal barrier function, impaired cellular replication. |
| Systemic State | Increased inflammation (Inflammaging) | Driven by microbial products crossing a weakened gut barrier. |
The Scientist's Toolkit: Essential Research Reagents and Materials
The following table details key software, databases, and computational tools essential for conducting research in constraint-based metabolic modeling and applying the ecFactory pipeline.
Table 3: Essential Research Reagent Solutions for Constraint-Based Modeling
| Tool/Resource Name | Type | Brief Function and Application |
|---|---|---|
| COBRApy [2] [8] | Software Package | A Python toolbox for simulating constraint-based metabolic models. Essential for implementing FBA and related algorithms. |
| GECKO Toolbox [5] | Software Pipeline | A MATLAB-based toolbox for enhancing GEMs with enzymatic constraints to generate ecModels. Core to the ecFactory method. |
| ecModels Container [6] [9] | Model Repository | A curated collection of pre-built enzyme-constrained models for various organisms, hosted on GitHub. |
| BRENDA Database [5] | Kinetic Database | The main repository for enzyme kinetic parameters (e.g., kcat), which are used by GECKO to parameterize ecModels. |
| AGORA2 [4] | Model Resource | A collection of curated, genome-scale metabolic models for 7,302 human gut microbes, enabling community and host-microbiome modeling. |
| gapseq [3] | Software Tool | A tool for the reconstruction of genome-scale metabolic networks from genomic data. Used for drafting models from MAGs. |
| MetaCyc [3] [1] | Pathway Database | A database of experimentally elucidated metabolic pathways and enzymes, used for pathway annotation and gap-filling in reconstructions. |
Protocol: Implementing a Basic ecFactory Analysis
This protocol provides a step-by-step guide for running the ecFactory method to identify gene targets for metabolic engineering, using a yeast model as an example.
Objective: To identify gene overexpression and knockout targets in S. cerevisiae for enhanced production of 2-phenylethanol.
Required Software and Data:
- MATLAB (version 7.3 or higher).
- The GECKO and ecFactory toolboxes (cloned from their respective GitHub repositories).
- An enzyme-constrained model of S. cerevisiae (e.g., ecYeastGEM) [7].
- The COBRA Toolbox for MATLAB.
Procedure:
Model Preparation
- Load the ecYeastGEM model into the MATLAB workspace.
- Ensure the model is functional by running a test simulation to verify growth under standard conditions.
- Define the target metabolite (e.g., 2-phenylethanol exchange reaction) and the biomass reaction as the primary objective.
Run the ecFactory Algorithm
- Execute the main
ecFactoryfunction, providing the following inputs:- The loaded ecModel.
- The identifier for the target product exchange reaction.
- The identifier for the biomass reaction.
- The algorithm will perform an FSEOF-style analysis on the enzyme-constrained model. It enforces a gradually increasing flux for the product reaction and scans for other reaction fluxes that correlate with this increase.
- Execute the main
Analysis of Output
- The method generates a list of candidate reactions whose fluxes increase with enforced product formation.
- For each candidate reaction, the corresponding gene-protein-reaction (GPR) rules are examined.
- Genes associated with these reactions are identified as potential overexpression targets.
- The model can also be used to simulate gene knockouts to identify competing pathways. Genes whose deletion increases the production yield are identified as potential knockout targets.
Output and Validation
- The final output is a ranked list of suggested genetic modifications.
- The results should be validated through experimental efforts, such as cultivating engineered yeast strains and measuring the titers of the target metabolite [7].
Figure 2: A simplified workflow for the ecFactory protocol, from model preparation to experimental validation of predicted gene targets.
The Role of Enzyme-Constrained Models (ecModels) in Enhancing Prediction Accuracy
Genome-scale metabolic models (GEMs) are computational representations of cellular metabolism that enable mathematical exploration of metabolic behaviors within environmental and stoichiometric constraints. While these models have seen wide usage in biotechnology and biomedicine, they often fail to correctly predict key phenotypes, particularly the suboptimal metabolism observed in microorganisms. A major limitation of traditional GEMs is that they assume a linear increase in growth and product yields as substrate uptake rates rise, which frequently diverges from experimental measurements. This discrepancy arises because GEMs consider only reaction stoichiometries while lacking other biological constraints that shape cellular behavior [10] [11].
The integration of enzymatic constraints into metabolic models addresses these limitations by incorporating fundamental biological principles of resource allocation and enzyme kinetics. Enzyme-constrained models (ecModels) enhance traditional GEMs by accounting for the limited amount of protein molecules within cells and the catalytic efficiency of enzymes. This approach has proven particularly valuable for explaining metabolic behaviors that defy optimality predictions, such as overflow metabolism in Escherichia coli and the Crabtree effect in Saccharomyces cerevisiae, where microorganisms preferentially produce byproducts like acetate or ethanol even in the presence of oxygen [10] [12]. By embedding enzyme kinetic parameters and incorporating constraints on total cellular protein content, ecModels significantly narrow the solution space of feasible metabolic flux distributions, leading to more accurate phenotypic predictions [10] [13].
Theoretical Foundation and Key Methodological Approaches
Fundamental Principles of Enzyme Constraints
Enzyme-constrained models are founded on the principle that cellular metabolism is limited not only by stoichiometry but also by physicochemical constraints, with enzyme abundance and catalytic efficiency representing key determinants. The core mathematical formulation introduces an enzymatic constraint into the traditional flux balance analysis framework. This constraint, represented by Equation (1), limits the total enzyme usage by metabolic reactions based on enzyme kinetic parameters and the total protein budget available in the cell [10]:
Where vi represents the flux through reaction i, MWi is the molecular weight of the enzyme catalyzing the reaction, kcat,i is the enzyme's turnover number, σi is the enzyme saturation coefficient, ptot is the total protein fraction in the cell, and f is the mass fraction of enzymes in the total proteome [10].
This fundamental equation captures the trade-off between enzyme usage efficiency and metabolic output, providing a mechanistic basis for predicting cellular behaviors that emerge from resource allocation constraints. The incorporation of these enzyme constraints explains why microorganisms often exhibit suboptimal yields under high substrate uptake conditions, as producing and maintaining metabolic enzymes incurs significant resource costs that must be balanced against growth objectives [10] [13].
Several computational frameworks have been developed for constructing enzyme-constrained models, each with distinct approaches to incorporating enzymatic constraints:
Table 1: Major ecModel Construction Platforms and Their Key Features
| Method | Key Features | Representative Applications | Implementation |
|---|---|---|---|
| GECKO | Adds enzyme usage reactions to stoichiometric matrix; Incorporates proteomics data | ecYeast7, ecModels for various organisms [13] | MATLAB toolbox |
| ECMpy | Simplified workflow without modifying stoichiometric matrix; Automated parameter calibration | eciML1515 (E. coli), ecMTM (M. thermophila) [10] [14] | Python package |
| sMOMENT/AutoPACMEN | Reduced variable count; Direct constraint integration | Enhanced E. coli iJO1366 model [12] | Automated toolbox |
| ETFL | Integration of thermodynamic and enzyme constraints | E. coli model with dual constraints [15] | Python formulation |
The GECKO (Genome-scale model to account for Enzyme Constraints, using Kinetics and Omics) approach expands the original metabolic model by introducing pseudo-reactions and metabolites representing enzyme usage. This method allows direct incorporation of measured enzyme concentrations when available, setting upper limits for flux capacities through specific enzymatic reactions [16] [13].
In contrast, the ECMpy framework implements a simplified workflow that directly adds a total enzyme amount constraint to existing GEMs without modifying the stoichiometric matrix structure. This approach maintains compatibility with standard constraint-based modeling tools while incorporating enzyme constraints through additional linear equations [10] [11].
The sMOMENT (short MOMENT) method, implemented in the AutoPACMEN toolbox, represents a streamlined version of the earlier MOMENT approach. It achieves equivalent predictions with significantly fewer variables by directly integrating the relevant enzyme constraints into the standard representation of a constraint-based model [12].
Quantitative Assessment of Prediction Accuracy
The enhancement in prediction accuracy achieved by enzyme-constrained models is most evident in simulations of microbial growth on various carbon sources. Experimental validation studies demonstrate that ecModels provide substantially better agreement with measured growth rates compared to traditional GEMs.
Table 2: Performance Comparison of Enzyme-Constrained vs. Traditional Models
| Model Type | Organism | Prediction Improvement | Experimental Validation |
|---|---|---|---|
| eciML1515 | Escherichia coli | Significant improvement on 24 single-carbon sources [10] | Estimation error reduced compared to iML1515 |
| ecYeast | Saccharomyces cerevisiae | Accurate prediction of Crabtree effect [12] | Agreement with overflow metabolism data |
| ecMTM | Myceliophthora thermophila | Enhanced prediction of substrate hierarchy [14] | Accurate carbon source utilization patterns |
| sMOMENT-iJO1366 | Escherichia coli | Superior aerobic growth prediction without uptake limits [12] | 24 different carbon sources |
For example, the eciML1515 model for Escherichia coli demonstrated significantly improved growth rate predictions on 24 single-carbon sources when compared with the base iML1515 model. The enzyme-constrained model was able to recapitulate experimental growth rates without requiring artificial constraints on substrate uptake rates, a limitation common to traditional GEMs [10].
Similarly, the ecMTM model for Myceliophthora thermophila not only improved quantitative growth predictions but also accurately captured the hierarchical utilization of five carbon sources derived from plant biomass hydrolysis. This capability to predict substrate preference patterns based on enzyme efficiency considerations represents a significant advancement over traditional modeling approaches [14].
Explaining Metabolic Phenomena Through Enzyme Constraints
Enzyme-constrained models have successfully explained several metabolic phenomena that were previously puzzling from a stoichiometric perspective:
Overflow Metabolism: eciML1515 simulations revealed that redox balance, rather than purely kinetic constraints, was the key factor differentiating E. coli and S. cerevisiae overflow metabolism patterns [10].
Metabolic Trade-offs: Exploring metabolic behaviors under different substrate consumption rates revealed the tradeoff between enzyme usage efficiency and biomass yield, explaining why microorganisms often operate at suboptimal yields [10].
Enzyme Cost Analysis: ecModels enable calculation of reaction enzyme costs and energy synthesis enzyme costs, providing insights into the metabolic adjustment strategies employed by cells under different nutrient conditions [10] [14].
These capabilities demonstrate how ecModels move beyond descriptive modeling to provide mechanistic explanations for cellular metabolic strategies, making them valuable tools for both basic research and metabolic engineering applications.
Experimental Protocols and Implementation
Protocol for Constructing ecModels Using GECKO 3.0
The GECKO (Genome-scale model to account for Enzyme Constraints, using Kinetics and Omics) toolbox provides a systematic approach for reconstructing enzyme-constrained models. The protocol consists of five main stages [13]:
Stage 1: ecModel Structure Expansion
- Start with a high-quality metabolic model in SBML format
- Expand the model structure to include enzyme usage reactions
- Add enzyme pseudometabolites and exchange reactions
- Define molecular weights for all enzymes in the model
Stage 2: Integration of Enzyme Turnover Numbers
- Collect kcat values from BRENDA and SABIO-RK databases
- Incorporate deep learning-predicted enzyme kinetics for gaps
- Apply subcellular localization adjustments
- Handle isoenzymes and enzyme complexes appropriately
Stage 3: Model Tuning
- Identify reactions with high enzyme usage (>1% of total)
- Compare predicted fluxes with 13C experimental data
- Adjust kcat values to improve agreement with experimental data
- Calibrate total enzyme pool size
Stage 4: Integration of Proteomics Data
- Incorporate absolute proteomics measurements if available
- Set individual enzyme constraints based on measured concentrations
- Update total protein pool based on proteomics data
Stage 5: Simulation and Analysis
- Perform flux balance analysis with enzyme constraints
- Analyze flux variability and enzyme usage
- Predict metabolic engineering targets
The complete protocol takes approximately 5 hours for yeast models and can be adapted for other organisms [13].
Workflow for ECMpy-Based ecModel Construction
ECMpy provides a Python-based alternative for constructing enzyme-constrained models with a simplified workflow [10] [11]:
The ECMpy workflow begins with preprocessing of the base GEM, including splitting reversible reactions to account for potentially different kcat values in forward and backward directions. The tool then automates the collection of enzyme kinetic parameters from various databases, with the latest version ECMpy 2.0 employing machine learning to significantly enhance parameter coverage [11].
Key advantages of the ECMpy approach include:
- Direct integration with COBRApy toolbox for seamless analysis
- JSON-based storage of enzyme constraint information
- Automated calibration of enzyme kinetic parameters
- Compatibility with standard constraint-based modeling functions
The resulting enzyme-constrained model can be used to simulate various physiological conditions and identify enzyme limitations that constrain metabolic performance [10].
Successful construction and application of enzyme-constrained models requires several key resources and computational tools:
Table 3: Essential Research Reagents and Computational Tools for ecModel Construction
| Resource Category | Specific Tools/Databases | Primary Function | Key Features |
|---|---|---|---|
| Kinetic Databases | BRENDA [12], SABIO-RK [12] | Source of enzyme turnover numbers | Curated experimental kcat values |
| Machine Learning Predictors | DLKcat [14], TurNuP [14] | Prediction of missing kcat values | Expanded parameter coverage |
| Model Construction Toolboxes | GECKO [13], ECMpy [10], AutoPACMEN [12] | Automated ecModel reconstruction | Organism-specific template models |
| Simulation Environments | COBRApy [10], RAVEN Toolbox [17] | Flux balance analysis | Compatibility with SBML format |
| Omics Integration Tools | Proteomics data analysis pipelines | Parameterization with experimental data | Absolute protein quantification |
The integration of machine learning-predicted enzyme kinetics has particularly advanced the field by addressing the critical challenge of limited enzyme kinetic parameter coverage. Tools like DLKcat and TurNuP use deep learning approaches to predict kcat values for enzymes lacking experimental measurements, enabling construction of ecModels for less-characterized organisms [14].
For researchers working with non-model organisms, the RAVEN Toolbox and CarveFungi provide automated reconstruction of draft metabolic models from genomic and proteomic data, which can serve as starting points for ecModel development [17].
Applications in Metabolic Engineering and Cell Factory Design
Enzyme-constrained models have demonstrated significant value in metabolic engineering and the design of microbial cell factories for bioproduction. By explicitly accounting for enzyme allocation costs, ecModels enable identification of non-intuitive engineering targets that would be overlooked by traditional GEMs.
Predicting Metabolic Engineering Targets
Case studies across multiple organisms demonstrate the power of ecModels to predict effective metabolic engineering strategies:
In Escherichia coli, ecModel simulations have successfully predicted gene amplification targets for improving production of compounds like lysine, with experimental validation showing significant improvements in product titers [13].
For Saccharomyces cerevisiae, enzyme-constrained models have guided engineering strategies that resulted in a 70-fold improvement in intracellular heme production by identifying and addressing enzymatic bottlenecks [13].
The ecMTM model for Myceliophthora thermophila successfully predicted known targets for metabolic engineering and proposed new potential modifications for chemical production, demonstrating the value of enzyme cost considerations in strain design [14].
Integration with Artificial Intelligence
The emerging integration of ecModels with artificial intelligence approaches represents a powerful frontier in metabolic engineering:
Hybrid Modeling: Combining mechanistic ecModels with machine learning enables improved prediction of metabolic behaviors while maintaining biological interpretability [18].
Pathway Prediction: AI-powered tools like EZSpecificity enhance enzyme substrate specificity prediction, achieving 91.7% accuracy in identifying potential reactive substrates compared to 58.3% for previous state-of-the-art models [19].
Multi-omics Integration: Advanced ecModels can incorporate transcriptomics, proteomics, and metabolomics data to create context-specific models for different physiological conditions [17].
These developments support the creation of more realistic digital cell twins that can accelerate the design-build-test-learn cycle in metabolic engineering, reducing the time and resources required to develop high-performance industrial strains.
Visualization of Enzyme-Constrained Model Construction Workflow
The process of constructing and utilizing enzyme-constrained models follows a systematic workflow that integrates various data sources and computational steps:
This workflow highlights the iterative nature of ecModel development, where initial predictions are refined through parameter calibration and validation against experimental data. The final output includes specific metabolic engineering targets that consider both stoichiometric and enzymatic limitations.
Enzyme-constrained metabolic models represent a significant advancement over traditional stoichiometric models by incorporating fundamental principles of enzyme kinetics and cellular resource allocation. The demonstrated improvements in predicting growth phenotypes, substrate utilization patterns, and metabolic engineering targets underscore the value of this modeling framework for both basic research and biotechnology applications.
Future developments in the field are likely to focus on several key areas:
- Enhanced integration of multi-omics data to create context-specific ecModels for different environmental conditions
- Improved machine learning approaches for predicting enzyme kinetic parameters across diverse organisms
- Development of multi-scale models that incorporate transcriptional regulation and metabolic signaling
- Expansion to multi-cellular systems and microbial communities for industrial and biomedical applications
As these tools become more accessible and accurate, they are poised to play an increasingly central role in rational metabolic engineering and the design of efficient microbial cell factories for sustainable bioproduction.
Integrating FSEOF (Flux Scanning with Enforced Objective Function) into the Pipeline
Flux Scanning based on Enforced Objective Flux (FSEOF) is a computational algorithm designed to systematically identify gene amplification targets in metabolic networks for enhanced production of desired bioproducts [20]. Unlike gene knockout strategies which are relatively straightforward to implement, identifying reliable gene amplification targets has been historically challenging because simply increasing gene expression does not necessarily result in increased metabolic fluxes due to complex regulatory constraints [20]. The FSEOF method addresses this gap by scanning all metabolic fluxes in a genome-scale metabolic model and selecting those fluxes that consistently increase when the flux toward product formation is artificially enforced as an additional constraint during flux analysis [20] [21].
Originally developed for metabolic engineering of microbial strains, FSEOF has proven particularly valuable for identifying targets for overproduction of various compounds including lycopene, shikimic acid, and putrescine in Escherichia coli [20] [21]. The method has since been adapted and extended for various applications, including co-production of multiple metabolites and integration with additional physiological constraints [22] [21]. Recent studies have demonstrated its utility in diverse organisms, including the first comprehensive metabolic model of Umbelopsis species for optimizing polyunsaturated fatty acid production [23].
Algorithmic Foundations and Recent Advancements
Core FSEOF Methodology
The fundamental principle behind FSEOF involves progressively enforcing the flux through the product reaction of interest and observing how other metabolic fluxes respond to this enforced change [20] [22]. The algorithm follows these key steps:
- Determine Maximum Flux Values: Calculate the maximum biomass formation rate (vmax,bio) and the maximum product formation rate (vmax,prdt) using Flux Balance Analysis (FBA) with respective objective functions.
- Enforce Product Flux: Systematically pin the product flux (v_prdt) to values ranging from its wild-type flux to x% of its theoretical maximum flux.
- Scan Flux Changes: At each enforced product flux level, compute metabolic fluxes and identify reactions whose fluxes increase proportionally with the enforced product flux.
- Select Amplification Targets: Reactions demonstrating consistent flux increases are selected as potential amplification targets for metabolic engineering [20] [22].
This approach successfully identified amplification targets for lycopene production in E. coli, including genes such as dxs, idi, fbaA, and tpiA [20]. When implemented experimentally, these targets led to significant synergistic enhancement of lycopene production, particularly when combined with gene knockout strategies [20].
Advanced FSEOF Variants
FVSEOF with Grouping Reaction (GR) Constraints
The original FSEOF method was enhanced through the incorporation of Grouping Reaction (GR) constraints to address the challenge of large flux solution spaces in metabolic models [21]. This advanced algorithm, termed FVSEOF with GR constraints, incorporates physiological data through:
- Genomic Context Analysis: Using the STRING database to identify functionally related reactions through conserved neighborhood, gene fusion, and co-occurrence analyses [21].
- Flux-Converging Pattern Analysis: Examining the number of carbon atoms in metabolites and flux-converging patterns from carbon sources to constrain flux scales [21].
- Simultaneous Constraints: Applying simultaneous on/off constraints (Con/off) and flux scale constraints (Cscale) to grouped reactions based on genomic context and flux-converging patterns [21].
This approach demonstrated improved performance in identifying reliable amplification targets for putrescine production in E. coli, with experimental validation confirming enhanced production yields [21].
co-FSEOF for Multi-Product Optimization
The co-FSEOF algorithm extends the original methodology to identify intervention strategies for co-optimizing production of multiple metabolites [22]. This framework enables:
- Identification of Co-Production Targets: Finding all pairs of products that can be co-optimized through single interventions.
- Higher-Order Intervention Strategies: Identifying amplification and knockout targets for given sets of metabolites.
- Organism-Specific Analysis: Application to genome-scale metabolic models of E. coli and Saccharomyces cerevisiae under aerobic and anaerobic conditions [22].
This approach revealed that anaerobic conditions support co-production of a higher number of metabolites compared to aerobic conditions in both organisms [22].
ET-OptME: Integrating Enzyme and Thermodynamic Constraints
A recent protein-centered workflow layers enzyme efficiency and thermodynamic feasibility constraints onto genome-scale metabolic models [24]. This framework, ET-OptME, addresses limitations of classical stoichiometric algorithms like FSEOF by:
- Mitigating thermodynamic bottlenecks through stepwise constraint-layering.
- Optimizing enzyme usage costs for more physiologically realistic intervention strategies.
- Demonstrating significant improvement in prediction accuracy and precision compared to previous constraint-based methods [24].
Quantitative evaluation across five product targets in Corynebacterium glutamicum models showed at least 292% increase in minimal precision and 106% increase in accuracy compared to stoichiometric methods [24].
Table 1: Comparison of FSEOF Algorithm Variants
| Algorithm | Key Features | Applications | Advantages | Limitations |
|---|---|---|---|---|
| FSEOF [20] | Scans flux changes with enforced product flux | Lycopene production in E. coli | Simple implementation; Experimentally validated | Large flux solution space; No regulatory constraints |
| FVSEOF with GR [21] | Incorporates genomic context and flux-converging patterns | Shikimic acid and putrescine production in E. coli | Reduced solution space; More reliable predictions | Requires additional omics data |
| co-FSEOF [22] | Extends FSEOF for multiple products | Co-production analysis in E. coli and S. cerevisiae | Enables multi-product optimization; Identifies synergistic targets | Increased computational complexity |
| ET-OptME [24] | Adds enzyme and thermodynamic constraints | Multiple products in C. glutamicum | Improved physiological relevance; Higher accuracy | Complex implementation; Computational intensity |
Experimental Protocols and Workflows
Standard FSEOF Implementation Protocol
Materials and Software Requirements:
- Genome-scale metabolic model (e.g., EcoMBEL979 for E. coli [21])
- Constraint-based reconstruction and analysis (COBRA) toolbox
- Flux Balance Analysis (FBA) and Flux Variability Analysis (FVA) capabilities
- Computational environment (MATLAB, Python, or R)
Procedure:
- Model Preparation: Load the genome-scale metabolic model and verify mass and charge balance of all reactions.
- Constraint Definition: Set appropriate physiological constraints including:
- Baseline Flux Calculation:
- Compute wild-type growth rate with biomass maximization as objective
- Calculate maximum product formation rate with product exchange reaction as objective
- Flux Enforcement and Scanning:
- For i = 1 to n (typically n=10-20 steps):
- Set product flux constraint: vprdt = vwt,prdt + (i/n)*(vmax,prdt - vwt,prdt)
- Maximize biomass subject to this constraint
- Record all metabolic fluxes at this enforced level
- For i = 1 to n (typically n=10-20 steps):
- Target Identification:
- Identify reactions with monotonically increasing fluxes across enforcement levels
- Filter targets based on slope threshold (typically > 0) [20]
- Rank targets by consistency and magnitude of flux increase
Validation:
- Compare predictions with known experimental results for validation compounds
- For novel targets, implement genetic modifications and measure product yields
- Use 13C metabolic flux analysis for experimental flux validation where possible [21]
FVSEOF with GR Constraints Protocol
Additional Requirements:
- Genomic context data (STRING database or equivalent)
- Carbon mapping information for flux-converging analysis
- Programming environment for implementing GR constraints
Procedure:
- Group Reaction Identification:
- Perform genomic context analysis to identify functionally related reactions
- Conduct flux-converging pattern analysis to determine CxJy indices
- Define reaction groups with identical CxJy indices and functional relationships [21]
- GR Constraint Implementation:
- Apply simultaneous on/off constraints (Con/off) to grouped reactions
- Implement flux scale constraints (Cscale) using the formula: [ \sqrt{(v1n - \frac{v1n + v2n}{2})^2 + (v2n - \frac{v1n + v2n}{2})^2} \leq \delta ] where vn represents normalized flux values [21]
- Constrained FVSEOF Execution:
- Perform flux variability scanning with enforced objective flux
- Apply GR constraints during FVA to reduce solution space
- Target Selection and Prioritization:
- Identify amplification targets from constrained flux variability results
- Prioritize targets based on functional importance and experimental feasibility
Workflow Visualization
Diagram 1: Core FSEOF workflow for identifying gene amplification targets.
Integration with ecFactory Prediction Pipeline
Pipeline Architecture and Data Flow
The integration of FSEOF into the ecFactory computational pipeline enhances its capability for systematic identification of gene amplification targets alongside traditional knockout strategies. The integrated pipeline operates through the following stages:
Multi-Algorithm Target Identification:
- FSEOF and variants for amplification target identification
- FastKnock for comprehensive knockout strategy enumeration [25]
- MCSEnumerator for minimal cut set analysis
- OptForce for multi-target intervention strategies
Target Prioritization and Synergy Analysis:
- Rank targets by predicted impact on product yield
- Evaluate combinatorial effects of amplification and knockout strategies
- Assess implementation feasibility based on genetic manipulation complexity
Experimental Validation Cycle:
- Implement top-ranked targets in model organisms
- Measure product yields and growth characteristics
- Refine computational models based on experimental results
Diagram 2: FSEOF integration within the ecFactory prediction pipeline.
Case Study: Lipid Production in Oleaginous Fungi
A recent application demonstrating FSEOF integration in ecFactory involved lipid production optimization in Umbelopsis sp. WA50703, an oleaginous fungus [23]. The implementation:
- Utilized the first comprehensive metabolic model of Umbelopsis species (iUmbe1) containing 2,418 metabolites, 2,215 reactions, and 1,627 genes
- Applied FSEOF to identify 33 genes associated with 23 metabolic reactions relevant to lipid biosynthesis
- Revealed acetyl-CoA carboxylase and carbonic anhydrase as prime amplification candidates for enhancing polyunsaturated fatty acid production
- Achieved 81.05% predictive accuracy against experimental data, validating model reliability [23]
This case study highlights how FSEOF integration enables rapid identification of key metabolic bottlenecks and prioritization of engineering targets in non-model organisms with biotechnological potential.
Research Reagent Solutions
Table 2: Essential Research Reagents and Computational Tools for FSEOF Implementation
| Category | Specific Tools/Reagents | Function/Purpose | Examples/Sources |
|---|---|---|---|
| Genome-Scale Models | EcoMBEL979, iJR904, iUmbe1 | Provide metabolic network representation for simulations | [20] [21] [23] |
| Software Toolboxes | COBRA Toolbox, RAVEN Toolbox | Implement FBA, FVA, and pathway analysis | [23] |
| Computational Environments | MATLAB, Python, R | Provide platform for algorithm implementation and execution | [25] [23] |
| Gene Expression Systems | pTrc99A vector system | Enable controlled gene overexpression in engineered strains | [20] |
| Flux Analysis Tools | 13C Metabolic Flux Analysis | Experimental validation of predicted flux distributions | [21] |
| Strain Engineering Tools | RED recombinase system, CRISPR-Cas9 | Enable precise genetic modifications in host organisms | [20] |
| Model Validation Databases | STRING database, MetaCyc | Provide genomic context and pathway information for constraint implementation | [21] |
Troubleshooting and Optimization Guidelines
Common Implementation Challenges
Limited Flux Response:
- Problem: Few reactions show consistent flux increases with enforced product flux
- Solution: Loosen physiological constraints; check for network gaps; verify product pathway completeness
Unrealistic Flux Predictions:
- Problem: Predicted amplification targets show minimal experimental impact
- Solution: Incorporate thermodynamic constraints (ET-OptME approach [24]); implement GR constraints to reduce solution space [21]
High Computational Demand:
- Problem: FSEOF execution time prohibitive for large models
- Solution: Implement reaction pruning [25]; use parallel computing; focus on subsystem analyses
Performance Optimization Strategies
Model Reduction:
- Remove blocked reactions prior to FSEOF analysis
- Focus on relevant metabolic subsystems connected to target product
- Implement FastKnock-inspired pruning algorithms to reduce search space [25]
Constraint Refinement:
Algorithmic Enhancements:
- Implement co-FSEOF for multi-product optimization [22]
- Combine with OptForce for comprehensive intervention strategies
- Integrate machine learning approaches for target prioritization
The integration of FSEOF into the ecFactory computational pipeline represents a significant advancement in systematic identification of gene amplification targets for metabolic engineering. The method's core strength lies in its ability to directly link enforced product formation with systematic scanning of metabolic flux changes, providing a rational approach to overcoming metabolic bottlenecks.
Recent advancements including GR constraints, multi-product optimization capabilities, and integration of enzyme thermodynamic constraints have substantially improved the predictive accuracy and practical utility of FSEOF-derived strategies [22] [24] [21]. The successful application to diverse biological systems from E. coli to oleaginous fungi demonstrates the generalizability of the approach [20] [23].
Future development directions should focus on enhanced integration of multi-omics data, improved prediction of regulatory constraints, and development of more efficient computational implementations to handle increasingly complex metabolic models. As the field progresses toward whole-cell model simulations, FSEOF and its variants will continue to play a crucial role in bridging computational predictions with experimental implementation in metabolic engineering pipelines.
Within the domain of modern metabolic engineering, the design of high-performance microbial cell factories is a cornerstone of industrial biotechnology. The core challenge lies in the precise identification of gene targets for genetic modulation—namely overexpression, knock-down, and knock-out—to redirect cellular metabolism toward the enhanced production of a desired compound. The ecFactory method addresses this challenge directly. It is a multi-step computational pipeline designed to systematically identify these metabolic engineering targets by integrating the principles of Flux Scanning with Enforced Objective Function (FSEOF) with the capabilities of enzyme-constrained genome-scale metabolic models (ecModels) [7]. Defining the pipeline's objective is a critical first step, as it establishes a rational framework for in silico strain design, moving beyond random discovery and toward predictable, systematic engineering. This protocol outlines the definition of this objective within the ecFactory framework, detailing the necessary inputs, computational procedures, and validation steps required to generate a robust list of candidate gene targets.
Key Concepts and Definitions
The ecFactory Framework
The ecFactory method is a series of sequential steps for the identification of metabolic engineering gene targets. Its objective is to output specific gene targets indicating which genes should be overexpressed, knocked down, or knocked out to increase the production of a given target metabolite. This is achieved by combining the FSEOF algorithm with the enhanced predictive power of ecModels [7]. Unlike standard Genome-Scale Metabolic Models (GEMs), ecModels incorporate enzyme kinetics and abundance as additional constraints, narrowing the solution space and yielding more physiologically realistic predictions of metabolic flux [17].
Types of Genetic Interventions
- Overexpression: Increasing the expression level or activity of a gene product to amplify a desired metabolic flux.
- Knock-down: Partially reducing the expression or activity of a gene product to modulate a metabolic pathway without completely disrupting it.
- Knock-out: Completely eliminating the activity of a gene product to disrupt a competing or non-essential metabolic pathway.
Materials and Experimental Protocols
Research Reagent Solutions and Essential Materials
Table 1: Essential Research Reagents and Computational Tools for the ecFactory Pipeline
| Item Name | Function/Description | Example/Reference |
|---|---|---|
| Genome-Scale Model (GEM) | A computational reconstruction of an organism's metabolism, containing gene-protein-reaction (GPR) associations. | Yeast8, Yeast9 [17] |
| Enzyme-constrained Model (ecModel) | A GEM enhanced with enzyme kinetic parameters and capacity constraints, providing more accurate flux predictions. | ecYeastGEM [7] |
| MATLAB | A high-level programming and numerical computing platform used to execute the ecFactory algorithm. | MATLAB 7.3 or higher [7] |
| ecFactory Scripts | The core computational scripts that implement the multi-step analysis, available via a public repository. | GitHub: SysBioChalmers/ecFactory [7] |
| Physiological Data | Experimentally determined parameters, such as substrate uptake rates and specific growth rates, to constrain the model. | |
| Omics Data (Optional) | Transcriptomic or proteomic data used to generate context-specific models for more personalized predictions. | [17] |
Protocol: Defining the Prediction Objective for Gene Targets
This protocol details the steps to define the objective for gene target prediction, which serves as the foundation for the ecFactory pipeline.
Input and Prerequisites
- Base Metabolic Model: Obtain a high-quality, curated GEM for your host organism (e.g., S. cerevisiae). The model must include GPR associations [17].
- Target Metabolite: Define the metabolite for which production is to be maximized. This is the enforced objective.
- Physiological Constraints: Gather data on the cultivation environment, including the carbon source and its uptake rate, and the organism's specific growth rate.
- Enzyme Kinetics Data: Collect data on enzyme turnover numbers ((k_{cat})) and, if available, measured enzyme abundances to generate the ecModel [17].
Procedure
Step 1: Develop the Enzyme-Constrained Model (ecModel)
- Action: Convert the base GEM into an ecModel by incorporating enzyme-related constraints. This involves defining the molecular weight of each enzyme and applying the associated (k_{cat}) values to their corresponding reactions.
- Rationale: This step introduces a proteomic limitation to the system, preventing the model from predicting unrealistically high fluxes that the cell's protein synthesis machinery cannot support [17].
- Output: An ecModel (e.g., ecYeastGEM) ready for simulation under enzyme capacity constraints.
Step 2: Apply the FSEOF Algorithm on the ecModel
- Action:
- Simulate the ecModel under baseline conditions to establish a reference state for growth and metabolite production.
- Systematically enforce a gradually increasing flux through the reaction(s) leading to the synthesis of the target metabolite.
- At each step of enforced production, scan the entire metabolic network and record the fluxes of all other reactions.
- Rationale: FSEOF identifies reactions whose flux changes concordantly with the enforced objective. Reactions whose fluxes increase are potential overexpression targets, while those that decrease or carry a negative flux are potential knock-down or knock-out targets [7].
- Output: A list of reactions and their associated genes, ranked by the correlation of their flux response to the enforced production objective.
Step 3: Classify and Prioritize Gene Targets
- Action: Interpret the FSEOF output to classify targets by intervention type.
- Overexpression Targets: Genes associated with reactions that show a significant, steady increase in flux as target production is enforced.
- Knock-down/Knock-out Targets: Genes associated with reactions that divert flux away from the target product (e.g., competing pathways) or that are non-essential under the production conditions.
- Rationale: This step translates raw flux data into a concrete genetic engineering strategy.
- Output: A final, prioritized list of gene targets for each type of genetic intervention.
Validation and Output
- Output: The primary output is a table of candidate gene targets, specifying the gene name, recommended intervention (overexpression, knock-down, knock-out), and a confidence metric (e.g., flux change magnitude).
- Validation: The predictions should be validated in vivo. A subset of the top-predicted targets (e.g., 3-5 genes) is selected for genetic modification in the host organism, followed by fermentation experiments to measure the resulting production titers, yields, and rates of the target metabolite [7].
Workflow Diagram
The following diagram illustrates the logical flow and key decision points for defining the pipeline's objective within the ecFactory framework.
Diagram 1: Logical workflow for defining the gene target prediction objective in the ecFactory pipeline.
Application Notes and Case Studies
Case Study: Prediction of Gene Targets for 2-Phenylethanol Production inS. cerevisiae
A practical application of this protocol is demonstrated in a case study for increasing the production of 2-phenylethanol in S. cerevisiae.
- Objective: Defined as "predict gene targets for increased production of 2-phenylethanol."
- Implementation: The ecFactory method was executed using the ecYeastGEM model within MATLAB.
- Outcome: The pipeline successfully generated a list of gene targets for overexpression, knock-down, and knock-out. The detailed results of this case study, including the specific genes identified, are available in the ecFactory repository's tutorial, providing a template for applying the protocol to other target metabolites [7].
Integration with Advanced Modeling and AI
The core objective of the ecFactory pipeline can be further refined by integrating with advanced computational approaches. The field is moving toward the deep integration of mechanistic metabolic models with artificial intelligence (AI). Machine learning models can help refine the reconstruction of functional metabolic models and provide alternative data-driven solutions for strain design [18]. For instance, AI can be used to predict the outcomes of complex genetic interactions or to optimize the selection of targets from the candidate list generated by ecFactory, thereby enhancing the overall success rate of the engineering cycle.
Troubleshooting and Best Practices
Table 2: Common Issues and Solutions in Defining the Pipeline Objective
| Problem | Potential Cause | Solution |
|---|---|---|
| Model fails to producethe target metabolite. | Gaps in the metabolic network; missing biochemical reactions. | Manually curate the model to add missing pathways or use tools like RAVEN or CarveFungi for automated draft reconstruction [17]. |
| FSEOF yields anunmanageably large list of targets. | The objective function or constraints are too permissive. | Apply stricter constraints on growth or substrate uptake. Prioritize targets based on the magnitude of their flux response. |
| Model predictions do notmatch experimental validation. | Inaccurate enzyme kinetic parameters ((k_{cat}) values). | Refine the ecModel with more organism-specific enzyme kinetic data from databases or literature. |
| Difficulty in classifyingknock-down vs. knock-out targets. | Ambiguous flux distributions in the model. | Analyze flux variability and essentiality. Genes whose knockout is predicted to be lethal should be considered for knock-down instead. |
The Critical Need for Computational Prediction in Streamlining Metabolic Engineering
Metabolic engineering aims to construct efficient microbial cell factories for the sustainable production of fuels, chemicals, and pharmaceuticals. However, the traditional design-build-test-learn (DBTL) cycle remains time-consuming and costly, often relying on trial-and-error approaches. The integration of computational predictions has emerged as a critical strategy to streamline this process by rapidly identifying promising genetic modifications and prioritizing experimental efforts [24]. Computational pipelines, particularly those leveraging genome-scale metabolic models, have revolutionized our ability to predict gene targets for enhanced chemical production, dramatically accelerating the development of industrial biotechnology.
The ecFactory method represents a significant advancement in this field, providing a systematic framework for predicting metabolic engineering targets. This multi-step approach combines the principles of Flux Scanning with Enforced Objective Function (FSEOF) with enzyme-constrained metabolic models (ecModels) that incorporate proteomic limitations into metabolic networks [7]. By bridging the gap between genetic modifications and phenotypic outcomes, such computational approaches enable researchers to navigate the vast combinatorial space of possible engineering strategies with unprecedented efficiency.
Computational Framework and Methodology
The ecFactory Pipeline: Core Architecture
The ecFactory method operates through a sequential computational workflow designed to identify optimal gene manipulation targets—including overexpression, knockdown, and knockout candidates—for maximizing the production of target metabolites. Built upon constraint-based modeling principles, ecFactory integrates enzyme kinetics and thermodynamic constraints to generate biologically realistic predictions [7].
The foundational algorithm implements a series of constraints that mimic cellular resource allocation:
- Stoichiometric constraints: Govern mass-balance relationships in metabolic reactions
- Enzyme capacity constraints: Limit metabolic fluxes by enzyme abundance and catalytic capacity
- Thermodynamic constraints: Ensure the feasibility of metabolic pathways based on energy landscapes
This multi-layered constraint system enables more accurate prediction of metabolic behavior under genetic perturbations, significantly reducing false positives in target identification.
Advanced Algorithmic Extensions
Recent innovations have further enhanced the predictive capabilities of computational metabolic engineering. The ET-OptME framework systematically incorporates both enzyme efficiency and thermodynamic feasibility constraints into genome-scale metabolic models, addressing critical limitations of purely stoichiometric approaches [24]. This integrated method demonstrates substantial improvements in prediction accuracy, achieving at least a 70% increase in minimal precision and 47% increase in accuracy compared to enzyme-constrained algorithms alone [24].
Another innovative approach treats enzymes as microcompartments within metabolic network models, resolving conflicts between stoichiometric and other constraints by preventing unrealistic assumptions of free intermediate metabolites [26]. This compartmentalization strategy corrects pathway structures and reveals essential trade-offs between product yield and thermodynamic feasibility, providing more reliable engineering blueprints.
Figure 1: Computational Workflow Integrating Multiple Constraints. The pipeline begins with core metabolic models and progressively layers enzyme and thermodynamic constraints to identify high-confidence engineering targets.
Performance Metrics and Validation
Quantitative Assessment of Prediction Accuracy
Computational pipelines for metabolic engineering target prediction have demonstrated remarkable performance across diverse host organisms and target compounds. Quantitative evaluations reveal that advanced algorithms significantly outperform traditional stoichiometric methods in both precision and biological relevance.
Table 1: Performance Comparison of Computational Prediction Methods
| Method | Key Features | Prediction Accuracy Improvement | Validation Host | Chemical Targets |
|---|---|---|---|---|
| ecFactory | Integrates FSEOF with enzyme constraints | High-confidence targets for 103 chemicals | S. cerevisiae | 2-phenylethanol, heme [27] [7] |
| ET-OptME | Layers enzyme efficiency & thermodynamic constraints | 70-292% increase in precision vs. previous methods | C. glutamicum | 5 product targets [24] |
| Enzyme-as-Microcompartment | Resolves constraint conflicts via compartmentalization | Corrects pathway structures for thermodynamic feasibility | E. coli | l-serine, l-tryptophan [26] |
Large-Scale Target Identification
The ecFactory pipeline exemplifies the scale and efficiency of modern computational approaches, enabling simultaneous prediction of engineering targets for 103 different chemicals using Saccharomyces cerevisiae as a host organism [27]. This systematic mapping of metabolic engineering strategies across diverse chemical spaces demonstrates the powerful scalability of computational prediction platforms. Furthermore, the identification of gene target sets predicted for multiple chemical groups suggests the feasibility of rationally designing platform strains for diversified chemical production, potentially revolutionizing industrial bioprocess development [27].
Essential Research Reagents and Computational Tools
Successful implementation of computational prediction pipelines requires specialized software tools and research reagents for experimental validation. The following resources represent core components of the metabolic engineering workflow.
Table 2: Essential Research Reagents and Computational Tools
| Item | Function/Purpose | Implementation Details |
|---|---|---|
| MATLAB | Core computational environment for running ecFactory | Version 7.3 or higher required [7] |
| ecModel Database | Enzyme-constrained genome-scale metabolic models | ecYeastGEM for S. cerevisiae applications [7] |
| Cre-Lox System | Precise large-scale DNA manipulation | PCE/RePCE systems for kilobase to megabase edits [28] [29] |
| AiCErec | AI-guided recombinase engineering | Enhances recombination efficiency 3.5-fold [29] |
| Re-pegRNA | Scarless editing strategy | Removes residual recombination sites [29] |
Experimental Protocol: From Prediction to Validation
Gene Target Prediction Using ecFactory
Objective: Identify metabolic engineering targets for enhanced production of 2-phenylethanol in S. cerevisiae using the ecFactory computational pipeline.
Procedure:
- Software Setup: Install MATLAB (v7.3 or higher) and clone the ecFactory repository from GitHub into an accessible directory.
- Model Preparation: Load the ecYeastGEM model, an enzyme-constrained version of the yeast genome-scale metabolic model.
- Target Metabolite Specification: Define 2-phenylethanol as the target metabolite with appropriate exchange reaction identification.
- Constraint Application:
- Apply stoichiometric constraints to maintain mass balance
- Integrate enzyme capacity constraints based on catalytic rates
- Enforce thermodynamic constraints to eliminate infeasible flux directions
- FSEOF Implementation: Execute Flux Scanning with Enforced Objective Function to identify fluxes that increase with enforced production of 2-phenylethanol.
- Target Prioritization: Rank candidate genes based on flux response coefficients and enzyme usage costs.
- Output Generation: Save predicted gene targets for overexpression, knockdown, and knockout in the results directory [7].
Troubleshooting Tip: If the model fails to converge, verify that all enzyme constraints are properly defined and that the target metabolite can be produced by the network under baseline conditions.
Experimental Validation of Predicted Targets
Objective: Implement and validate genetic modifications predicted by ecFactory for enhanced 2-phenylethanol production.
Procedure:
- Strain Construction:
- For gene overexpression: Amplify target genes with strong promoters (e.g., TEF1, ADH1) using PCR and clone into yeast expression vectors.
- For gene knockouts: Design CRISPR-Cas9 guide RNAs targeting identified non-essential genes and transform into yeast with Cas9 expression cassette.
- Transformation: Introduce DNA constructs into S. cerevisiae using lithium acetate/single-stranded carrier DNA/polyethylene glycol (LiAc/SS-DNA/PEG) method.
- Fermentation: Inoculate engineered strains in selective medium and monitor growth and metabolite production under controlled bioreactor conditions.
- Product Quantification:
- Extract metabolites at mid-logarithmic growth phase
- Analyze 2-phenylethanol concentration using gas chromatography-mass spectrometry (GC-MS)
- Compare titers, yields, and productivities between engineered and control strains
- Data Integration: Compare experimental results with computational predictions to refine model parameters and identify additional optimization targets [27] [7].
Figure 2: DBTL Cycle with Computational Prediction. The integrated workflow begins with computational modeling, proceeds through genetic implementation and experimental validation, and concludes with model refinement based on experimental data.
The integration of computational prediction into metabolic engineering represents a paradigm shift in biological design. Future advancements will likely focus on multi-omics integration, machine learning enhancement of model parameters, and automated strain construction technologies. The emerging ability to perform precise large-scale chromosomal manipulations using technologies like Programmable Chromosome Engineering (PCE) systems will further accelerate the implementation of complex metabolic engineering strategies [28] [29].
Computational prediction has transformed metabolic engineering from an artisanal practice to a systematic discipline capable of tackling global challenges in sustainable manufacturing. As these tools continue to evolve in sophistication and accessibility, they will undoubtedly play an increasingly critical role in streamlining the development of microbial cell factories for bio-based production of valuable chemicals, fuels, and pharmaceuticals.
A Step-by-Step Guide to Implementing the ecFactory Pipeline
In the context of the ecFactory computational pipeline for gene target prediction, robust management of MATLAB and ecModel dependencies is critical for ensuring research reproducibility, computational efficiency, and accurate simulation outcomes. Dependencies encompass all user-created files, data, and external toolboxes that influence simulation results, including MATLAB scripts, functions, data files, and specialized toolboxes like SimBiology. Proper dependency management prevents invalid simulation results when rebuilding model reference targets and is essential when distributing research pipelines across teams or computational environments. The ecFactory framework for predicting gene targets relies heavily on precise mathematical modeling of metabolic systems, where unmanaged dependencies can introduce significant errors in target identification and validation.
Core MATLAB Dependency Analysis Tools and Methods
Types of Model Dependencies
MATLAB and Simulink models recognize two primary categories of dependencies relevant to ecModel workflows. Known target dependencies are files and data external to model files that the software automatically identifies and examines for changes when checking if a model reference target is up to date. These include referenced models, linked libraries, enumerated type definitions, user-written S-functions with their TLC files, and external files used by Stateflow, MATLAB Function blocks, or MATLAB System blocks [30]. User-created dependencies represent files that the software cannot automatically identify, regardless of their potential impact on simulation results. This category includes MATLAB scripts and functions (.m) containing code executed by callbacks, custom data files, and configuration scripts that parameterize ecModels [30]. For the ecFactory pipeline, this distinction is crucial as gene expression data, constraint parameters, and kinetic rate functions typically fall into the user-created dependency category.
Dependency Identification Techniques
Several methodological approaches exist for identifying program dependencies in MATLAB ecosystems. The inmem function provides a simple display of all program files referenced by a particular function after execution. For a more detailed analysis, the matlab.codetools.requiredFilesAndProducts function identifies both dependent program files and required MathWorks products [31]. The most comprehensive approach utilizes the Dependency Analyzer, which graphically examines models, subsystems, and libraries referenced directly or indirectly by a model, producing dependency graphs that identify all required files and products [32]. For ecModel workflows, a combination of these methods is recommended to capture the full spectrum of computational dependencies from high-level toolboxes to low-level data files.
Table 1: MATLAB Dependency Analysis Tools Comparison
| Tool/Method | Key Capabilities | Output Format | Best Use Cases |
|---|---|---|---|
inmem |
Lists program files in memory after execution | Text list | Quick dependency check during active development |
matlab.codetools.requiredFilesAndProducts |
Identifies program files and required MathWorks products | Cell arrays of files and products | Validating platform requirements before distribution |
| Dependency Analyzer | Comprehensive graphical analysis of file relationships | Interactive dependency graph | Complete pipeline documentation and project creation |
Experimental Protocols for Dependency Management
Protocol 1: Comprehensive Dependency Analysis for ecModels
This protocol describes a standardized methodology for identifying and documenting dependencies within ecModel architectures for gene target prediction.
Materials and Software Requirements
- MATLAB R2020b or newer with SimBiology toolbox
- Simulink installation for model reference hierarchies
- Dependency Analyzer tool access
- ecModel source files and associated data
Procedure
- Initial Setup: Clear all functions from memory using
clear functionscommand. Unlock any persistently locked functions usingmunlockto ensure complete dependency detection [31]. - Execute Model Workflow: Run the complete ecModel simulation with representative input parameters that exercise all code pathways. Different function arguments may reveal different dependencies.
- Dependency Analysis: Open the Dependency Analyzer from the MATLAB Apps tab under the MATLAB section. Click the "Open Folder" button and select the primary ecModel directory [31].
- Graph Configuration: Select appropriate view options based on analysis needs. The "Model Hierarchy" view shows each referenced file once, while "Model Instances" shows every reference to a model in the hierarchy [32].
- Product Identification: Clear all selections in the dependency graph to view required MathWorks products and add-ons for the entire design in the Properties pane [32].
- Export Results: Export dependency analysis results using "Export to Workspace" for programmatic access, "Generate Dependency Report" for documentation, or "Create Project" to package the complete design [32].
Troubleshooting Notes
- If dependencies appear incomplete, execute
Analyze > Reanalyze Allin the Dependency Analyzer for a complete analysis. - Protected models (.slxp files) will appear as dark red boxes but cannot be inspected internally [32].
- Dependencies introduced through conditional code paths might require multiple executions with different parameters for complete detection.
Protocol 2: Specifying Model Dependencies for Reproducible Builds
This protocol ensures accurate rebuild detection when ecModel configuration parameters are set to rebuild based on dependency changes.
Configuration Steps
- Access the Configuration Parameters dialog for the referenced model by selecting the Model Settings arrow from the Modeling tab, then choosing "Model Settings" in the Referenced Model section [30].
- Enable the "Model dependencies" parameter by setting "Total number of instances allowed per top model" to "One" or "Multiple" [30].
- Specify dependencies as a character vector or cell array of character vectors, including file names, paths to dependent files, or folders. Use the
$MDLtoken to indicate paths relative to the model file location [30]. - Apply the configuration and verify by simulating the model after modifying dependent files to ensure proper rebuild detection.
Example Implementation
Table 2: ecModel Dependency Specification Patterns
| Dependency Type | Specification Format | Example | Notes |
|---|---|---|---|
| Local data file | $MDL\filename.ext |
$MDL\kineticConstants.mat |
Path relative to model file |
| Absolute path file | Full path string | 'C:\Data\transcriptomics.csv' |
Platform-specific, reduces portability |
| Wildcard inclusion | *.ext |
'..\utils\*.m' |
Includes all matching files in folder |
| Folder dependency | Folder path | 'D:\Project\helperFunctions\' |
All files in folder are treated as dependencies |
Visualization of ecModel Dependency Workflows
ecModel Dependency Analysis Workflow
ecModel Dependency Relationships
The Scientist's Toolkit: Research Reagent Solutions
Table 3: Essential Research Reagents and Computational Tools for ecModel Development
| Tool/Reagent | Function/Purpose | Implementation Example | Dependency Type |
|---|---|---|---|
| SimBiology Toolbox | Modeling and simulation of biological systems | Creating ODE-based metabolic models for gene target validation | MathWorks Product |
| Dependency Analyzer | Visualization and analysis of file dependencies | Identifying all required files for ecModel simulation | MATLAB Built-in Tool |
| txtlsim Toolbox | Prototyping genetic circuits in TX-TL systems | Modeling transcription-translation mechanisms in metabolic networks [33] | Third-party Toolbox |
| Parameter Estimation Functions (lsqcurvefit) | Fitting model parameters to experimental data | Estimating kinetic constants from metabolic time-series data [34] | MATLAB Optimization Toolbox |
| Gene Expression Data Files | Input data for constraint-based modeling | Providing transcriptomic constraints for ecModel simulations | User-created Data |
| Model Configuration Scripts | Automated model setup and parameterization | Standardized initialization of ecModel simulation conditions | User-created Dependency |
| Metabolic Database Files | Repository of known metabolic reactions and compounds | Validating predicted metabolic pathways in target identification | External Database |
Within the broader thesis on computational pipeline ecFactory prediction gene targets research, this document serves as a detailed application note and protocol. The ecFactory method is a multi-step, sequential computational pipeline designed for the identification of metabolic engineering gene targets. These targets indicate which genes should be overexpressed, knocked down, or knocked out to increase the production of a desired metabolite [7]. This protocol details the entire workflow, from curating the initial model to generating a finalized list of high-priority gene targets, providing researchers and drug development professionals with a reproducible framework for target discovery.
Experimental Protocols and Methodologies
Model Curation and Preparation
The ecFactory method is built upon the principles of the FSEOF (Flux Scanning with Enforced Objective Function) algorithm but incorporates them into the framework of GECKO (Enzyme-Constrained) genome-scale metabolic models (ecModels). ecModels extend traditional stoichiometric models by explicitly incorporating enzyme kinetics and capacity constraints, leading to more realistic predictions of metabolic fluxes [7].
Required Software and Reagents:
- Software: A functional MATLAB installation (version 7.3 or higher) is required. The ecFactory repository must be cloned from its GitHub source to a local directory [7].
- Model: A genome-scale metabolic model for the organism of interest (e.g., S. cerevisiae). The corresponding ecModel (e.g., ecYeastGEM) is required to implement enzyme constraints.
Procedure:
- Model Selection: Obtain a high-quality, community-vetted genome-scale metabolic model (GEM) for your target organism.
- Integration of Enzyme Constraints: Convert the standard GEM into an enzyme-constrained model (ecModel) using the GECKO methodology. This involves:
- Adding enzyme metabolites and reactions to the model.
- Defining enzyme usage constraints based on measured enzyme turnover numbers (( k_{cat} )) and protein abundance data.
- Model Validation: Simulate baseline growth and metabolite production under defined conditions to ensure the ecModel accurately recapitulates known physiology.
Target Identification via the ecFactory Pipeline
The core of the workflow involves executing the ecFactory script, which operates through a series of sequential steps [7].
Procedure:
- Define the Objective: Specify the target metabolite for overproduction in the ecFactory script.
- Enforce Flux Objective: The pipeline applies the FSEOF principle by systematically enforcing a gradual increase in the flux through the reaction(s) leading to the target metabolite. This is done while simulating growth under steady-state conditions.
- Flux Scanning: At each step of enforced product flux, the pipeline scans the entire metabolic network to identify reactions whose flux changes significantly.
- Target Gene Ranking: Reactions whose fluxes consistently increase or decrease with the enforced objective flux are identified. The corresponding genes associated with these reactions are shortlisted as potential overexpression or knockdown targets, respectively.
- Integration of omics Data (Optional): For enhanced context-specificity, transcriptomic data from relevant strains or conditions can be integrated. This helps to refine the target list by prioritizing genes that are expressed under the conditions of interest. A similar approach, integrating transcriptomic and drug vulnerability data, has been successfully used in other computational pipelines for target discovery [35] [36].
Validation of Predicted Gene Targets
Computational Validation:
- Flux Impact Analysis: Simulate the effect of the proposed genetic modifications (e.g., gene knockout) on both biomass formation and product yield to ensure viability and efficacy.
- Essentiality Checks: Cross-reference predicted knockdown or knockout targets with databases of essential genes to avoid non-viable interventions.
Experimental Validation (Case Study):
As a proof-of-concept, the ecFactory method was applied to predict gene targets for enhanced heme production in S. cerevisiae [7]. A subset of the top-ranked predicted gene targets was selected for wet-lab validation:
- Strain Engineering: S. cerevisiae strains were constructed with overexpression or knockdown of the predicted genes.
- Fermentation and Metabolite Analysis: The engineered strains were cultured under controlled conditions, and heme production was quantified using analytical methods such as High-Performance Liquid Chromatography (HPLC) or spectrophotometric assays.
- Comparison: The production titers from the engineered strains were compared to those of a wild-type control strain to validate the pipeline's predictions.
Data Presentation
Key Outputs from the ecFactory Pipeline
The primary output of the ecFactory pipeline is a ranked list of gene targets, categorized by the type of intervention suggested. The table below summarizes the type of data generated.
Table 1: Summary of ecFactory Pipeline Outputs
| Output Category | Description | Format |
|---|---|---|
| Target Gene List | A ranked list of genes identified for metabolic engineering. | Gene Identifier, Suggested Intervention (Overexpression/Knockdown/Knockout), Priority Score |
| Flux Profiles | Metabolic flux distributions for the wild-type and engineered networks. | Reaction ID, Wild-type Flux, Flux under Enforced Production |
| Intervention Impact | Predicted change in target metabolite yield and growth rate for each proposed modification. | Gene ID, Predicted % Yield Increase, Predicted Growth Rate |
Mandatory Visualization
Workflow Diagram
The following diagram illustrates the logical flow and key steps of the ecFactory computational pipeline.
Title: ecFactory Gene Target Prediction Workflow
ecModel Constraint Integration
This diagram details the core conceptual difference between a standard GEM and an enzyme-constrained model (ecModel).
Title: Standard GEM vs. Enzyme-Constrained Model (ecModel)
The Scientist's Toolkit
Table 2: Essential Research Reagent Solutions for ecFactory Implementation
| Item | Function in the Workflow |
|---|---|
| Genome-Scale Model (GEM) | A stoichiometric representation of the organism's metabolism, serving as the foundational blueprint for the entire pipeline (e.g., YeastGEM for S. cerevisiae). |
| GECKO Toolbox | A software toolbox used to convert a standard GEM into an enzyme-constrained model (ecModel) by incorporating enzyme-related constraints. |
| ecModel (e.g., ecYeastGEM) | The core analytical tool. An enzyme-constrained model that provides more realistic flux predictions by accounting for the proteomic cost of catalysis. |
| MATLAB Runtime Environment | The computational environment required to execute the ecFactory scripts and perform numerical simulations and linear programming optimization. |
| Cultivation Media Components | Chemically defined media for cultivating the model organism (e.g., S. cerevisiae) during the experimental validation phase of predicted gene targets. |
| Analytical Standards | Pure chemical standards of the target metabolite (e.g., 2-phenylethanol, heme) for use in quantification via HPLC or GC-MS during validation. |
This application note integrates recent multi-omics findings on Saccharomyces cerevisiae tolerance to 2-phenylethanol (2-PE) into the computational prediction pipeline ecFactory. By analyzing evolved 2-PE-resistant strains, we have identified key genetic targets and regulatory mechanisms that enhance 2-PE biosynthesis and tolerance. These targets provide a validated foundation for rational metabolic engineering strategies aimed at overcoming the intrinsic cytotoxicity of 2-PE, which currently limits its industrial-scale microbial production. The protocols and data summarized herein enable researchers to prioritize gene targets for strain engineering and design validation experiments that bridge computational predictions with laboratory outcomes.
Molecular Targets and Associated Mechanisms of 2-PE Tolerance
Table 1: Validated Genetic Targets for Enhanced 2-PE Production and Tolerance in S. cerevisiae
| Gene/Target | Type of Alteration | Proposed Mechanism | Observed Phenotypic Outcome | Citation |
|---|---|---|---|---|
| Pdr1p | Gain-of-function mutation (e.g., C862R) | Modulates amino acid metabolism; enhances Ehrlich pathway; alters sulfur metabolism & one-carbon pool. | 16% increase in 2-PE production; 54% higher growth under 3.5 g/L 2-PE stress. | [37] |
| HOG1 | Point mutation (phosphorylation lip) | Putative hyperactive MAPK; induces Environmental Stress Response (ESR) via Msn2/4p transcription factors. | ~3x higher tolerance (up to 3.4 g/L 2-PE); increased general stress resistance. | [38] |
| PDE2 | Missense mutation | Putative hyperactive cAMP phosphodiesterase; may lower cAMP levels, contributing to a stress-ready state. | Co-occurs with HOG1 mutation; contributes to heightened stress response. | [38] |
| CRH1 | Mutation in cell wall transglycosylase | Alters cell wall composition and remodeling. | Increased resistance to cell wall-degrading enzyme lyticase. | [38] |
| ALD3/ALD4 | Significant transcriptional upregulation | NAD+-dependent conversion of 2-PE to less toxic phenylacetate. | Proposed detoxification pathway; confers phenylacetate resistance. | [38] |
| Glycolytic Pathway Genes | Mutations in AFRC01 strain (vs. CICC33253) | Altered flux in glycolysis, potentially affecting phosphoenolpyruvate (2-PE precursor) supply. | 33% higher 2-PE production in strawberry wine fermentation. | [39] |
Experimental Protocols for Validation of 2-PE Tolerance and Production
Protocol: Adaptive Laboratory Evolution (ALE) for 2-PE Resistance
This protocol is adapted from the evolutionary engineering strategy used to develop a 2-PE-tolerant strain [38].
- Objective: To generate and select S. cerevisiae strains with enhanced tolerance to 2-phenylethanol.
- Materials:
- S. cerevisiae haploid reference strain (e.g., CEN.PK 113-7D).
- Yeast Minimal Medium (YMM): 20 g/L glucose, 6.7 g/L yeast nitrogen base without amino acids.
- 2-Phenylethanol (2-PE), sterile filtered.
- Ethyl methanesulfonate (EMS) for optional mutagenesis.
- Shaking incubator, centrifuge, spectrophotometer.
- Procedure:
- Optional Mutagenesis: Treat the initial population with EMS to achieve ~90% survival, generating genetic diversity [38].
- Inoculation: Inoculate the initial population into YMM containing a sub-lethal 2-PE concentration (e.g., 1.5 g/L). Start at an initial OD600 of 0.3.
- Successive Batch Culture: Incubate at 30°C with shaking (150 rpm) for 24-48 hours.
- Passaging: Centrifuge the culture, wash cells with fresh YMM, and reinoculate into fresh YMM with a slightly increased 2-PE concentration (e.g., 0.1 g/L increments).
- Monitoring: Maintain a parallel control passage in YMM without 2-PE to calculate survival rates.
- Selection: Continue passaging, increasing the 2-PE concentration as population growth allows. The process is typically continued over 50+ passages until a target tolerance (e.g., 3.4 g/L) is achieved [38].
- Isolation: Plate the final population on solid YMM to isolate single colonies for further characterization.
Protocol: Quantification of 2-PE via High-Performance Liquid Chromatography (HPLC)
This protocol is based on the analytical method used to optimize strawberry wine fermentation [39].
- Objective: To accurately measure the concentration of 2-PE in fermentation broth.
- Materials:
- HPLC system with UV detector (e.g., Agilent 1260).
- Reverse-phase C18 column (e.g., 4.6 x 150 mm, 2.7 μm).
- HPLC-grade methanol and water.
- Standard solutions of 2-PE (0.1 - 0.5 g/L).
- Sample filters (0.22 μm nylon membrane).
- Procedure:
- Sample Preparation: Centrifuge fermentation samples at 4,650× g for 10 min. Dilute the supernatant 10-fold with mobile phase and filter through a 0.22 μm membrane [39].
- HPLC Conditions:
- Mobile Phase: Isocratic elution with Methanol:Water (55:45, v/v).
- Flow Rate: 0.5 mL/min.
- Column Temperature: 30°C.
- Detection Wavelength: 260 nm.
- Injection Volume: 10 μL.
- Calibration: Create a standard curve using 2-PE standards (0.1, 0.2, 0.3, 0.4, 0.5 g/L). The typical standard curve equation is
y = 1279.4x - 0.6058(R² = 0.9994), where y is the peak area and x is the concentration in g/L [39]. - Analysis: Inject prepared samples and calculate the 2-PE concentration using the standard curve.
Integration into the ecFactory Computational Prediction Pipeline
The molecular data from Tables 1 and 2 can be integrated into the ecFactory pipeline to refine its predictive algorithms for 2-PE production. The following workflow diagrams this integration, from data ingestion to target validation.
Pathway-Level Analysis of 2-PE Stress Response
The transcriptional and metabolic changes in 2-PE-tolerant strains converge on specific cellular pathways. The KEGG pathway analysis reveals consistent adaptations, which should be used to weight predictions within ecFactory.
Table 2: Key Metabolic Pathways Altered in 2-PE-Tolerant S. cerevisiae Strains
| KEGG Pathway | Proposed Role in 2-PE Tolerance | Supporting Evidence |
|---|---|---|
| Sulfur Metabolism / Cysteine Metabolism | Attenuated sulfur metabolism may reduce oxidative stress; cysteine is a potential biomarker. | Significant enrichment in Pdr1p mutant; 31% decrease in free amino acids pool [37]. |
| One-Carbon Pool by Folate | Supports redox balance and nucleotide synthesis under stress. | Co-enriched with sulfur metabolism in Pdr1p mutant [37]. |
| Ehrlich Pathway | Primary route for 2-PE biosynthesis from L-phenylalanine. | Enhanced expression in Pdr1p mutant; key target for metabolic engineering [37] [40]. |
| Amino Acid Metabolism | Major rewiring of amino acid pools to counteract 2-PE-induced nutrient uptake inhibition. | Central finding in Pdr1p and HOG1 mutants; connects multiple altered pathways [41] [37] [38]. |
| Glycolysis / TCA Cycle | Altered central carbon metabolism affects precursor (phosphoenolpyruvate) availability. | Transcriptomic changes in S. cerevisiae 31; genomic mutations in AFRC01 strain [41] [39]. |
| ABC Transporters | Potential export of 2-PE or other toxic compounds. | Enrichment in Pdr1p mutant, consistent with its known role as a multidrug-resistant transcription factor [37]. |
The following diagram synthesizes the primary and detoxification pathways for 2-PE in the context of the identified genetic targets.
The Scientist's Toolkit: Research Reagent Solutions
Table 3: Essential Reagents and Materials for 2-PE Research
| Item | Function/Application | Example/Notes |
|---|---|---|
| S. cerevisiae CEN.PK 113-7D | Prototrophic haploid reference strain for evolutionary engineering and genetic studies. | Used as base strain in ALE studies for its well-defined genetic background [38]. |
| S. cerevisiae AFRC01 | 2-PE-tolerant evolved strain (tolerates 3.9 g/L). | Used for process optimization; provides genomic insights via comparison with parent CICC33253 [39]. |
| Yeast Minimal Medium (YMM) | Defined medium for selection experiments and controlled physiological studies. | 20 g/L glucose, 6.7 g/L yeast nitrogen base without amino acids [38]. |
| Microbial Microdroplet Culture (MMC) System | High-throughput platform for adaptive evolution and strain screening. | Used to isolate S. cerevisiae AFRC01 via continuous subculture under 2-PE pressure [39]. |
| C18 Reverse-Phase HPLC Column | Analytical separation and quantification of 2-PE from fermentation broth. | Standard method for 2-PE quantification; used with methanol/water mobile phase [39]. |
| RNA-Seq Reagents & Platform | Transcriptomic analysis to identify global gene expression changes under 2-PE stress. | Key technology for uncovering mechanisms in Pdr1p and HOG1 mutants [37] [38]. |
Application in Industrial Strain and Bioprocess Optimization
The predicted and validated targets directly inform strategies for industrial 2-PE production. The Pdr1p gain-of-function mutation is a prime candidate for rational engineering, as it confers both higher tolerance and increased production [37]. Furthermore, the HOG1 and ALD3/4 targets provide alternative routes for constructing robust chassis strains.
Process optimization using evolved strains like AFRC01 has demonstrated the commercial viability of these findings, achieving a 33% increase in 2-PE content in strawberry wine fermentation [39]. This demonstrates a direct translation from gene-level discovery to improved product output, validating the utility of these targets within the ecFactory pipeline for guiding the engineering of microbial cell factories.
This application note details the experimental validation of computational gene targets predicted for enhancing heme biosynthesis in Saccharomyces cerevisiae. The work is situated within a broader thesis research project employing the ecFactory pipeline, a multi-step method that leverages enzyme-constrained genome-scale metabolic models (ecModels) like ecYeastGEM to identify metabolic engineering targets for overproduction [7]. Heme, an iron-containing porphyrin, is a vital cofactor for hemoproteins with applications across the food (e.g., plant-based meat), pharmaceutical, and biocatalysis industries [42] [43]. However, native heme production in yeast is low, constrained by pathway compartmentalization between the mitochondria and cytosol, stringent cellular regulation, and the accumulation of toxic intermediates [43] [44]. This document provides a consolidated resource of validated quantitative data, detailed protocols, and visual workflows to enable researchers to replicate and build upon these strain engineering strategies.
Computational Prediction of Gene Targets via ecFactory
The ecFactory method integrates the principles of Flux Scanning with Enforced Objective Function (FSEOF) with the enhanced predictive capabilities of enzyme-constrained models [7]. The following workflow delineates the key stages from in silico prediction to experimental strain construction.
Workflow: From In Silico Prediction to Engineered Strain
The diagram below outlines the core computational and experimental pipeline.
Key Computationally Predicted Gene Targets
Based on genome-scale modeling with ecYeast8, 84 gene targets were identified as potentially beneficial for heme production [45]. Empirical testing of 76 of these targets confirmed 40 that individually increased heme titers. The table below summarizes the primary categories of these validated gene targets.
Table 1: Key Categories of Computationally Predicted Gene Targets for Heme Enhancement in S. cerevisiae
| Target Category | Specific Gene Examples | Rationale for Engineering |
|---|---|---|
| Heme Biosynthesis | HEM1, HEM2, HEM3, HEM12, HEM13, HEM14, HEM15 |
Overexpression of rate-limiting enzymes to alleviate pathway bottlenecks and increase metabolic flux [42] [45]. |
| Heme Degradation | HMX1 |
Gene knockout to prevent the breakdown of heme, thereby increasing its net accumulation [42] [45]. |
| Precursor Supply | SHM1, GCV1, GCV2, LSC1 |
Engineering to enhance the supply of succinyl-CoA and glycine for 5-aminolevulinic acid (ALA) synthesis [45]. |
| Iron Metabolism | FET4 |
Overexpression to improve cellular iron uptake, as iron is an essential component of heme [45]. |
Experimental Protocols & Validation
This section provides detailed methodologies for constructing and characterizing high-heme yeast strains, based on published studies that implemented computational predictions.
Protocol: CRISPR-Cas9 Mediated Strain Construction
The following protocol is adapted from studies that constructed complex multi-gene edits in industrial S. cerevisiae [42] [45].
A. Materials and Reagents
- Strain: S. cerevisiae KCCM 12638 (industrial whisky strain) or other suitable background [42].
- Plasmids: CRISPR-Cas9 plasmid (e.g., pCAS series) containing a yeast-optimized Cas9 and guide RNA (gRNA) expression cassette.
- DNA Templates: Double-stranded DNA or long single-stranded DNA fragments containing the overexpression cassette (e.g., strong constitutive TEF1 or GPD promoter, gene coding sequence, strong terminator) or a marker gene for knockouts. Homology arms (40-80 bp) flanking the target site are essential.
- Enzymes & Kits: Restriction enzymes, T4 DNA Ligase, PCR purification kit, gel extraction kit, yeast transformation kit (e.g., LiAc/SS Carrier DNA/PEG method).
- Media: YPD (Yeast Extract-Peptone-Dextrose) for routine growth, appropriate synthetic dropout media for selection (e.g., SC-Ura, SC-Leu), YP40D (40 g/L Yeast Extract, 20 g/L Peptone, 50 g/L Glucose) for heme production assays [42].
B. Step-by-Step Procedure
- gRNA Design and Cloning: Design gRNAs to target the genomic loci of interest (e.g., safe-harbor site for gene integration, or near the start codon of a gene to be knocked out). Clone the annealed oligonucleotides encoding the gRNA into the CRISPR-Cas9 plasmid.
- Donor DNA Preparation: Amplify the donor DNA fragments via PCR. For gene knockouts (e.g.,
HMX1), a donor DNA containing a selectable marker (e.g.,HIS3,URA3) flanked by homology arms is used. For gene integrations, the donor is the overexpression cassette. - Yeast Transformation: Co-transform the S. cerevisiae host strain with the CRISPR-Cas9 plasmid and the purified donor DNA fragment(s) using a high-efficiency lithium acetate protocol.
- Selection and Screening: Plate the transformation mixture onto appropriate synthetic dropout media to select for cells that have taken up the CRISPR plasmid and the donor DNA. Incubate at 30°C for 2-3 days.
- Colony PCR Verification: Screen individual colonies by colony PCR using primers that bind outside the homology arms to verify correct genomic integration.
- Curing the CRISPR Plasmid: To enable subsequent rounds of editing, streak verified colonies onto YPD media without selection for ~3 generations to lose the plasmid. Confirm plasmid loss by patching colonies onto selective and non-selective media.
- Iterative Engineering: Repeat steps 1-6 for each subsequent genetic modification. The final engineered strain from one study was: IMX581-HEM15-HEM14-HEM3-Δshm1-HEM2-Δhmx1-FET4-Δgcv2-HEM1-Δgcv1-HEM13 [45].
Protocol: Heme Quantification Assay
Accurate measurement of intracellular heme is critical for evaluating engineering outcomes.
A. Materials and Reagents
- Solution A: 2 M Oxalic Acid.
- Solution B: 2 M Hydrochloric Acid (HCl).
- Standard: Hemin (e.g., from bovine source) for generating a standard curve.
- Equipment: Spectrofluorometer or plate reader, heat block or water bath, centrifuge, glass test tubes or a quartz microplate.
B. Step-by-Step Procedure
- Cell Harvest and Wash: Grow the engineered and control strains in 5 mL of optimized production medium (e.g., YP40D) for 72 hours. Harvest cells by centrifugation (e.g., 3000 × g, 5 min). Wash the cell pellet with 1 mL of deionized water.
- Heme Extraction: Resuspend the cell pellet in 1 mL of a 1:1 (v/v) mixture of Solution A (2 M Oxalic Acid) and Solution B (2 M HCl). Incubate the suspension in a heating block at 100°C for 30 minutes.
- Cooling and Clarification: Allow the samples to cool to room temperature. Centrifuge at 10,000 × g for 10 minutes to remove cell debris.
- Fluorescence Measurement: Transfer the supernatant to a quartz cuvette or plate. Measure the fluorescence (excitation: 400 nm, emission: 662 nm).
- Data Analysis: Generate a standard curve using known concentrations of hemin (0–10 µM) processed identically to the samples. Calculate the heme concentration in the samples from the standard curve and normalize to the optical density (OD600) or dry cell weight of the original culture.
Quantitative Results of Engineering Strategies
The table below consolidates key performance data from various metabolic engineering strategies applied to S. cerevisiae for heme overproduction.
Table 2: Summary of Heme Production Outcomes in Engineered S. cerevisiae Strains
| Engineering Strategy | Strain Description / Key Genetic Modifications | Heme Titer (Batch Fermentation) | Fold Improvement vs. Wild-Type | Citation |
|---|---|---|---|---|
| Systematic Gene Targeting | IMX581-HEM15-HEM14-HEM3-Δshm1-HEM2-Δhmx1-FET4-Δgcv2-HEM1-Δgcv1-HEM13 | Not explicitly stated (70-fold increase in intracellular heme) | 70-fold | [45] |
| Pathway Compartmentalization | Mito-H4 strain (Mitochondrial relocation of HEM2, HEM3, HEM4, HEM12) | 4.5 mg/L | 3.0-fold | [44] |
| CPD Pathway Introduction | H4+MTS9HemQCg+GroELS (Mitochondrial PPD + CPD pathways with chaperonins) | 4.6 mg/L | 17% vs. Mito-H4 strain | [44] |
| Industrial Strain Engineering | KCCM 12638 ΔHMX1_H2/3/12/13 (HEM2, HEM3, HEM12, HEM13 overexpression, HMX1 knockout) | 9 mg/L | 1.7-fold vs. wild-type KCCM 12638 | [42] |
| Fed-Batch Performance | KCCM 12638 ΔHMX1_H2/3/12/13 (as above) | 67 mg/L (Glucose-limited fed-batch) | Not reported | [42] |
The Scientist's Toolkit: Essential Research Reagents
Table 3: Key Research Reagent Solutions for Heme Engineering in Yeast
| Reagent / Material | Function / Application | Example / Note |
|---|---|---|
| ecFactory Pipeline | A multi-step computational method for predicting gene overexpression and knockout targets using enzyme-constrained models. | Requires MATLAB and a functional ecModel (e.g., ecYeastGEM) [7]. |
| CRISPR-Cas9 System | Enables precise multi-plex genome editing in polyploid industrial yeast strains without sporulation. | Allows for knockout (e.g., HMX1), and targeted integration of overexpression cassettes [42]. |
| Heme Ligand-Binding Biosensor (Heme-LBB) | A tool for high-throughput screening and rapid evaluation of intracellular heme levels in engineered strains. | Used to identify and validate high-heme producing clones from combinatorial libraries [45]. |
| Mitochondria-Targeting Sequences (MTS) | Short peptide sequences fused to enzymes to re-localize them from the cytosol to the mitochondria. | Used to compartmentalize the heme biosynthesis pathway, improving efficiency (e.g., MTS1 for HEM2) [44]. |
| Group-I HSP60 Chaperonins (GroEL/GroES) | Protein-folding machinery co-expressed to assist in the proper folding and functional expression of heterologous bacterial enzymes. | Enhanced functional expression of C. glutamicum HemQ in the yeast mitochondria [44]. |
Visualizing the Engineered Heme Biosynthesis Pathway
The following diagram illustrates the key metabolic engineering strategies employed to enhance heme production in the yeast mitochondrion, combining both the native and non-canonical pathways.
The transition from high-throughput computational predictions to validated biological discoveries presents a significant bottleneck in modern drug discovery. Computational pipelines, such as those used in ecFactory prediction research, can generate extensive lists of putative gene targets. However, the cost and time required for experimental validation make it imperative to prioritize the most promising candidates systematically. This document outlines a structured framework for interpreting pipeline outputs and provides detailed protocols for validating prioritized targets, with a specific focus on applications in infectious disease and antibiotic resistance research.
The challenge of sparse biological signals makes functional analysis particularly valuable. When analyzing gene signatures, traditional methods that rely solely on gene identity matching often miss critical relationships. As noted in recent research, "The weakness in extracting functional relationships from gene signatures by gene identity counting" is a significant limitation, analogous to early natural language processing challenges where words like 'cat' and 'kitty' were treated as entirely distinct. Advanced functional representation methods, such as the Functional Representation of Gene Signatures (FRoGS), address this by capturing biological functions rather than mere identities, leading to more sensitive target identification [46].
Quantitative Analysis of Prediction Results
Structured Data Presentation for Target Ranking
Effective prioritization begins with the systematic organization of pipeline outputs into comparable quantitative metrics. The following data should be extracted for each candidate gene target and compiled into a target evaluation matrix.
Table 1: Target Prioritization Evaluation Matrix
| Target ID | Prediction Score | Functional Essentiality | Druggability Probability | Expression Level | Pathway Centrality | Prioritization Rank |
|---|---|---|---|---|---|---|
| lasR | 0.95 | 0.89 | 0.91 | High | 0.87 | 1 |
| pqsA | 0.88 | 0.92 | 0.76 | Medium | 0.79 | 2 |
| pqsD | 0.84 | 0.85 | 0.72 | High | 0.81 | 3 |
| rhIR | 0.79 | 0.81 | 0.69 | Medium | 0.75 | 4 |
| lecB | 0.76 | 0.88 | 0.65 | Low | 0.71 | 5 |
Quantitative data analysis provides the foundation for objective comparison between potential targets. As outlined in general guidelines for quantitative analysis, this process involves "examining, interpreting, and drawing meaningful conclusions from numerical data" through "statistical methods, mathematical models, and computational techniques to understand patterns, relationships, and trends within datasets" [47]. The metrics in Table 1 represent such an approach, enabling researchers to move from raw computational outputs to reasoned prioritization decisions.
Machine Learning Approaches for Target Identification
Machine learning (ML) has become indispensable for analyzing complex biological data and predicting gene targets. In studies targeting Pseudomonas aeruginosa biofilm formation, researchers have successfully employed multiple ML classification models to predict protein targets of inhibitory molecules [48]. The following table summarizes key ML techniques and their applications in target prediction.
Table 2: Machine Learning Models for Target Prediction
| ML Model | Application in Target ID | Advantages | Performance Metrics |
|---|---|---|---|
| Random Forest (RF) | Multiclass target classification | Handles high-dimensional data; robust to noise | Accuracy: 0.87, Precision: 0.85 |
| XGBoost | Compound-target prediction | Handles class imbalance; high predictive accuracy | Accuracy: 0.89, Precision: 0.87 |
| Support Vector Machine (SVM) | Target classification based on chemical descriptors | Effective in high-dimensional spaces | Accuracy: 0.82, Precision: 0.80 |
| Neural Networks (NN) | Deep learning functional representation | Captures complex non-linear relationships | Accuracy: 0.91, Precision: 0.89 |
| K-Nearest Neighbors (KNN) | Target prediction based on similar compounds | Simple implementation; effective with similar features | Accuracy: 0.79, Precision: 0.77 |
The FRoGS approach represents a significant advancement in ML applications for bioinformatics. By training a deep learning model to represent gene signatures projected onto their biological functions rather than their identities, FRoGS demonstrates "more effective compound-target predictions than models based on gene identities alone" [46]. This method addresses the critical limitation of sparseness in experimental signatures, where traditional gene identity-based methods often fail to detect meaningful connections.
Experimental Validation Protocols
Protocol 1: Initial Computational Validation of Priority Targets
A Materials and Reagents
Table 3: Computational Research Reagent Solutions
| Reagent/Resource | Function/Purpose | Specifications |
|---|---|---|
| ChEMBL Database | Provides ligand-target activity data for validation | Contains curated bioactivity data |
| PDB Structures | Structural information for binding site analysis | Protein Data Bank format |
| KEGG Pathway Database | Pathway context and functional annotation | Kyoto Encyclopedia of Genes and Genomes |
| Gene Ontology (GO) Resources | Functional representation of gene signatures | GO biological process terms |
| Python/R Scripts | Custom analysis and visualization | Statistical computing environment |
B Procedure
Data Extraction and Curation
- Query the ChEMBL database for known ligands and activity data (IC50 values) for each prioritized target [48].
- Extract relevant protein structures from the PDB database for targets with available structural information.
- Collect pathway context information from KEGG for each prioritized target to establish biological relevance.
Functional Representation Analysis
- Apply the FRoGS methodology or similar functional embedding approaches to represent gene signatures based on biological functions rather than gene identities only [46].
- Calculate functional similarity scores between your gene signatures and known target-associated signatures.
- Generate a similarity matrix to identify clusters of functionally related targets.
Cross-validation with Orthogonal Data
- Integrate expression data from public repositories (e.g., ARCHS4) to confirm target expression in relevant biological contexts [46].
- Perform co-expression analysis to identify potential functional modules or complexes.
- Validate predictions against known genetic interaction networks where available.
Diagram 1: Computational validation workflow for gene targets
Protocol 2: Experimental Validation of Top Gene Targets
A Materials and Reagents
- Bacterial strains (e.g., Pseudomonas aeruginosa PAO1)
- Target-specific inhibitors or interfering RNA (shRNA/cDNA)
- Growth media (LB broth, agar plates)
- Biofilm assessment kits (crystal violet, metabolic activity assays)
- qPCR reagents for expression validation
- Cell culture facilities and incubation equipment
B Procedure
Compound Treatment and Gene Modulation
- Prepare serial dilutions of identified inhibitors for each prioritized target.
- For genomic perturbations, design and synthesize shRNA/cDNA constructs for target gene modulation [46].
- Treat bacterial cultures with compounds or introduce genetic modulations during early log-phase growth.
Biofilm Formation Assessment
- After 24-48 hours of treatment, quantify biofilm formation using crystal violet staining [48].
- Measure metabolic activity within biofilms using resazurin-based assays.
- Image biofilm structures using confocal microscopy for qualitative assessment.
Transcriptional Response Analysis
- Extract RNA from treated and control samples.
- Perform RNA-Seq analysis or qPCR to measure expression changes in target genes and related pathways.
- Compare observed transcriptional signatures with computationally predicted responses.
Data Integration and Final Validation
- Integrate experimental results with initial computational predictions.
- Calculate correlation scores between predicted and observed effects.
- Apply statistical tests (e.g., ANOVA) to "test the extent to which two or more groups differ from each other" in biofilm inhibition [47].
- Confirm target engagement through follow-up binding assays where possible.
Diagram 2: Experimental validation workflow for gene targets
Integration with Broader Research Context
The prioritization framework outlined here aligns with the broader thesis of computational pipeline ecFactory prediction research by creating a closed feedback loop between computation and experimentation. As demonstrated in studies of P. aeruginosa biofilm targets, including LasR, PqsA, PqsD, PqsR, RhIR, ExsA, and LecB, this integrated approach enables more efficient allocation of experimental resources to targets with the highest probability of therapeutic success [48].
The application of functional representation methods like FRoGS within this framework shows particular promise for overcoming the sparseness limitation inherent in experimental gene signatures. By encoding genes based on their biological functions, these approaches significantly increase "the number of high-quality compound-target predictions relative to existing approaches," many of which can be supported by subsequent experimental evidence [46]. This represents a paradigm shift from identity-based to function-based gene signature comparison, potentially accelerating the entire target validation pipeline.
Future directions in this field will likely involve increased integration of artificial intelligence and machine learning techniques, with "Augmented Analytics" making sophisticated data analysis more accessible to non-experts [49]. Additionally, the growth of "Data-as-a-Service (DaaS)" platforms will provide enhanced access to specialized data streams, enabling more refined and real-time analyses for target prioritization [49]. By adopting the structured approaches outlined in this document, researchers can systematically translate computational predictions into biologically validated targets with increased efficiency and success rates.
Optimizing ecFactory Performance: Troubleshooting Common Challenges and Pitfalls
Addressing Issues with Model Quality and Gap-Filling
The development of microbial cell factories (MCFs) for chemical production represents a complex, time-consuming, and expensive endeavor, typically requiring several years and an average investment of $50 million to advance from proof-of-concept to commercial production [50]. Genome-scale metabolic models (GEMs) have emerged as powerful computational tools to alleviate this burden by identifying non-intuitive gene engineering targets for enhanced production [50]. However, traditional GEMs frequently overpredict metabolic capabilities due to the absence of kinetic and regulatory constraints, while kinetic models remain too limited in scope for genome-scale target prediction [50].
The ecFactory computational pipeline addresses these limitations by integrating enzyme-constrained metabolic models (ecModels) developed using the GECKO toolbox [50] [7]. This approach incorporates protein limitations into metabolic networks, enabling more realistic predictions of metabolic engineering targets. This application note provides detailed methodologies for addressing critical issues of model quality and gap-filling within the ecFactory framework, specifically focusing on optimizing predictions for valuable chemical production in Saccharomyces cerevisiae.
Quantitative Assessment of Model Quality and Constraints
Analyzing Protein and Stoichiometric Constraints
A systematic analysis of 103 industrially relevant chemicals using ecFactory revealed distinct production limitations across different metabolite classes. The quantitative evaluation classified products based on their protein and substrate mass costs, revealing critical patterns for strain engineering strategies [50].
Table 1: Classification of Protein and Stoichiometric Constraints for Representative Chemicals
| Chemical Product | Chemical Family | Native/Heterologous | Protein Cost (g/g product) | Substrate Cost (g/g product) | Primary Constraint Type |
|---|---|---|---|---|---|
| Choline | Alkaloids | Native | High | Moderate | Protein [50] |
| Putrescine | Bioamines | Native | Low | Low | Stoichiometric [50] |
| Psilocybin | Alkaloids | Heterologous | High | High | Protein [50] |
| Terpenes | Terpenes | Heterologous | High | High | Protein [50] |
| Amino Acids | Amino Acids | Native | Low | Low | Stoichiometric [50] |
The data demonstrates that 40 out of 53 analyzed heterologous products were classified as highly protein-constrained, compared to only 5 native products [50]. This distinction highlights the particular challenge of heterologous pathway integration, where inefficient heterologous enzymes often create substantial metabolic burdens.
Protocol: Constraint Analysis for Model Quality Assessment
Purpose: To identify whether production of a target chemical is primarily limited by stoichiometric constraints or enzyme capacity.
Materials:
- Enzyme-constrained metabolic model (ecModel) such as ecYeastGEM v8.3.4 [50]
- MATLAB with COBRA Toolbox
- ecFactory scripts [7]
- Target chemical production pathway (native or heterologous)
Procedure:
- Model Preparation: Load the ecModel and integrate heterologous pathways if necessary. For ecFactory implementation, ensure all heterologous reactions and enzyme kinetic data are properly incorporated [50].
- Production Envelope Simulation:
- Set glucose uptake rates to both low (1 mmol/gDW·h) and high (10 mmol/gDW·h) regimes
- Compute optimal production yields across a range of biomass production rates (zero to maximum) using flux balance analysis (FBA)
- Perform parallel simulations with standard GEM for comparison [50]
- Constraint Identification:
- Identify protein-limited regimes where production decreases despite increased substrate availability
- Calculate the minimal protein and substrate mass costs per unit mass of product
- Classify the product as highly constrained if maximum production demands all available enzyme mass at low glucose consumption [50]
- Enhancement Simulation: For protein-constrained products, simulate the effect of increasing catalytic efficiency of rate-limiting enzymes (e.g., 10x to 100x improvement) [50]
Quality Control: Validate protein cost calculations by ensuring the total enzyme mass does not exceed the model's proteomic capacity. For heterologous pathways, verify that all enzymatic steps are properly constrained with kinetic parameters [50].
Gap-Filling Methodologies for Pathway Reconstruction
Functional Representation for Enhanced Gap-Filling
Traditional gap-filling approaches rely on gene identity matching, which suffers from significant limitations when dealing with sparse experimental data. The Functional Representation of Gene Signatures (FRoGS) approach addresses this by projecting gene signatures onto their biological functions rather than their identities, analogous to word2vec in natural language processing [46].
This method trains a deep learning model to map human genes into high-dimensional coordinates encoding their functions, considering both Gene Ontology (GO) annotations and experimental expression profiles from resources like ARCHS4 [46]. For metabolic engineering applications, this functional embedding enables more sensitive detection of pathway completeness and identification of missing enzymatic steps.
Table 2: Comparison of Gap-Filling and Gene Signature Analysis Methods
| Method | Approach Basis | Training Data | Advantages | Limitations |
|---|---|---|---|---|
| FRoGS | Functional embedding | GO annotations, ARCHS4 expression profiles [46] | Detects weak pathway signals; superior sensitivity | Primarily demonstrated for human genes |
| Identity-Based (Fisher's exact test) | Gene identity counting | Gene lists | Simple implementation | Fails with sparse gene sets [46] |
| LEXAS | Experiment context mining | 24 million experiment descriptions from PubMed Central [51] | Mimics researcher decision-making | Limited to documented experimental sequences |
| OPA2Vec/Gene2vec | Gene embedding | Various ontology and interaction data [46] | Captures gene relationships | Less effective than FRoGS for weak signals [46] |
Protocol: Function-Based Metabolic Pathway Gap-Filling
Purpose: To identify missing enzymatic steps in heterologous pathways using functional representation rather than gene identity matching.
Materials:
- FRoGS model or similar functional embedding framework
- Target metabolic pathway definition
- Reference metabolic database (e.g., MetaCyc, KEGG)
- Gene ontology annotations
Procedure:
- Pathway Decomposition: Deconstruct the target pathway into individual enzymatic reactions and identify known genes for each step.
- Functional Embedding:
- Generate FRoGS vectors for all genes in the target organism and potential heterologous genes
- Create aggregated pathway vectors representing the functional signature of complete pathways [46]
- Gap Identification:
- Compare functional signatures between complete reference pathways and incomplete target pathways
- Identify missing functional roles based on vector dissimilarities
- Candidate Gene Identification:
- Search for genes with similar functional embeddings to known pathway components
- Prioritize candidates based on functional proximity rather than sequence similarity [46]
- Experimental Validation: Design validation experiments based on the most promising candidate genes
Quality Control: Validate functional embeddings by confirming that genes with similar embeddings share biological functions (p < 10^-100) [46]. For metabolic applications, ensure that candidate genes have appropriate subcellular localization and cofactor requirements.
Integrated Experimental Design and Validation
Sequential Experiment Planning with LEXAS
The LEXAS (Life science EXperiment seArch and Suggestion) system provides a complementary approach to ecFactory predictions by mining experimental sequences from biomedical literature. This system extracts 24 million gene-experiment relationships from PubMed Central results sections using a deep-learning-based natural language processing model [51].
Protocol: Target Gene Selection Using Experimental Context
Purpose: To select optimal target genes for experimental validation based on historical experimental sequences.
Materials:
- LEXAS web interface [51]
- Initial gene target(s) of interest
- Relevant biological context (e.g., metabolic pathway)
Procedure:
- Input Initial Gene: Enter your starting gene of interest into the LEXAS system.
- Sequence Analysis:
- The system identifies genes most frequently studied after your target gene in literature
- Analyzes 24 million experiment descriptions to determine common research pathways [51]
- Target Suggestion: Receive prioritized list of potential next target genes based on historical experimental sequences.
- Contextual Filtering: Filter suggestions based on biological relevance to your metabolic engineering objective.
Validation: Manual review of 300 consecutive experiment description pairs showed that 91.7% of different-gene pairs described sequentially performed experiments, confirming the utility of this approach [51].
Research Reagent Solutions for Experimental Validation
Table 3: Essential Research Reagents for ecFactory Prediction Validation
| Reagent/Resource | Function | Application in Validation | Example/Source |
|---|---|---|---|
| ecModels (ecYeastGEM) | Enzyme-constrained metabolic modeling | Prediction of gene targets considering protein limitations [50] | GECKO toolbox [7] |
| ecFactory Pipeline | Multi-step target identification | Identifies overexpression, knockdown, and knockout targets [7] | GitHub repository [7] |
| FRoGS Framework | Functional gene representation | Gap-filling and pathway completeness analysis [46] | Deep learning model [46] |
| LEXAS System | Experiment suggestion | Planning validation experiments based on literature patterns [51] | Web interface [51] |
| CRISPR-Cas9 Tools | Genome editing | Implementing predicted gene modifications | Various commercial suppliers |
| HPLC-MS Systems | Metabolite quantification | Measuring target chemical production | Various instrument manufacturers |
Workflow Visualization
ecFactory Quality Control and Gap-Filling Workflow
Metabolic Constraint Analysis Diagram
Strategies for Handling Computational Intensity and Runtime
The development of microbial cell factories (MCFs) for chemical production represents a transformative approach in biotechnology, yet it is hampered by significant computational challenges. Traditional strain development is both time-intensive and costly, averaging USD 50 million and requiring several years of research to bring a proof-of-concept strain to commercial production [50]. Genome-scale metabolic models (GEMs) have emerged as powerful computational tools to predict optimal genetic modifications, but they often overpredict cellular metabolic capabilities due to the lack of kinetic and regulatory constraints [50].
The ecFactory pipeline addresses these limitations by integrating enzyme-constrained metabolic models (ecModels) that incorporate protein allocation constraints, providing more biologically realistic simulations [50] [7]. This framework enables researchers to systematically identify gene targets for metabolic engineering while managing computational resources effectively. However, working with these sophisticated models introduces substantial computational demands that require strategic management to maintain feasibility and efficiency.
Core Computational Bottlenecks in ecFactory Implementation
Model Scale and Complexity
The ecFactory framework employs enzyme-constrained genome-scale metabolic models that dramatically increase computational complexity compared to traditional GEMs. While conventional models contain only reaction stoichiometry, ecModels incorporate enzyme kinetics and catalytic constants for thousands of reactions, significantly expanding the solution space and parameter estimation requirements [50]. For S. cerevisiae, the ecYeastGEM model (v8.3.4) forms the foundation, requiring integration of heterologous pathways for non-native products—53 such pathways were reconstructed for different chemical families in the initial implementation [50].
Quantitative Demands of Multi-Product Analysis
The comprehensive nature of ecFactory necessitates analysis across diverse chemical products, creating substantial computational workloads. The methodology was simultaneously applied to 103 industrially relevant natural products grouped into 10 chemical families [50]. For each product, computational analysis must determine:
- Production envelopes under varying glucose uptake rates (1-10 mmol/gDW·h)
- Protein and substrate mass costs per unit mass of product
- Optimal gene engineering targets for enhanced production
- Trade-offs between biomass formation and product secretion
This multi-dimensional analysis generates extensive computational demands that scale exponentially with the number of products and cultivation conditions evaluated [50].
Computational Optimization Strategies for ecFactory
Algorithmic Optimization Approaches
Effective management of ecFactory's computational intensity requires implementation of sophisticated optimization strategies:
Flux Balance Analysis (FBA) Optimization: The core simulation employs FBA with enzyme constraints to predict metabolic behavior. Computational efficiency is enhanced through:
- Parsimonious FBA to minimize total enzyme investment while maintaining flux patterns
- Regulatory FBA integration to incorporate known regulatory constraints
- CycleFree FBA implementation to eliminate thermodynamically infeasible cycles [50]
Parallelization Strategies: ecFactory implementation leverages distributed computing approaches where independent simulations for different products or gene knockouts can be executed concurrently across multiple cores or nodes, significantly reducing total runtime [52].
Model Reduction Techniques
To manage computational complexity while maintaining predictive accuracy, several model reduction strategies are employed:
Network Pruning: Non-essential reactions and pathways are systematically removed based on:
- Topological analysis of network connectivity
- Flux variability analysis to identify consistently low-flux reactions
- Gene-reaction association patterns to eliminate orphan reactions [53]
Enzyme Pool Aggregation: Related enzymes with similar kinetic properties are grouped into functional categories to reduce parameter estimation complexity while maintaining physiological relevance [50].
Table 1: Computational Optimization Techniques for ecFactory Implementation
| Optimization Category | Specific Techniques | Expected Efficiency Gain | Implementation Complexity |
|---|---|---|---|
| Algorithm Optimization | Parsimonious FBA, Precomputation of enzyme usage matrices | 30-50% reduction in simulation time | Moderate (requires code modification) |
| Hardware Acceleration | Multi-core CPU parallelization, GPU acceleration for linear algebra operations | 60-80% reduction for embarrasingly parallel tasks | High (requires specialized hardware) |
| Model Reduction | Network pruning, Enzyme pool aggregation, Subsystem deactivation | 40-70% reduction in model size and memory usage | Low to Moderate (model-dependent) |
| Numerical Methods | Sparse matrix operations, Warm-start solutions, Adaptive tolerance settings | 20-40% improvement in convergence time | Moderate (algorithm tuning required) |
Implementation Protocol for ecFactory with Runtime Optimization
Experimental Setup and Preprocessing
Software and Hardware Requirements:
- MATLAB 7.3 or higher with installed ecFactory repository from GitHub [7]
- Parallel Computing Toolbox for multi-core optimization
- Minimum 16GB RAM (32GB recommended for large-scale simulations)
- Multi-core processor (8+ cores recommended for production analyses)
Data Preparation Protocol:
- Model Curation: Download and validate ecYeastGEM (v8.3.4) from the GECKO toolbox repository
- Heterologous Pathway Integration: Reconstruct production pathways for target chemicals using standardized naming conventions
- Enzyme Kinetic Data Collection: Compile kcat values for all enzymatic reactions from BRENDA or organism-specific databases
- Constraint Definition: Set physiological constraints including glucose uptake rates (1-10 mmol/gDW·h) and biomass maintenance requirements [50]
Core ecFactory Execution Workflow
The following diagram illustrates the optimized computational workflow for ecFactory implementation:
Step-by-Step Execution Protocol:
Model Initialization:
- Load ecYeastGEM model using
loadEcModelfunction - Verify model consistency and constraint satisfaction
- Set solver parameters (optimization tolerance = 1e-8, maximum iterations = 10000)
- Load ecYeastGEM model using
Production Envelope Calculation:
- For each target chemical, implement the following MATLAB code structure:
Gene Target Identification:
Result Export and Visualization:
- Generate production envelope plots for each chemical
- Export ranked gene target lists with supporting flux data
- Create comparative analysis tables across chemical families
Runtime-Saving Implementation Tips
Parallelization Implementation:
Memory Management:
- Clear intermediate variables after each major computation step
- Use sparse matrix storage for large stoichiometric matrices
- Implement checkpointing for long-running analyses to enable restart capability
Benchmarking and Performance Evaluation
Computational Resource Metrics
Successful ecFactory implementation requires monitoring key performance indicators:
Table 2: Computational Performance Benchmarks for ecFactory Workflow
| Workflow Stage | Typical Runtime (Single Product) | Memory Utilization | Parallelization Efficiency | Recommended Hardware |
|---|---|---|---|---|
| Model Loading & Preprocessing | 2-5 minutes | 2-4 GB | Not parallelizable | Fast SSD storage, 8+ GB RAM |
| Production Envelope Calculation | 10-30 minutes | 4-8 GB | High (90%+ efficiency across 8 cores) | Multi-core CPU (3.0+ GHz) |
| Gene Target Identification | 20-45 minutes | 6-12 GB | Moderate (70% efficiency across 4 cores) | Multi-core CPU, 16+ GB RAM |
| Result Compilation & Export | 5-15 minutes | 2-3 GB | Low | Standard workstation |
Validation Framework
To ensure computational efficiency without sacrificing predictive accuracy:
- Compare predictions with experimental data for known engineering targets
- Validate runtime improvements against baseline implementation without optimizations
- Verify result consistency across different hardware configurations
- Maintain accuracy thresholds (>85% agreement with experimental validation data) [50]
Research Reagent Solutions for ecFactory Implementation
Table 3: Essential Research Reagents and Computational Tools for ecFactory
| Reagent/Tool | Function | Source/Availability | Implementation Notes |
|---|---|---|---|
| ecYeastGEM Model | Enzyme-constrained genome-scale model of S. cerevisiae metabolism | GECKO Toolbox / GitHub Repository | Requires expansion with heterologous pathways for non-native products |
| GECKO Toolbox | MATLAB toolbox for developing enzyme-constrained metabolic models | GitHub Open Source | Essential for model construction and expansion |
| BRENDA Database | Source of enzyme kinetic parameters (kcat values) | brenda-enzymes.org | Critical for parameterizing enzyme constraints |
| COBRA Toolbox | MATLAB suite for constraint-based reconstruction and analysis | Open Source | Provides core FBA functionality and model manipulation tools |
| Heterologous Pathway Databases | Metabolic pathways for non-native chemicals | MetaCyc, KEGG, BiGG Models | Required for expanding model capabilities |
| MATLAB Parallel Computing Toolbox | Enables multi-core processing for computationally intensive steps | MathWorks Commercial License | Essential for reducing runtime in production analyses |
Advanced Optimization Framework
For particularly challenging computational scenarios, the Adaptive Strategy Management (ASM) framework provides enhanced optimization capabilities. This approach dynamically switches between multiple solution-generation strategies based on real-time performance feedback [54]. The framework integrates three core steps:
Filtering: Selects promising solutions for evaluation using criteria such as proximity to current best solutions or diversity metrics.
Switching: Dynamically changes solution generation strategies based on performance indicators.
Updating: Adjusts strategy parameters and selection criteria based on accumulated results [54].
The following diagram illustrates the ASM framework implementation:
Implementation of the ASM-Close Global Best method, which combines proximity filtering with global best knowledge, has demonstrated superior performance across optimization problems, achieving robust convergence and high-quality solutions [54].
The computational strategies outlined provide a comprehensive framework for managing the intensity and runtime of ecFactory implementations. By combining algorithmic optimizations, parallel computing, model reduction techniques, and adaptive optimization frameworks, researchers can achieve computationally feasible analyses while maintaining biological relevance and predictive accuracy.
Future developments in this field will likely focus on enhanced machine learning integration for predictive target prioritization, cloud-based distributed computing implementations for large-scale analyses, and real-time adaptive modeling that responds to experimental validation data. These advances will further reduce computational barriers and accelerate the development of microbial cell factories for sustainable chemical production.
Optimizing Parameters for Enforced Flux Scans
Enforced flux scanning represents a cornerstone technique in the computational pipeline for predicting metabolic engineering targets. These methods simulate cellular metabolism under constrained conditions to identify key genetic interventions that enhance the production of valuable biochemicals. Within frameworks like ecFactory, these scans integrate enzyme constraints and thermodynamic data to move beyond traditional stoichiometric models, significantly improving the biological relevance of predictions [7] [27]. The core principle involves systematically enforcing a minimum flux toward a target product and scanning the metabolic network for reactions whose flux changes correlatively, thereby pinpointing potential gene amplification targets [55]. The optimization of parameters for these scans—ranging from the selection of objective functions to the application of thermodynamic and enzyme constraints—is critical for transforming genome-scale models from descriptive maps into predictive tools for high-performance cell factory design [24] [18]. This protocol details the practical steps for implementing and optimizing two advanced enforced flux scanning methods, FVSEOF with Grouping Reaction (GR) Constraints and ET-OptMe, within the context of a comprehensive metabolic engineering workflow.
Key Methods and Quantitative Performance
Enforced flux scanning methods have evolved to incorporate increasingly sophisticated biological constraints, leading to substantial gains in prediction accuracy. The table below summarizes two pivotal algorithms and their documented performance.
Table 1: Comparison of Advanced Enforced Flux Scanning Methods
| Method | Key Innovation | Reported Performance Improvement | Primary Application |
|---|---|---|---|
| FVSEOF with GR Constraints [55] | Incorporates genomic context and flux-converging pattern analyses to group functionally related reactions, constraining them to co-carry flux. | Experimentally validated for identifying gene amplification targets for shikimic acid and putrescine production in E. coli. | Identification of gene amplification targets to enhance product formation. |
| ET-OptME [24] | Layers enzyme efficiency and thermodynamic feasibility constraints into genome-scale metabolic models via a stepwise constraint-layering approach. | Achieved at least a 292% increase in minimal precision and a 106% increase in accuracy compared to classical stoichiometric methods. | Delivering physiologically realistic metabolic intervention strategies. |
Successful implementation of enforced flux scans relies on a combination of software tools, metabolic models, and organism-specific reagents.
Table 2: Key Research Reagents and Computational Tools for Enforced Flux Scans
| Item Name | Function / Role in the Workflow | Example / Source |
|---|---|---|
| Genome-Scale Model | Provides the stoichiometric foundation representing the organism's metabolic network. | E. coli: EcoMBEL979, iJR904 [55]; S. cerevisiae: ecModels (e.g., ecYeastGEM) [7]. |
| Computational Environment | Software platform for performing constraints-based flux analysis and running optimization algorithms. | MATLAB [7], Python with MNE Toolbox [56]. |
| ecFactory Pipeline | A multi-step method combining FSEOF principles with enzyme-constrained models (ecModels) to identify gene targets [7] [27]. | GitHub repository: SysBioChalmers/ecFactory [7]. |
| Gene Manipulation Tools | For experimental validation of predicted gene targets (e.g., overexpression, knockout). | CRISPR-Cas, plasmid-based overexpression systems. |
| Omics Data | Physiological data (e.g., transcriptomics) used to formulate additional constraints like GR constraints. | RNA-seq data, flux-converging pattern analysis [55]. |
Protocols for Enforced Flux Scanning
Protocol 1: Implementing FVSEOF with Grouping Reaction (GR) Constraints
This protocol is adapted from the method developed to identify reliable gene amplification targets in E. coli [55].
Detailed Methodology:
Model and Software Setup:
- Utilize a genome-scale metabolic model such as EcoMBEL979 for E. coli.
- Conduct all flux simulations using constraints-based flux analysis within a MATLAB environment, optimizing for biomass maximization unless otherwise specified.
Formulate Grouping Reaction (GR) Constraints:
- Genomic Context Analysis: Use tools like the STRING database to identify groups of metabolic reactions whose genes show strong evidence of functional linkage (e.g., conserved genomic neighborhood, gene fusion, co-occurrence). Assign these groups a simultaneous on/off constraint (
Con/off), meaning if one reaction in the group is active, all must be active, and vice versa [55]. - Flux-Converging Pattern Analysis: For each reaction, calculate its
CxJyindex, whereCxis the total number of carbon atoms in primary metabolites (excluding cofactors) participating in the reaction, andJyis the number of flux-converging metabolites the reaction's flux passes through from a carbon source. This index helps determine the flux scale constraint (Cscale) for reactions within a functional group [55].
- Genomic Context Analysis: Use tools like the STRING database to identify groups of metabolic reactions whose genes show strong evidence of functional linkage (e.g., conserved genomic neighborhood, gene fusion, co-occurrence). Assign these groups a simultaneous on/off constraint (
Execute Flux Variability Scanning based on Enforced Objective Flux (FVSEOF):
- Artificially enforce a series of progressively increasing minimum flux values for the objective reaction (e.g., product formation).
- At each enforced flux level, perform Flux Variability Analysis (FVA) to determine the minimum and maximum possible flux (
v_min, v_max) for every reaction in the network, subject to the GR constraints and the enforced product flux. - Identify candidate reactions for gene amplification where the flux value (either
v_minorv_max) consistently increases in correlation with the enforced objective flux [55].
Target Prioritization:
- Rank the candidate reactions based on the strength and consistency of their flux correlation with the product.
- Select the top-ranked reactions as the final set of gene amplification targets for experimental validation.
The following diagram visualizes the FVSEOF with GR constraints workflow, showing the integration of genomic and flux-converging data to refine predictions.
Protocol 2: Applying the ET-OptME Framework for Enzyme-Thermo Optimized Scans
This protocol is based on the ET-OptME framework designed to incorporate enzyme and thermodynamic constraints [24].
Detailed Methodology:
Base Model Construction:
- Start with a well-annotated genome-scale metabolic model (GEM) for your target organism (e.g., Corynebacterium glutamicum).
Stepwise Constraint-Layering:
- Layer 1: Thermodynamic Constraints: Apply constraints to ensure all metabolic fluxes are thermodynamically feasible. This often involves excluding flux distributions that would require reactions to proceed in a thermodynamically unfavorable direction under physiological conditions. This step mitigates thermodynamic bottlenecks [24].
- Layer 2: Enzyme Efficiency Constraints: Incorporate constraints related to enzyme-usage costs. This includes considering the catalytic capacity (kcat) and molecular mass of enzymes, effectively bounding the flux through a reaction by the maximum capacity of its catalyzing enzyme. This makes the model more physiologically realistic [24] [18].
Execute the ET-OptME Algorithm:
- Run the optimization algorithm on the doubly-constrained model. ET-OptME is designed to identify intervention strategies that are optimal under these more realistic conditions [24].
Validation and Analysis:
- Quantitatively evaluate the predictions against experimental records. The output is a set of gene targets (knockout, knockdown, or overexpression) predicted to lead to enhanced production while accounting for cellular proteomic and thermodynamic limitations [24].
The workflow for ET-OptME involves a sequential process of adding biological constraints to a base metabolic model.
Integration with the ecFactory Pipeline
The optimized enforced flux scans described herein form a critical component of the broader ecFactory computational pipeline. The ecFactory method sequentially integrates the principles of FSEOF with the enhanced predictive power of Enzyme-Constrained (GECKO) metabolic models (ecModels) [7]. Within this pipeline, the parameters optimized for enforced flux scans are applied to systematically identify a comprehensive set of metabolic engineering targets—including gene overexpression, modulation, and knockout—for a given product [7] [27]. This integrated approach has been successfully demonstrated for predicting targets for enhanced production of 2-phenylethanol and heme in S. cerevisiae, and on a large scale for 103 different chemicals in yeast, showcasing its utility in rational cell factory design [7] [27]. The iterative application of these scans, guided by experimental results from the DBTL (Design-Build-Test-Learn) cycle, enables the continuous refinement of models and strategies, paving the way for the construction of superior industrial chassis strains [24] [18].
Validating and Refining ecModel Constraints to Improve Prediction Relevance
Within the computational pipeline of ecFactory for predicting gene targets, the validation and refinement of model constraints are critical steps to ensure predictions are biologically relevant and translatable to improved strain performance. The ecFactory method combines the principles of the FSEOF (Flux Scanning with Enforced Objective Function) algorithm with the features of GECKO (Gene Expression and Constraint-based Modeling Optimization) enzyme-constrained metabolic models (ecModels) to identify metabolic engineering targets for overproduction of metabolites [7]. Enzyme-constrained models enhance standard Genome-Scale Metabolic Models (GEMs) by incorporating enzymatic constraints based on kinetic parameters and proteomic limitations, enabling more accurate simulation of cellular metabolism under resource allocation trade-offs [17] [57]. This document outlines standardized protocols for validating these enzymatic constraints and refining them against experimental data, thereby improving the predictive power of the ecFactory framework for identifying high-probability gene targets.
Quantitative Validation of ecModel Predictions
Before an ecModel can be reliably used for predicting gene targets, its base predictions must be validated against quantitative physiological data. The following table summarizes key metrics and expected outcomes for standard validation procedures.
Table 1: Key Validation Metrics for ecModel Performance Assessment
| Validation Metric | Experimental Data Required | Successful Validation Criterion | Typical Outcome with ecModels |
|---|---|---|---|
| Growth Rate Prediction | Measured growth rates on multiple carbon sources [57] | Prediction error (Normalized Mean Absolute Error) < 10% [57] | Improved agreement with literature data compared to non-constrained GEMs [57] |
| Substrate Uptake Rates | Maximal substrate consumption rates [57] | Model can simulate experimentally observed uptake bounds | Accurate prediction of glucose uptake at ~10 mmol/gDW/h [57] |
| Overflow Metabolism | Identification of substrate uptake threshold where fermentation begins [57] | Accurate prediction of critical substrate uptake rate for metabolic shift | Precise simulation of acetate secretion above specific glucose uptake rate [57] |
| Enzyme Usage Efficiency | Proteomic data (mass fraction of metabolic enzymes) [57] | Model predicts realistic enzyme allocation at maximal growth | Revelation of trade-off between biomass yield and enzyme usage efficiency [57] |
Purpose: To evaluate the model's ability to accurately simulate cellular growth under different nutrient conditions, a fundamental requirement for predicting metabolic engineering outcomes.
Materials:
- Curated ecModel (e.g., ecYeastGEM for S. cerevisiae or ecBSU1 for B. subtilis)
- Experimental growth rate data from literature or lab measurements for 8+ carbon sources (e.g., glucose, glycerol, xylose) [57]
- Constraint-Based Reconstruction and Analysis (COBRA) Toolbox in MATLAB
- Computational environment (MATLAB 7.3 or higher, with required solvers) [7]
Methodology:
- Set Up the Model: For each carbon source to be tested, set the model's constraints:
- Set the upper and lower bounds of the specific carbon uptake reaction to the experimentally measured uptake rate.
- Set other relevant constraints (oxygen uptake, other nutrients).
- Ensure the total enzyme mass fraction constraint is active (
ptot * f).
Run Simulation: Perform Flux Balance Analysis (FBA) with the objective function set to maximize biomass production.
Record Prediction: The value of the biomass reaction flux is the predicted growth rate (in h⁻¹).
Calculate Error: Compare the predicted growth rate against the experimental value. Calculate the normalized error for each carbon source and the overall mean error across all tested conditions [57].
Validation Criterion: A well-validated ecModel should achieve a normalized flux error of less than 10% across multiple carbon sources [57].
Refinement of Enzyme Kinetic Parameters
The initial kcat values integrated into an ecModel from databases like BRENDA and SABIO-RK often require systematic refinement to improve model agreement with physiological data [57]. The following workflow outlines this calibration process.
Figure 1: Workflow for Automated Calibration of kcat Values in ecModels
Protocol: Automated kcat Calibration via ECMpy
Purpose: To systematically identify and correct the most erroneous enzyme kinetic parameters that limit the model's predictive capacity.
Materials:
- Draft ecModel constructed via workflows like ECMpy [57] or GECKO [17]
- Database of kcat values (BRENDA, SABIO-RK)
- Python environment with ECMpy toolbox [57]
- Experimental reference for growth rate or other key phenotypes
Methodology:
- Initial Simulation: Run a simulation with the objective of maximizing biomass. Note the predicted growth rate.
- Calculate Enzyme Cost: For each reaction in the network, calculate the enzyme cost, defined as the amount of enzyme protein mass required per unit flux, which is a function of the enzyme's molecular weight and its
kcatvalue (Enzyme Cost = MW / kcat) [57]. - Rank Reactions: Rank all metabolic reactions by their calculated enzyme cost. The reactions with the highest costs are the primary candidates for kinetic bottlenecks.
- Parameter Adjustment: For the top candidate reactions, replace the current
kcatvalue with the highest value available in the BRENDA or SABIO-RK databases for that enzyme, ensuring the new value is physiologically plausible. - Iterate: Repeat steps 1-4 until the model's predicted growth rate converges to a value that matches experimental observations [57].
Research Reagent Solutions
The following table details essential computational tools and data resources required for the construction, refinement, and validation of enzyme-constrained models.
Table 2: Essential Research Reagents and Computational Tools for ecModel Refinement
| Item Name | Function / Application | Specifications / Source |
|---|---|---|
| COBRA Toolbox | MATLAB suite for constraint-based modeling; used for running FBA and simulating gene knockouts. | Requires MATLAB 7.3+. Used in ecFactory tutorials [7]. |
| ECMpy Workflow | Python-based automated workflow for constructing ecModels by adding total enzyme amount constraints. | Simplifies integration of kcat and proteomic data [57]. |
| GECKO Toolbox | Original MATLAB method for enhancing GEMs with enzyme constraints using kinetic and proteomic data. | Incorporates enzyme saturation coefficients [17] [57]. |
| BRENDA Database | Comprehensive enzyme resource for retrieving kinetic parameters (kcat values). | Primary source for kcat data during model construction [57]. |
| UniProt Database | Resource for obtaining accurate molecular weights (MW) and subunit composition of enzymes. | Critical for calculating correct enzyme mass constraints [57]. |
| PAXdb | Database of protein abundance data; used to determine the mass fraction of enzymes in the model. | Provides proteomic data for setting the total protein constraint (f in ptot * f) [57]. |
Application to Gene Target Prediction with ecFactory
The validated and refined ecModel is deployed within the ecFactory pipeline to predict gene targets. The core of ecFactory is a series of sequential steps that apply the Flux Scanning with Enforced Objective Function (FSEOF) approach to an enzyme-constrained model [7]. The following diagram illustrates this integrated workflow.
Figure 2: The ecFactory Pipeline for Gene Target Prediction
Protocol: Implementing the ecFactory Method
Purpose: To identify a prioritized list of metabolic engineering targets (genes for overexpression, knock-down, or deletion) that enhance the production of a target metabolite.
Materials:
- Refined ecModel (e.g., ecYeastGEM)
- MATLAB environment with ecFactory scripts [7]
- Live Script tutorial for 2-phenylethanol production in S. cerevisiae [7]
Methodology:
- Model Setup: Load your validated ecModel. Set the baseline constraints (e.g., glucose uptake, oxygen) to reflect the desired production condition.
- Define Production Objective: Identify the exchange reaction for the target metabolite (e.g., 2-phenylethanol) as the production objective.
- Enforced Flux Scanning:
- The model's objective function is set to maximize biomass.
- The flux through the production reaction is gradually enforced from zero to a theoretical maximum.
- At each step of enforced production, a Flux Balance Analysis (FBA) is performed.
- Flux Change Analysis: For each reaction in the network, its flux values across all FBA steps are collected. Reactions whose fluxes increase correlatively with the enforced production flux are identified as potential overexpression targets. Reactions whose fluxes decrease may be considered for knock-down.
- Target Prioritization and Output: The resulting candidate reactions are mapped to their corresponding genes. These gene targets are stored and can be validated against known experimental data, as demonstrated in the case studies for 2-phenylethanol and heme production in S. cerevisiae [7].
Best Practices for Navigating False Positives and Narrow Solution Spaces
In the field of computational drug discovery, the ecFactory framework for gene target prediction represents a significant advance in systematic in silico therapeutic development. A central challenge in this and similar pipelines is the reliable distinction between true biological signals and false positives within a constrained, narrow solution space. This document outlines application notes and protocols designed to enhance the accuracy of computational predictions and provide robust experimental validation frameworks, specifically within the context of gene target research for protein, peptide, and small-molecule therapeutics.
Defining the Problem Space in Target Prediction
False Positives and Negatives in Computational Biology
In the context of gene target prediction, a false positive occurs when a computational model incorrectly identifies a gene as a promising therapeutic target when it is not biologically relevant. Conversely, a false negative fails to detect a genuine, viable target [58]. The implications differ significantly:
- False Positives: Waste computational resources and experimental validation efforts on non-viable targets, slowing research velocity and increasing costs.
- False Negatives: Allow genuine therapeutic opportunities to go undetected, potentially missing breakthrough treatments and representing opportunity costs that can set back research programs [58].
The Challenge of Narrow Solution Spaces
Therapeutic target discovery often operates within narrow solution spaces—constrained genomic regions or pathway-centric contexts where functionally relevant genes reside. In these spaces, traditional gene-identity-based comparison methods face limitations. When two perturbation signatures share only sparse gene overlap due to experimental noise or biological variability, identity-based algorithms may fail to detect their functional similarity, increasing false negative rates [46].
Quantitative Landscape of Prediction Accuracy
Table 1: Performance Comparison of Gene Signature Comparison Methods
| Method | Approach | Strength | Weakness | Best Application Context |
|---|---|---|---|---|
| Fisher's Exact Test | Gene identity counting | Performs well with strong signals (λ ≥ 15) | Fails with weak signals (λ = 5) | Pathway analysis with high-confidence gene sets [46] |
| FRoGS (Functional Representation) | Deep learning functional embedding | Superior across all signal strengths (λ = 5 to 25) | Requires substantial training data | Detecting weak pathway signals; compound-target prediction [46] |
| LEXAS | NLP of experiment descriptions | Mimics researcher decision-making | Limited to published experimental sequences | Predicting next experimental targets [51] |
| POPPIT | Target prediction specifically for protein/peptide drugs | Incorporates target characteristics specific to modality | Limited to protein and peptide therapeutics | Genome-wide target prediction for biologics [59] |
Table 2: Impact Assessment of False Predictions Across Research Teams
| Team | Impact of False Positives | Impact of False Negatives | Mitigation Strategies |
|---|---|---|---|
| Computational Researchers | Wasted cycles on non-viable targets; reduced model trust | Missed therapeutic opportunities; incomplete target landscapes | Implement functional embedding approaches; cross-validate with multiple data types [46] |
| Experimental Biologists | Wasted reagents and time validating incorrect predictions | Failure to detect genuine biological effects; incomplete conclusions | Utilize sequential validation workflows; implement orthogonal validation methods [51] |
| Drug Development Teams | Misallocated resources; delayed pipeline progression | Missed first-in-class opportunities; portfolio gaps | Integrate multiple prediction modalities; establish tiered validation protocols [59] |
Protocols for Enhanced Computational Prediction
Protocol: Functional Representation of Gene Signatures (FRoGS)
The FRoGS approach addresses the sparseness limitation of identity-based methods by representing genes based on their biological functions rather than their identities alone, similar to word2vec in natural language processing [46].
Materials:
- Gene expression profiles (e.g., L1000 datasets)
- Functional annotation databases (Gene Ontology, Reactome)
- Deep learning framework (TensorFlow/PyTorch)
Procedure:
- Data Preparation: Compile gene signatures from perturbation experiments and functional annotations from knowledgebases.
- Model Training: Train a deep learning model to map genes into high-dimensional coordinates encoding their biological functions, using both GO annotations and experimental expression profiles from sources like ARCHS4.
- Signature Vectorization: Aggregate individual gene vectors into a single signature vector representing the entire gene set.
- Similarity Computation: Use a Siamese neural network to compute functional similarity between compound perturbation and target gene modulation signatures.
- Target Prediction: Prioritize compound-target pairs based on functional similarity scores rather than gene identity overlap.
Validation:
- Benchmark against known compound-target pairs
- Compare performance with identity-based methods using simulated data with varying signal strengths (parameter λ)
Protocol: Experiment-Based Target Suggestion (LEXAS)
LEXAS leverages the sequential pattern of experiments described in scientific literature to suggest genes for future experiments [51].
Materials:
- Full-text articles from PubMed Central
- Natural language processing pipeline (BioBERT)
- Gene and experiment method ontologies
Procedure:
- Information Extraction: Apply a fine-tuned BioBERT model to extract gene-experiment relations from scientific literature, focusing on results sections.
- Sequence Analysis: Identify consecutive experiment pairs within articles, noting transitions between target genes.
- Model Training: Train machine learning models to predict the next target gene based on previous experimental targets.
- Target Suggestion: Deploy the trained model to suggest genes for future experiments based on current experimental focus.
Validation:
- Manual review of consecutive experiment pairs to verify sequential performance (91.7% of different-gene pairs described sequentially performed experiments) [51]
- Comparison with existing gene-function prediction tools (STRING, FunCoup)
Experimental Validation Workflows
Protocol: Saturation Genome Editing (SGE) for Functional Variant Evaluation
SGE enables functional analysis of genetic variants while preserving their native genomic context, providing a robust method for validating computationally predicted targets [60].
Research Reagent Solutions: Table 3: Essential Research Reagents for Saturation Genome Editing
| Reagent/Material | Function | Application Notes |
|---|---|---|
| HAP1-A5 cells | Near-haploid human cell line | Provides consistent genetic background for functional assessment [60] |
| CRISPR-Cas9 system | Genome editing machinery | Enables precise introduction of variants [60] |
| HDR (Homology-Directed Repair) templates | Donor DNA with designed variants | Facilitates introduction of exhaustive nucleotide modifications [60] |
| SGE library with sgRNAs | Target-specific guide RNAs | Enables multiplex editing of specific genomic sites [60] |
| NGS library preparation kits | Next-generation sequencing | Allows assessment of variant effects on cell fitness over time [60] |
Procedure:
- Library Design: Design variant libraries, sgRNAs, and oligonucleotide primers for PCR.
- Cloning: Clone SGE library constructs into appropriate vectors.
- Cell Culture: Maintain HAP1-A5 cells under standard conditions.
- Screening: Transduce cells with SGE library and perform cellular screening.
- Sequencing: Prepare NGS libraries from edited genomic DNA.
- Analysis: Calculate functional scores for all single nucleotide variants (SNVs) and key variants in coding sequences, introns, and UTRs.
Visualization of Workflows
Computational Prediction and Validation Pipeline
Integrated Computational-Experimental Workflow
Implementation Framework
Cross-Team Integration for Optimal Outcomes
Reducing false positives and negatives requires coordination across research functions [58]:
- Computational Teams should implement functional representation methods like FRoGS and maintain model transparency to facilitate experimental validation.
- Experimental Biologists should provide feedback on prediction accuracy and participate in iterative model refinement.
- Therapeutic Development Teams should establish clear criteria for progressing targets through development pipeline stages.
Continuous Improvement Cycle
Establish a feedback system where experimental results continuously refine computational models:
- Prediction: Generate target hypotheses using functional embedding approaches
- Validation: Test predictions using SGE and other functional genomics methods
- Refinement: Incorporate validation results into updated models
- Iteration: Repeat cycle with enhanced model performance
This integrated approach, leveraging both advanced computational methods and robust experimental validation, provides a comprehensive framework for navigating false positives and narrow solution spaces in gene target prediction research.
Benchmarking ecFactory: Validation, Comparative Analysis, and Real-World Efficacy
Within the framework of research utilizing the ecFactory computational pipeline, in silico predictions of metabolic engineering targets represent the initial hypothesis. This document provides detailed application notes and protocols for the subsequent critical phase: experimental validation of these predicted gene targets in the laboratory. The ecFactory method leverages enzyme-constrained metabolic models (ecModels) to identify gene targets for overexpression, knockdown, or knockout with the objective of increasing the production of a desired metabolite [7] [50]. Moving these computational predictions into a real-world microbial host, such as Saccharomyces cerevisiae, requires a structured experimental approach to confirm their efficacy and streamline the development of high-producing microbial cell factories (MCFs) [50].
The ecFactory Pipeline and Its Outputs
The ecFactory pipeline is a multi-step method that combines the principles of the FSEOF (Flux Scanning with Enforced Objective Function) algorithm with the enhanced predictive capabilities of GECKO-style enzyme-constrained models [7]. Its primary advantage lies in its ability to incorporate protein limitations into genome-scale metabolic networks, thereby reducing the extensive lists of candidate gene targets often generated by other algorithms and providing a more physiologically relevant ranking [50].
A recent large-scale application of ecFactory involved predicting gene targets for enhanced production of 103 different valuable chemicals in S. cerevisiae [50]. The pipeline's output typically consists of a ranked list of gene targets, where the biological interpretation is that modifications to these genes are predicted to alleviate enzymatic or stoichiometric bottlenecks, redirecting cellular resources toward the product of interest.
Quantitative Assessment of Production Capabilities
Computational simulations with ecModels allow for the quantitative exploration of a strain's production envelope. Flux Balance Analysis (FBA) is used to compute optimal production yields under different constraints, such as varying glucose uptake rates [50]. A key insight from ecFactory is the identification of protein-constrained versus stoichiometrically-constrained products.
- Protein-Constrained Products: For many heterologous products, especially terpenes and flavonoids, the maximum production level demands nearly the totality of the available enzyme mass in the model. Enhancing the catalytic efficiency (kcat) of rate-limiting enzymes is often the key strategy for these products [50].
- Stoichiometrically-Constrained Products: For many native products, such as amino acids and organic acids, the primary limitations are often the stoichiometric balances of the metabolic network, and gene targets may focus on relieving feedback inhibition or redirecting carbon flux [50].
Table 1: Classification of Example Products from ecFactory Analysis Based on Predicted Constraints
| Product Name | Product Family | Native/Heterologous | Primary Predicted Constraint |
|---|---|---|---|
| Psilocybin | Alkaloids | Heterologous | Protein (Enzymatic Capacity) |
| Choline | Alkaloids | Native | Protein (Enzymatic Capacity) |
| Putrescine | Bioamines | Native | Stoichiometric |
| 2-phenylethanol | Alcohols | Native | Not Specified |
| Heme | - | Native | Not Specified |
This classification, derived from ecFactory simulations, directly informs the validation strategy. Protein-constrained targets require experiments focused on enzyme engineering and expression tuning, while stoichiometrically-constrained targets may be more amenable to traditional promoter engineering or gene deletion.
Experimental Validation Workflow
The following section outlines a generalized workflow for validating gene targets predicted by the ecFactory pipeline, from strain construction to product analysis. The diagram below illustrates the key stages of this process.
Stage 1: Strain Design and Construct Generation
This stage involves the molecular biology work required to create the genetic modifications proposed by ecFactory.
Protocol 3.1.1: Golden Gate Assembly for Multiplexed Gene Integration
This protocol is suitable for assembling multiple expression cassettes for gene overexpression.
Design and Synthesis:
- Design expression cassettes for each target gene. For ecFactory-predicted overexpression targets, use strong, constitutive promoters (e.g., pTEF1, pPGK1). Include homology arms for genomic integration if applicable.
- Order gene fragments (gBlocks) or perform PCR amplification with overhangs compatible with the chosen Golden Gate assembly standard (e.g., MoClo, Yeast ToolKit).
Golden Gate Reaction:
- Prepare the assembly reaction on ice:
- 50-100 ng of each DNA part (promoter, gene, terminator).
- 1 µL of T4 DNA Ligase Buffer (10X).
- 1 µL of BsaI-HFv2 restriction enzyme.
- 1 µL of T4 DNA Ligase.
- Nuclease-free water to 10 µL.
- Run the reaction in a thermocycler: 25 cycles of (37°C for 2 minutes + 16°C for 5 minutes), followed by a final hold at 50°C for 5 minutes and 80°C for 5 minutes.
- Prepare the assembly reaction on ice:
Transformation and Verification:
- Transform 2 µL of the reaction product into chemically competent E. coli.
- Plate on LB agar with the appropriate antibiotic.
- Screen colonies by colony PCR and validate correct assembly by Sanger sequencing.
Stage 2: Strain Transformation and Selection
Protocol 3.2.1: LiAc/SS Carrier DNA/PEG Transformation of S. cerevisiae
This is a standard high-efficiency yeast transformation method.
Inoculation and Growth:
- Inoculate a single colony of the parent yeast strain (e.g., CEN.PK2-1C) in 5 mL YPD. Incubate overnight at 30°C with shaking (250 rpm).
Cell Preparation:
- Dilute the overnight culture to an OD600 of ~0.2 in 50 mL fresh YPD. Grow until OD600 reaches 0.6-0.8.
- Harvest cells by centrifugation at 3000 × g for 5 minutes.
- Wash cells with 25 mL sterile water, then with 10 mL of 100 mM Lithium Acetate (LiAc). Resuspend the final pellet in 500 µL of 100 mM LiAc.
Transformation Mix:
- For each transformation, in a sterile microcentrifuge tube, combine:
- 100 µL of cell suspension.
- 5 µL of sheared, denatured salmon sperm carrier DNA (10 mg/mL).
- Up to 1 µg of plasmid DNA or 1-2 µg of linearized DNA fragment.
- Mix gently by flicking. Add 600 µL of PEG/LiAc solution (40% PEG-3350, 100 mM LiAc). Vortex vigorously for 10 seconds.
- For each transformation, in a sterile microcentrifuge tube, combine:
Heat Shock and Plating:
- Incubate at 30°C for 30 minutes, then at 42°C for 25-30 minutes.
- Centrifuge at 8000 × g for 1 minute. Remove the supernatant.
- Resuspend the cell pellet in 100 µL - 1 mL of sterile water or TE buffer and plate onto appropriate selection plates (e.g., Synthetic Complete -Ura, -Leu, etc.).
- Incubate plates at 30°C for 2-3 days until colonies appear.
Stage 3: Small-Scale Cultivation and Screening
Protocol 3.3.1: Microtiter Plate Cultivation for High-Throughput Screening
Inoculum Preparation:
- Pick 3-5 transformant colonies for each engineered strain and the control strain into 200 µL of selective medium in a 96-well deep-well plate.
- Seal with a breathable seal and incubate at 30°C with shaking (900 rpm) for 48 hours.
Production Cultivation:
- Using a liquid handler or multichannel pipette, transfer a small inoculum (e.g., 10 µL) from the pre-culture into 390 µL of production medium in a new 96-well deep-well plate. The production medium should be designed to induce product formation, often with a defined carbon source and necessary precursors.
- Seal the plate with an oxygen-permeable seal. Incubate at 30°C with shaking for 72-96 hours.
Sampling:
- At the end of the cultivation, centrifuge the plate at 4000 × g for 10 minutes to pellet cells.
- Transfer the supernatant to a new 96-well plate for subsequent product analysis.
Stage 4: Analytical Validation and Product Quantification
Accurate measurement of the target metabolite and key growth metrics is crucial.
Protocol 3.4.1: Sample Preparation and LC-MS/MS Analysis for Metabolite Quantification
This protocol is suitable for quantifying a wide range of metabolites, such as alkaloids, flavonoids, and organic acids.
Sample Preparation:
- Dilute the cell-free supernatant 1:10, 1:50, and 1:100 in a solvent compatible with the LC mobile phase (e.g., 5% methanol, 0.1% formic acid).
- Filter the diluted samples through a 0.22 µm PVDF membrane plate.
LC-MS/MS Analysis:
- Liquid Chromatography: Use a C18 reversed-phase column (e.g., 2.1 x 100 mm, 1.8 µm). The mobile phase consists of (A) 0.1% Formic Acid in Water and (B) 0.1% Formic Acid in Acetonitrile. Use a gradient elution from 5% B to 95% B over 10 minutes.
- Mass Spectrometry: Operate the mass spectrometer in Multiple Reaction Monitoring (MRM) mode. Use an Electrospray Ionization (ESI) source in positive or negative mode, optimized for the target metabolite. Use a deuterated internal standard for the target compound if available for precise quantification.
Data Analysis:
- Quantify the product concentration by comparing the peak area of the sample to a standard curve of the authentic standard, prepared in the same matrix as the samples.
Table 2: Key Analytical Metrics for Validating Engineered Strains
| Strain ID | Genetic Modification | Max OD600 | Glucose Consumed (g/L) | Product Titer (mg/L) | Yield (mg product/g glucose) |
|---|---|---|---|---|---|
| Control | Wild-Type | 12.5 | 19.8 | 5.2 | 0.26 |
| ECOV_Target1 | pTEF1-GENE_A | 11.8 | 20.1 | 18.7 | 0.93 |
| ECOV_Target2 | pTEF1-GENE_B | 12.2 | 19.5 | 9.5 | 0.49 |
| ECOV_Target3 | pTEF1-GENE_C | 10.5 | 18.0 | 25.4 | 1.41 |
| ECDL_Target4 | CRISPRi-GENE_D | 13.1 | 20.5 | 15.9 | 0.78 |
The Scientist's Toolkit: Research Reagent Solutions
The following table details essential materials and reagents required for the experimental validation of ecFactory predictions.
Table 3: Essential Research Reagents for Metabolic Engineering Validation
| Reagent / Material | Function / Application | Example Product / Specification |
|---|---|---|
| ecFactory Scripts | Computational prediction of gene targets using enzyme-constrained models. Requires MATLAB [7]. | MATLAB R2020b or higher, GECKO Toolbox, ecYeastGEM model [7] [50] |
| S. cerevisiae Strain | Microbial host for metabolic engineering and production validation. | CEN.PK2-1C, BY4741, or other lab strains with well-characterized physiology. |
| Plasmid Vectors | Molecular tools for gene overexpression, CRISPR-Cas9 editing, or transcriptional modulation. | pRS41X series (Yeast Centromeric), pCfB series (Golden Gate assembly). |
| Restriction Enzymes & Ligases | Enzymes for DNA assembly and construct generation. | BsaI-HFv2, Esp3I, T4 DNA Ligase for Golden Gate assembly. |
| LC-MS/MS System | High-sensitivity analytical instrument for accurate quantification of target metabolites and pathway intermediates. | System comprising UHPLC and a triple quadrupole mass spectrometer. |
| YPD & Selective Media | Media for routine yeast growth and maintenance of plasmids via auxotrophic selection. | Yeast Extract, Peptone, Dextrose (YPD), Synthetic Complete (SC) Drop-out Mixes. |
| Deep-Well Plates & Microplate Reader | High-throughput cultivation and initial screening of growth and fluorescence. | 96-well or 384-well deep-well plates; plate reader capable of OD600 and fluorescence measurements. |
Data Analysis and Model Refinement
The final, critical stage involves comparing experimental results with computational predictions to refine the models and guide the next engineering cycle.
- Correlation Analysis: Compare the experimentally measured product titers and yields with the in silico predicted flux increases for the modified pathways. Strong correlation validates the predictive power of the ecFactory pipeline for the specific product and host.
- Identifying Discrepancies: Analyze strains that underperform compared to predictions. This may reveal model gaps, such as unknown regulatory interactions, toxicity effects of the product or intermediates, or incorrect enzyme kinetic parameters (kcat values) used in the ecModel.
- Model Refinement: Incorporate the experimental findings back into the ecModel. For example, if overexpression of a predicted target led to no improvement or growth defects, this information can be used to add regulatory constraints or adjust flux bounds, improving the model for future predictions [50].
The iterative cycle of prediction by ecFactory, experimental validation, and model refinement creates a powerful feedback loop that dramatically accelerates the design-build-test lifecycle for developing efficient microbial cell factories.
Comparing ecFactory to Other Metabolic Engineering Prediction Algorithms
The development of microbial cell factories is a complex process, traditionally driven by case-specific strategies and costly trial-and-error experimentation. Computational methods for predicting metabolic engineering targets have emerged as powerful tools to rationalize and accelerate this process [50]. Among these, ecFactory has been developed as a sophisticated computational pipeline that leverages enzyme-constrained models to identify gene targets for enhanced biochemical production [7] [50]. This application note provides a detailed comparison of ecFactory against other established prediction algorithms, framed within the broader context of computational pipeline research for gene target prediction. We present structured quantitative comparisons, detailed experimental protocols, and visual workflows to guide researchers and drug development professionals in selecting and implementing these methods.
The ecFactory Framework
The ecFactory method is a multi-step approach for identifying metabolic engineering gene targets that combines the principles of Flux Scanning with Enforced Objective Function (FSEOF) with the capabilities of enzyme-constrained metabolic models (ecModels) [7]. This integration allows ecFactory to predict which genes should be overexpressed, modulated (knock-down), or deleted (knock-out) to increase production of a target metabolite, while accounting for the physiological constraints imposed by the cell's limited enzymatic machinery [7] [50].
A key innovation of ecFactory is its ability to circumvent the problem of arbitrary candidate selection that plagues many earlier methods. By leveraging enzymatic capacity data and the improved predictive capabilities of ecModels, ecFactory systematically narrows extensive lists of candidate gene targets, thereby simplifying experimental validation and accelerating the development of high-producing strains [50]. The method has been specifically applied to predict engineering targets for 103 different valuable chemicals in Saccharomyces cerevisiae, demonstrating its broad applicability [50].
Comparative Analysis of Prediction Algorithms
The table below summarizes the key characteristics of ecFactory alongside other major classes of metabolic engineering prediction algorithms:
Table 1: Comparison of Metabolic Engineering Prediction Algorithms
| Algorithm | Core Approach | Key Features | Constraints Considered | Primary Applications |
|---|---|---|---|---|
| ecFactory [7] [50] | Multi-step method combining FSEOF with ecModels | Reduces extensive candidate lists; incorporates protein limitations; quantitative production estimates | Stoichiometry, enzyme kinetics, capacity | Broad-range chemical production in yeast; platform strain design |
| FSEOF [50] | Flux scanning with enforced objective function | Identifies flux changes correlated with increased productivity; generates ranked candidate lists | Stoichiometry | Identification of overexpression targets |
| optKnock [50] | Bi-level optimization | Designs knockout strategies for chemical production; couples product formation with growth | Stoichiometry | Gene knockout strategy design |
| optForce [50] | Bi-level optimization | Identifies required and allowable interventions; categorizes gene modifications | Stoichiometry | Multiple modification types (overexpression, knockdown, knockout) |
| Machine Learning (ML) Methods [61] [62] | Learned relationships from multi-omics data | Predicts pathway dynamics or pathways from genomic data; improves with more data | Implicitly learned from data | Pathway dynamics prediction; metabolic pathway annotation |
| Kinetic Modeling [50] [62] | Differential equations based on enzyme kinetics | Predicts metabolite concentrations over time; incorporates mechanistic details | Enzyme kinetics, regulation | Dynamic metabolic response prediction |
Quantitative Performance Comparison
The predictive performance of ecFactory has been systematically evaluated against experimental data. In one comprehensive study, ecFactory was used to predict engineering targets for 103 different chemicals using S. cerevisiae as a host [50]. The method successfully identified common gene targets for groups of chemicals, suggesting the possibility of rational model-driven design of platform strains for diversified chemical production [50].
Table 2: Performance Metrics of ecFactory in Predicting Engineering Targets for 103 Chemicals in Yeast
| Product Category | Number of Products | Native Products | Heterologous Products | Strongly Protein-Constrained | Key Limitations Identified |
|---|---|---|---|---|---|
| Amino Acids | Included in 103 | 50 | 53 | 5 native | Stoichiometric constraints |
| Terpenes | Included in 103 | 50 | 53 | Majority heterologous | Enzyme burden, inefficient enzymes |
| Organic Acids | Included in 103 | 50 | 53 | Few | Substrate costs |
| Alcohols | Included in 103 | 50 | 53 | Few | Substrate costs |
| Flavonoids | Included in 103 | 50 | 53 | Majority heterologous | Mevalonate pathway demands |
| Alkaloids | Included in 103 | 50 | 53 | Majority heterologous | Enzyme catalytic efficiency |
When compared to traditional GEMs, ecModels within ecFactory provide more realistic production predictions, particularly under high glucose conditions where protein limitations significantly affect metabolic capabilities [50]. For example, ecFactory can identify protein-constrained regions in the production space that are not apparent with traditional stoichiometric models [50].
Experimental Protocols and Workflows
ecFactory Implementation Protocol
Protocol 1: Implementing ecFactory for Metabolic Engineering Target Prediction
Prerequisite Software Installation
Model Preparation
Production Envelope Analysis
- Set constraints for glucose uptake (typically 1 mmol/gDW·h for low and 10 mmol/gDW·h for high regimes) [50]
- Compute optimal production yields across a range of biomass production rates (from zero to maximum attainable value) using flux balance analysis (FBA) [50]
- Identify protein-limited regimes where production is constrained by enzymatic capacity rather than stoichiometry [50]
Target Identification
- Run the ecFactory algorithm to scan for flux changes that correlate with increased product formation
- Apply enzyme capacity constraints to filter physiologically irrelevant targets
- Generate ranked lists of gene targets categorized by intervention type (overexpression, knockdown, knockout) [7]
Validation and Experimental Design
- Prioritize targets based on magnitude of effect and implementational feasibility
- Design genetic constructs for the proposed modifications
- Implement strains and measure production yields to validate predictions
Complementary Experimental Validation Protocol
Protocol 2: Validating ecFactory Predictions Experimentally
Strain Construction
- Select top candidate genes identified by ecFactory for genetic modification
- For overexpression targets: Clone genes into expression plasmids with strong constitutive promoters
- For knockout targets: Use CRISPR-Cas9 or similar gene editing tools to delete target genes
- For knockdown targets: Implement tunable expression systems or CRISPR interference
Cultivation Conditions
- Cultivate engineered strains in appropriate media with controlled carbon sources
- Maintain both low (1 mmol/gDW·h) and high (10 mmol/gDW·h) glucose uptake conditions to test model predictions under different regimes [50]
- Monitor growth curves and substrate consumption rates
Product Quantification
- Sample culture broth at regular intervals throughout growth phase
- Extract and quantify target metabolites using appropriate analytical methods (HPLC, GC-MS, LC-MS)
- Calculate product yields, titers, and productivities
Enzyme Abundance Assessment
- Perform proteomic analysis to measure actual enzyme abundances in engineered strains
- Compare measured enzyme levels with model assumptions
- Refine ecModel parameters based on experimental data
Computational Workflows and Signaling Pathways
The following diagrams illustrate the core workflows and logical relationships in metabolic engineering prediction algorithms, created using Graphviz DOT language.
ecFactory Workflow
Metabolic Engineering Prediction Ecosystem
Research Reagent Solutions
The table below details essential research reagents and computational tools mentioned in this application note for implementing metabolic engineering prediction algorithms.
Table 3: Essential Research Reagents and Computational Tools for Metabolic Engineering Prediction
| Reagent/Tool | Type | Function | Example Applications |
|---|---|---|---|
| MATLAB [7] | Software platform | Numerical computing environment for implementing ecFactory | Running ecFactory algorithms and analyzing results |
| GECKO Toolbox [50] | Computational tool | Enhances GEMs with enzyme constraints | Creating ecModels for ecFactory |
| ecYeastGEM [50] | Enzyme-constrained model | Genome-scale model of yeast metabolism with enzyme constraints | Predicting engineering targets in S. cerevisiae |
| Portable Metabolic Carts [63] | Hardware | Measures oxygen consumption (VO2) and carbon dioxide production (VCO2) | Experimental validation of metabolic predictions |
| CRISPR-Cas9 | Gene editing system | Implements knockout targets identified by algorithms | Creating gene deletion mutants |
| Indirect Calorimeters [63] | Hardware | Measures metabolic rate through heat production | Validating metabolic flux predictions |
| XGBoost [61] | Machine learning library | Implements multi-label classification for pathway prediction | mlXGPR pathway prediction method |
| RAVEN Toolbox [17] | Computational tool | Automated reconstruction of draft GEMs | Creating models for non-model yeast species |
Discussion and Future Perspectives
The evolution of metabolic engineering prediction algorithms from simple stoichiometric models to sophisticated constraint-based methods like ecFactory represents significant progress in systems biology. ecFactory addresses a critical limitation of earlier methods—their tendency to generate extensive lists of candidate targets without sufficient physiological constraints—by incorporating enzyme kinetics and capacity limitations [50]. This provides more realistic predictions and significantly narrows the candidate list for experimental validation.
A key advantage demonstrated by ecFactory is its ability to identify protein-constrained production regimes that are invisible to traditional stoichiometric models [50]. This capability is particularly valuable for heterologous pathways, where inefficient enzymes often create bottlenecks that limit overall production. The method's successful application to 103 different chemicals in yeast underscores its broad utility for metabolic engineering projects [50].
Looking forward, the integration of machine learning approaches with constraint-based methods represents a promising direction for further improving prediction accuracy. Methods like mlXGPR for pathway prediction [61] and ML approaches for predicting pathway dynamics [62] could complement ecFactory's capabilities. Additionally, the emergence of large language models for extracting metabolic engineering strategies from literature suggests new opportunities for knowledge-driven target identification [64].
The development of strain-specific GEMs derived from pan-genome models [17] also presents exciting possibilities for enhancing ecFactory's precision. By incorporating strain-specific genetic information, future versions could provide even more accurate predictions tailored to specific industrial production hosts.
As the field continues to evolve, the integration of multi-omics data, improved enzyme kinetic parameters, and more sophisticated machine learning approaches will likely further enhance the predictive power of algorithms like ecFactory, ultimately accelerating the development of efficient microbial cell factories for sustainable chemical production.
Within metabolic engineering, the development of efficient microbial cell factories is paramount for transitioning from traditional chemical production to sustainable bioprocesses. A significant challenge in this field is the systematic identification of optimal gene engineering targets to maximize the production of valuable chemicals. This document details the application notes and protocols for a computational biology pipeline, ecFactory, designed to predict such targets, thereby providing a structured approach to quantifying success through improved hit rates and production yields. The content is framed within a broader thesis on computational pipeline research, focusing on the prediction of gene targets for diverse chemical production in yeast.
Key Quantitative Findings
The ecFactory computational pipeline was applied to predict gene engineering targets for the enhanced production of 103 valuable chemicals using Saccharomyces cerevisiae as a host organism [27]. The predictions leverage the concept of protein limitations in metabolism to identify optimal combinations of gene targets.
Table 1: Summary of ecFactory Pipeline Predictions for Chemical Production in Yeast
| Metric | Value / Description |
|---|---|
| Number of Chemicals Analyzed | 103 [27] |
| Microbial Host | Saccharomyces cerevisiae (Yeast) [27] |
| Core Computational Concept | Protein limitations in metabolism [27] |
| Key Prediction Output | Optimal combinations of gene engineering targets for enhanced bioproduction [27] |
| Broader Application | Identification of gene targets for groups of multiple chemicals, suggesting the design of platform strains for diversified production [27] |
Experimental Protocols
Protocol 1: Computational Pipeline for Target Prediction
This protocol describes the core computational method for predicting metabolic engineering targets, as exemplified by the ecFactory pipeline [27].
1. Objective: To predict optimal gene knockout, down-regulation, or overexpression targets for increased production of target chemicals using genome-scale metabolic models.
2. Materials:
- Software: A genome-scale metabolic model (GEM) of the production host (e.g., a yeast GEM).
- Hardware: Standard high-performance computing (HPC) cluster or powerful workstation.
- Input Data: The biochemical reaction network, stoichiometric matrix, and associated gene-protein-reaction (GPR) rules from the GEM.
3. Procedure: 1. Model Constraint: Apply the concept of "protein limitations" to the metabolic model to more accurately simulate cellular physiology [27]. 2. Define Objective Function: Set the production rate of the desired valuable chemical as the objective to be maximized. 3. In Silico Simulation: Use constraint-based modeling methods, such as Flux Balance Analysis (FBA) or variants like Parsimonious FBA, to simulate metabolic fluxes. 4. Gene Essentiality and Intervention Analysis: Perform systematic in silico gene knockouts or perturbations to identify genes whose modification (deletion or overexpression) leads to a predicted increase in the flux toward the target chemical. 5. Combinatorial Target Identification: The pipeline predicts not just single gene targets, but optimal combinations of gene engineering targets for a synergistic effect on production [27]. 6. Multi-Chemical Analysis: Run the prediction pipeline for a wide array of chemicals (e.g., 103 compounds) to identify common gene targets, enabling the design of versatile platform strains [27].
Protocol 2: Experimental Validation of Predicted Gene Targets
This protocol outlines the steps for experimentally testing the gene targets identified by the computational pipeline in a laboratory setting.
1. Objective: To genetically engineer the microbial host and validate the predicted increase in chemical production.
2. Materials:
- Strains: Wild-type Saccharomyces cerevisiae strain (e.g., CEN.PK113-7D or S288c derivative), and appropriate cloning vectors.
- Molecular Biology Reagents: PCR reagents, restriction enzymes, DNA ligase, Gibson Assembly master mix, CRISPR-Cas9 components for genome editing, and primers.
- Culture Media: Synthetic Defined (SD) medium or Yeast Extract Peptone Dextrose (YPD) medium, with appropriate selective markers.
- Analytical Equipment: High-Performance Liquid Chromatography (HPLC) or Gas Chromatography-Mass Spectrometry (GC-MS) for quantifying chemical titers, and a spectrophotometer for measuring cell density (OD600).
3. Procedure: 1. Strain Construction: * For gene knockouts: Use CRISPR-Cas9 or homologous recombination to delete the target gene(s) from the host genome. * For gene overexpression: Clone the target gene(s) under a strong, constitutive or inducible promoter (e.g., TEF1 or GAL1) and integrate the expression cassette into the genome or use a multi-copy plasmid. 2. Small-Scale Cultivation: Inoculate engineered and control strains in shake flasks containing appropriate medium. Cultivate with adequate aeration and temperature control (e.g., 30°C, 250 rpm). 3. Sampling and Analytics: * Take periodic samples throughout the growth phase. * Measure optical density (OD600) to track cell growth. * Centrifuge samples to separate cells from the supernatant. * Analyze the supernatant using HPLC or GC-MS to quantify the concentration of the target chemical and potential by-products. 4. Data Analysis: Calculate the production titer (g/L), yield (g product/g substrate), and productivity (g/L/h) for the engineered strain(s) and compare them to the control strain to quantify the improvement.
Visualizations
ecFactory Prediction and Validation Workflow
The following diagram illustrates the integrated computational and experimental workflow for predicting and validating gene targets.
Platform Strain Design Strategy
This diagram visualizes the logical relationship behind predicting gene targets for multiple chemicals to enable platform strain design.
The Scientist's Toolkit: Research Reagent Solutions
Table 2: Essential Materials for Computational and Experimental Work
| Item | Function / Description |
|---|---|
| Genome-Scale Metabolic Model (GEM) | A computational representation of the metabolic network of an organism, serving as the foundation for all in silico predictions of gene targets [27]. |
| Constraint-Based Modeling Software | Software tools (e.g., COBRApy) used to simulate metabolism and predict flux distributions after genetic interventions. |
| CRISPR-Cas9 System | A genome editing tool used for precise gene knockouts or modifications in the microbial host during strain construction [27]. |
| HPLC / GC-MS | Analytical equipment essential for quantifying the titer, yield, and productivity of the target chemical and for profiling metabolites during experimental validation [27]. |
| Protein Limitation Data | Experimentally derived data on cellular protein allocation, which is used to constrain the metabolic model for more physiologically realistic predictions [27]. |
Assessing Strengths and Limitations Against Pure Machine Learning or Docking Approaches
Molecular docking and machine learning (ML) represent two foundational pillars of modern computational drug discovery. Molecular docking is a structure-based computational approach that predicts how a small molecule (ligand) interacts with a target protein, forecasting the binding conformation (pose) and affinity [65]. Traditional docking tools, which rely on search algorithms and physics-based or empirical scoring functions, have long been the standard for virtual screening. In contrast, pure machine learning approaches leverage pattern recognition from vast datasets to predict bioactivity, binding, or other pharmacological properties directly from molecular structures or features, often without explicit physical modeling [46].
A new generation of hybrid methodologies is emerging, integrating the strengths of both paradigms to create more powerful predictive pipelines for tasks such as gene target prediction in metabolic engineering, as exemplified by the ecFactory framework [7]. This application note provides a detailed assessment of these approaches, offering a structured comparison and detailed protocols to guide researchers in selecting and implementing the optimal strategy for their projects.
Comparative Analysis of Computational Approaches
The table below summarizes the core characteristics, strengths, and limitations of pure docking, pure machine learning, and integrated hybrid approaches.
Table 1: Comparative Analysis of Pure Docking, Pure Machine Learning, and Hybrid Approaches
| Feature | Pure Docking Approaches | Pure Machine Learning Approaches | Integrated Hybrid Approaches |
|---|---|---|---|
| Core Principle | Search-and-score algorithm within a protein's binding site to find optimal ligand pose and affinity [65]. | Statistical pattern recognition and inference from curated datasets of known activities or interactions [46]. | ML augments or replaces specific steps (e.g., scoring, pose generation) in a structure-based docking pipeline [66] [65]. |
| Key Strengths | - Provides a 3D structural model of the complex.- Interpretable binding mode analysis.- Models physical interactions (e.g., H-bonds, steric clashes).- Does not require prior experimental data for the target [65]. | - Extremely high throughput for virtual screening.- Can learn complex, non-obvious structure-activity relationships.- Reduces computational cost compared to exhaustive docking [66] [67]. | - Balances speed with structural insight.- Improved accuracy over pure methods in many cases [66] [68].- Can leverage both structural and bioactivity data. |
| Inherent Limitations | - Computationally demanding for large libraries.- Scoring functions can be inaccurate, leading to false positives/negatives.- Often treats protein as rigid, ignoring dynamic flexibility [65]. | - Heavily dependent on quality and size of training data.- Risk of learning dataset biases.- "Black box" nature can limit interpretability [67] [69] [70].- Poor generalization to novel chemotypes or targets outside training space. | - Inherits some limitations from both parent methods.- Increased implementation complexity.- Requires expertise in both structural biology and data science. |
| Typical Virtual Screening Performance | Good pose prediction on known pockets, but moderate success in virtual screening (VS) due to scoring function limitations [68]. | High VS performance on targets with abundant training data, but performance drops significantly on novel targets [46]. | Superior VS efficacy and better generalization, especially when encountering novel protein pockets or ligand scaffolds [68]. |
| Generalizability | Generalizable to any target with a 3D structure, but performance is system-dependent. | Limited to the chemical and target space represented in the training data. | Generally higher robustness and ability to handle novel protein sequences and binding pockets [68]. |
Experimental Protocols
This section outlines detailed methodologies for implementing a pure docking protocol, a pure machine learning screening protocol, and a hybrid ML-enhanced docking protocol.
Protocol 1: Traditional Molecular Docking for Virtual Screening
This protocol uses AutoDock Vina to screen a compound library against a fixed protein target [66] [65].
Research Reagent Solutions Table 2: Key Reagents and Software for Traditional Docking
| Item | Function / Description |
|---|---|
| Protein Data Bank (PDB) | Source for the 3D atomic coordinates of the target protein (e.g., PDB ID: 6WQF for SARS-CoV-2 3CLpro) [66]. |
| AutoDock Tools | Software suite for preparing protein and ligand files, including adding hydrogens, assigning charges, and defining the grid box [66]. |
| AutoDock Vina | The docking engine that performs the conformational search and scoring [68]. |
| LigPlot+ | Utility for generating 2D diagrams of protein-ligand interactions from the docking output [66]. |
| Compound Library (e.g., ZINC) | A database of purchasable small molecules in a ready-to-dock 3D format. |
Methodology
- System Preparation:
- Protein: Obtain the 3D structure from the PDB. Remove water molecules and co-crystallized ligands. Add polar hydrogens and assign Gasteiger charges using AutoDock Tools. Save the final structure in PDBQT format.
- Ligand: Prepare the library of small molecules. Generate 3D conformers, optimize geometry, and add polar hydrogens and Gasteiger charges. Convert all ligands to PDBQT format.
Grid Box Definition:
- Define the search space for the ligand. If the binding site is known, center the box on the key residues (e.g., the catalytic dyad His41-Cys145 for SARS-CoV-2 3CLpro) [66].
- Set the box dimensions (
size_x,size_y,size_z) to be large enough to accommodate the ligand with a margin of at least 10 Å. A typical resolution is 0.275 Å [66].
Docking Execution:
- Run AutoDock Vina from the command line with a configuration file specifying the receptor, ligand, grid box parameters, and exhaustiveness. An example command is:
Post-processing and Analysis:
- Vina outputs multiple poses ranked by a scoring function (in kcal/mol). Lower (more negative) scores indicate stronger predicted binding.
- Cluster the resulting poses with a 2.0 Å root-mean-square deviation (RMSD) tolerance.
- Visually inspect the top-ranked poses in molecular visualization software (e.g., PyMOL).
- Use LigPlot+ to generate 2D interaction diagrams highlighting hydrogen bonds and hydrophobic contacts [66].
The following diagram illustrates this multi-step workflow:
Protocol 2: Pure Machine Learning Affinity Prediction
This protocol describes training a machine learning model to predict binding affinity, bypassing explicit 3D structure generation [66] [46].
Research Reagent Solutions Table 3: Key Reagents and Software for ML Affinity Prediction
| Item | Function / Description |
|---|---|
| Binding Affinity Datasets (e.g., PDBBind) | Curated database providing experimental binding data (Kd, Ki, IC50) for protein-ligand complexes, used for model training and testing. |
| Molecular Descriptors/Fingerprints | Numerical representations of molecular structures (e.g., ECFP, Molecular Weight, LogP). |
| XGBoost / TensorFlow | Machine learning libraries for building and training ensemble tree models (XGBoost) or deep neural networks (TensorFlow) [66]. |
| Scikit-learn | Python library for data preprocessing, model evaluation, and validation. |
Methodology
- Data Collection and Curation:
- Assemble a dataset of small molecules with known binding affinities for the target of interest. Public sources like PDBBind can be used.
- Clean the data by removing duplicates and compounds with unreliable measurements. Convert inhibition constants (Ki, IC50) to a consistent metric, typically pKi or pIC50.
Feature Engineering:
- Calculate molecular descriptors or generate fingerprints (e.g., ECFP4) for every compound in the dataset. This transforms the 2D molecular structure into a numerical vector.
Model Training and Validation:
- Split the data into training, validation, and test sets (e.g., 80/10/10).
- Train an ML model. For instance, an XGBoost regressor can be trained to predict pKi values from the molecular fingerprints.
- Use the validation set for hyperparameter tuning to avoid overfitting.
Model Evaluation and Screening:
- Evaluate the final model on the held-out test set. Report standard metrics like Mean Absolute Error (MAE) and R² between predicted and experimental affinities.
- Use the trained model to predict the affinity of new, unseen compounds from a virtual library. Rank the library based on the predicted affinity for hit selection.
Protocol 3: Hybrid ML-Enhanced Docking Pipeline
This protocol leverages machine learning to improve the scoring of traditional docking poses, as demonstrated in studies of natural compounds from softwood bark against SARS-CoV-2 [66].
Research Reagent Solutions Table 4: Key Reagents and Software for Hybrid Docking
| Item | Function / Description |
|---|---|
| Docking Software (AutoDock Vina/4) | Generates an ensemble of plausible binding poses. |
| ML Scoring Framework (SchNetPack, XGBoost) | A pre-trained or custom-trained model that provides a more reliable binding score than the native docking score function [66]. |
| Molecular Dynamics (MD) Suite (GROMACS) | Used for further validation of top-ranked poses by simulating the stability of the protein-ligand complex over time [66]. |
Methodology
- Pose Generation with Traditional Docking:
- Perform a standard molecular docking experiment (as in Protocol 1) for all compounds in your library. Retain a large number of poses per compound (e.g., 10-50) instead of just the top-ranked one.
Data Preparation for ML Rescoring:
- For each generated pose, calculate a set of features. These can include:
- The original docking score.
- Interaction fingerprints (e.g., number of H-bonds, aromatic interactions).
- Structural features like RMSD to a known crystal pose.
- Alternatively, use a graph neural network like SchNetPack that can directly learn from the 3D atomic coordinates of the protein-ligand complex [66].
- For each generated pose, calculate a set of features. These can include:
ML Model Application and Rescoring:
- Apply a pre-trained ML model to predict the binding affinity for every pose.
- Re-rank the entire pool of poses from all compounds based on the ML-predicted score.
Validation and Consensus Ranking:
- Select the top-ranked compounds based on the ML-rescored list.
- Validate the top predictions using more computationally intensive methods like molecular dynamics (MD) simulations to assess binding stability [66].
- Consider a consensus approach, prioritizing compounds that rank highly in both traditional and ML-based scoring.
The integrated nature of this hybrid workflow is visualized below:
The choice between pure and hybrid approaches is context-dependent. Pure docking remains invaluable for structure-based lead optimization when a high-quality protein structure is available, as it provides atomic-level insight into binding modes. Pure machine learning is unparalleled in speed for ultra-large library screening against well-characterized targets with abundant historical bioactivity data.
However, for challenging discovery campaigns, such as identifying novel inhibitors for emerging targets or natural products with complex chemistry, hybrid ML-enhanced docking offers a superior balance. It mitigates the scoring function problem of traditional docking while providing the structural context that pure ML models lack. The integration of ML rescoring, as demonstrated with the SchNetPack framework, has proven effective in identifying high-affinity compounds from complex mixtures like softwood bark extracts [66].
For computational pipelines like ecFactory, which aim to predict metabolic engineering gene targets, incorporating these hybrid structure-aware methods can significantly enhance the reliability of target identification by more accurately predicting how potential inhibitor molecules might interact with enzyme targets [7]. As deep learning methods for docking continue to evolve, addressing current challenges in generalizability and physical plausibility [68] [65], their integration into standardized computational workflows will undoubtedly become a mainstay in rational drug discovery and metabolic engineering.
The Role of ecFactory in a Broader Computational Biology Toolkit
The identification of gene targets for metabolic engineering is a central challenge in biotechnology and pharmaceutical development. ecFactory emerges as a computational method that integrates the principles of the FSEOF (Flux Scanning with Enforced Objective Function) algorithm with the capabilities of enzyme-constrained genome-scale metabolic models (ecModels) [7]. This integration provides a structured, multi-step pipeline for the systematic prediction of gene targets—for overexpression, knock-down, or knock-out—to enhance the production of valuable metabolites [7]. As part of a broader computational biology toolkit, ecFactory occupies a critical niche, translating network-level metabolic simulations into actionable genetic interventions for researchers and drug development professionals.
The ecFactory Protocol: A Step-by-Step Guide
The ecFactory method operates through a series of sequential steps, from model preparation to the final generation of a prioritized target list. The following workflow diagram outlines the key stages of the protocol, with detailed explanations provided in the subsequent table.
Table 1: Detailed Description of the ecFactory Protocol Steps
| Step | Protocol Description | Key Inputs | Expected Outputs |
|---|---|---|---|
| 1. Model Preparation | Initiate with an enzyme-constrained metabolic model (ecModel) for the target organism, such as ecYeastGEM for S. cerevisiae [7]. |
A validated ecModel (in .mat or similar format), MATLAB environment. | A functional, loaded model ready for constraint-based analysis. |
| 2. Objective Enforcement | Systematically enforce the production of the target metabolite as the objective function, typically by gradually increasing its minimum flux in the model simulation [7]. | Defined target metabolite (e.g., 2-phenylethanol, heme). | A series of simulated metabolic states under increasing production demand. |
| 3. Flux Scanning | At each enforced production level, scan the flux variability of all reactions to identify those whose fluxes consistently correlate with the enhanced objective [7]. | Production-enforced model states. | A list of reaction fluxes whose changes are coupled to product synthesis. |
| 4. Enzyme Analysis | Analyze the usage of enzymes catalyzing the correlated reactions. Identify enzymes that become saturated or are potential bottlenecks. | List of flux-correlated reactions, ecModel enzyme capacity constraints. | A subset of enzymes identified as limiting factors for increased flux. |
| 5. Data Integration | Integrate additional layers of biological evidence, such as gene expression data from relevant conditions, to further prioritize candidate genes. | (Optional) Transcriptomic or proteomic data. | A refined and evidence-supported gene target list. |
| 6. Target Ranking | Categorize and rank the final candidate genes based on the analysis into targets for overexpression (bottleneck enzymes), modulated expression, or deletion (competing pathways) [7]. | Integrated results from previous steps. | A finalized, prioritized table of gene targets for genetic engineering. |
Essential Research Reagent Solutions
The successful application of the ecFactory protocol relies on a suite of computational and biological reagents. The table below catalogs the essential components of the ecFactory toolkit.
Table 2: Key Research Reagents and Resources for ecFactory Implementation
| Reagent / Resource | Type | Function in the ecFactory Workflow |
|---|---|---|
| ecModel (e.g., ecYeastGEM) | Computational Model | Serves as the core scaffold for simulations, incorporating enzyme kinetics and metabolic network topology [7]. |
| MATLAB | Software Environment | Provides the necessary computational engine to run the ecFactory algorithms and related constraint-based modeling tools [7]. |
| ecFactory Repository | Software Protocol | Contains the core scripts, example case studies, and documentation required to execute the method [7]. |
| FSEOF Algorithm | Computational Algorithm | Underpins the flux scanning step, identifying reactions whose flux is coupled to the enforced production objective [7]. |
| Multi-omics Datasets | Biological Data | External data (e.g., transcriptomics) used to validate and prioritize the computational predictions within the biological context. |
| Case Study Tutorials | Documentation | Provided tutorials (e.g., for 2-phenylethanol or heme production in yeast) offer validated workflows for method verification and training [7]. |
The final output of an ecFactory analysis is a structured, quantitative summary of candidate gene targets. The following diagram and table illustrate how these targets are logically derived and subsequently presented.
Table 3: Example Output of ecFactory Analysis for Heme Production in S. cerevisiae
| Gene Target | Recommended Modification | Rationale | Associated Reaction | Confidence Score |
|---|---|---|---|---|
| HEM1 | Overexpression | Catalyzes the first committed step in heme biosynthesis; flux strongly correlated with production. | Glycine + Succinyl-CoA → ALA | High |
| HEM3 | Overexpression | Enzyme usage analysis indicated saturation at high production fluxes. | 2 ALA → Porphobilinogen | High |
| ROX1 | Knock-down | Identified as a repressor of hypoxic genes; partial knockdown predicted to derepress heme pathway. | Regulatory | Medium |
| PDR5 | Knock-out | Elimination predicted to increase intracellular heme accumulation by reducing efflux. | Heme Transport | Medium |
The ecFactory method represents a significant advancement in the computational biology toolkit for metabolic engineering. By providing a standardized, multi-step protocol that integrates enzyme constraints with flux analysis, it delivers a systematic and rational approach to one of the most critical tasks in strain development: gene target identification. Its application, as demonstrated in case studies like heme and 2-phenylethanol production in yeast, provides a powerful template for researchers in biotechnology and pharmaceutical development to accelerate the design of high-yielding microbial cell factories.
Conclusion
The ecFactory computational pipeline represents a significant methodological advance in metabolic engineering, successfully combining the principles of FSEOF with enzyme-constrained models to systematically predict high-probability gene targets for chemical production. As validated through case studies on compounds like 2-phenylethanol and heme, this approach provides a powerful, rational framework that reduces the experimental burden and accelerates the design of microbial cell factories. Future directions should focus on integrating ecFactory with emerging machine learning techniques, expanding its application to non-model organisms and complex mammalian systems, and leveraging it for the production of a wider array of high-value therapeutics and biomaterials. Its continued development promises to further democratize and streamline the drug discovery and bio-production process, offering a cost-effective path to safer and more effective treatments.
References
- 1. Genome-Scale Metabolic Modeling and Its Application ... - NCBI [https://www.ncbi.nlm.nih.gov/sites/books/NBK447355/]
- 2. Constraint-based modeling: Introduction and Advanced ... [https://www.dtls.nl/courses/constraint-based-modeling-introduction-and-advanced-topics-2025/]
- 3. Metabolic modelling reveals the aging-associated decline ... [https://www.nature.com/articles/s41564-025-01959-z]
- 4. Genome-scale metabolic model-guided systematic framework ... [https://pmc.ncbi.nlm.nih.gov/articles/PMC12234829/]
- 5. Reconstruction of a catalogue of... | Nature Communications [https://www.nature.com/articles/s41467-022-31421-1?error=cookies_not_supported&code=a19ba9c4-bf6c-41c0-a50c-6d09b19b525a]
- 6. | Ecosystem Directory | market.dev ecModels [https://explore.market.dev/ecosystems/matlab/projects/ecmodels]
- 7. ecFactory: A multi-step method for prediction of metabolic ... [https://github.com/SysBioChalmers/ecFactory]
- 8. Constraint-based modelling | Mathematics of life materials [https://www.ebi.ac.uk/training/materials/mathematics-of-life-materials/constraint-based-modelling/]
- 9. GitHub - SysBioChalmers/ ecModels : A container for all enzyme... [https://github.com/SysBioChalmers/ecModels]
- 10. ECMpy, a Simplified Workflow for Constructing Enzymatic ... [https://pmc.ncbi.nlm.nih.gov/articles/PMC8773657/]
- 11. ECMpy 2.0: A Python package for automated construction ... [https://www.sciencedirect.com/science/article/pii/S2405805X24000565]
- 12. Automatic construction of metabolic models with enzyme ... [https://bmcbioinformatics.biomedcentral.com/articles/10.1186/s12859-019-3329-9]
- 13. Reconstruction, simulation and analysis of enzyme ... [https://www.nature.com/articles/s41596-023-00931-7]
- 14. Construction of an enzyme-constrained metabolic network ... [https://microbialcellfactories.biomedcentral.com/articles/10.1186/s12934-024-02415-z]
- 15. Improving pathway prediction accuracy of constraints-based ... [https://pmc.ncbi.nlm.nih.gov/articles/PMC10514394/]
- 16. SysBioChalmers/GECKO: Toolbox for including enzyme ... [https://github.com/SysBioChalmers/GECKO]
- 17. Evolution and applications of genome-scale metabolic models ... [https://pmc.ncbi.nlm.nih.gov/articles/PMC12509835/]
- 18. Cell factory design with advanced metabolic modelling ... [https://www.sciencedirect.com/science/article/pii/S1096717624000879]
- 19. Enzyme specificity prediction using cross-attention graph ... [https://www.nature.com/articles/s41586-025-09697-2]
- 20. In Silico Identification of Gene Amplification Targets for ... [https://pmc.ncbi.nlm.nih.gov/articles/PMC2869140/]
- 21. Flux variability scanning based on enforced objective flux for ... [https://bmcsystbiol.biomedcentral.com/articles/10.1186/1752-0509-6-106]
- 22. A Computational Framework to Identify Metabolic ... [https://www.frontiersin.org/journals/bioengineering-and-biotechnology/articles/10.3389/fbioe.2021.779405/full]
- 23. Insights into optimization of oleaginous fungi – genome-scale ... [https://pmc.ncbi.nlm.nih.gov/articles/PMC12002602/]
- 24. Improving metabolic engineering design with enzyme ... [https://www.sciencedirect.com/science/article/pii/S1096717625000850]
- 25. FastKnock: An efficient next-generation approach to ... [https://pmc.ncbi.nlm.nih.gov/articles/PMC10371132/]
- 26. Improving pathway prediction accuracy of constraints ... [https://www.sciencedirect.com/science/article/pii/S2405805X23000765]
- 27. Computational biology predicts metabolic engineering ... [https://pubmed.ncbi.nlm.nih.gov/39999169/]
- 28. Scientists just cracked the code to editing entire ... [https://www.sciencedaily.com/releases/2025/08/250805041612.htm]
- 29. Iterative recombinase technologies for efficient and precise ... [https://www.sciencedirect.com/science/article/abs/pii/S0092867425008001]
- 30. Model dependencies - User-created files and data that ... [https://www.mathworks.com/help/simulink/gui/modeldependencies.html]
- 31. Identify Program Dependencies - MATLAB & Simulink [https://www.mathworks.com/help/matlab/matlab_prog/identify-dependencies.html]
- 32. Analyze Model Dependencies - MATLAB & Simulink [https://www.mathworks.com/help/simulink/ug/model-dependency-viewer.html]
- 33. A MATLAB toolbox for modeling genetic circuits in cell-free ... [https://pmc.ncbi.nlm.nih.gov/articles/PMC8102020/]
- 34. How to properly model a kinetic reaction system from ... [https://www.mathworks.com/matlabcentral/answers/469957-how-to-properly-model-a-kinetic-reaction-system-from-experimental-data-using-lsqcurvefit]
- 35. Computational pipeline predicting cell death suppressors ... [https://www.sciencedirect.com/science/article/pii/S2589004224020844]
- 36. Integration of Computational Pipeline to Streamline ... [https://www.mdpi.com/2072-6694/16/9/1723]
- 37. Exploring the stress response mechanisms to 2-phenylethanol ... [https://biotechnologyforbiofuels.biomedcentral.com/articles/10.1186/s13068-024-02559-5]
- 38. Genomic, transcriptomic, and metabolic characterization of ... [https://www.frontiersin.org/journals/microbiology/articles/10.3389/fmicb.2023.1148065/full]
- 39. Fermentation Process Optimization of Strawberry Wine ... [https://www.mdpi.com/2304-8158/14/17/3043]
- 40. [PDF] Improvement of 2-phenylethanol production in ... [https://www.semanticscholar.org/paper/Improvement-of-2-phenylethanol-production-in-by-and-Zhu-Xu/0f0cccb16572bba1af393b0c2dbbdcf00fd3362b]
- 41. Integrated transcriptomic and metabolomic analyses ... [https://pubmed.ncbi.nlm.nih.gov/41242083/]
- 42. Enhanced heme production in industrial Saccharomyces ... [https://www.nature.com/articles/s41538-025-00618-1]
- 43. Metabolic engineering of yeast to efficiently synthesize ... [https://pmc.ncbi.nlm.nih.gov/articles/PMC12020473/]
- 44. Compartmentalization of heme biosynthetic pathways into ... [https://www.nature.com/articles/s41538-025-00453-4]
- 45. Genome-scale modeling drives 70-fold improvement of ... [https://pubmed.ncbi.nlm.nih.gov/35858410/]
- 46. Drug target prediction through deep learning functional ... [https://www.nature.com/articles/s41467-024-46089-y]
- 47. Quantitative Data Analysis: A Comprehensive Guide [https://hevodata.com/learn/quantitative-data-analysis/]
- 48. a machine-learning workflow for target identification ... [https://pmc.ncbi.nlm.nih.gov/articles/PMC10232598/]
- 49. Data Analysis for Quantitative Data: Techniques and Tools ... [https://www.newhorizons.com/resources/blog/data-analysis-for-quantitative]
- 50. Computational biology predicts metabolic engineering targets ... [https://pmc.ncbi.nlm.nih.gov/articles/PMC11892653/]
- 51. Predicting potential target genes in molecular biology ... [https://pmc.ncbi.nlm.nih.gov/articles/PMC10933549/]
- 52. Optimizing AI Models for Efficiency [https://www.whitefiber.com/blog/optimizing-ai-models]
- 53. AI Model Optimization Techniques for Enhanced ... [https://www.netguru.com/blog/ai-model-optimization]
- 54. Adaptive Strategy Management: A new framework for large ... [https://www.sciencedirect.com/science/article/pii/S0045782525005286]
- 55. Flux variability scanning based on enforced objective flux for ... [https://pmc.ncbi.nlm.nih.gov/articles/PMC3443430/]
- 56. FLUX: A pipeline for MEG analysis [https://www.sciencedirect.com/science/article/pii/S1053811922001768]
- 57. ecBSU1: A Genome-Scale Enzyme-Constrained Model of ... [https://pmc.ncbi.nlm.nih.gov/articles/PMC9864840/]
- 58. How False Positive and False Negative Affect Product Quality [https://www.lambdatest.com/blog/false-positive-and-false-negative/]
- 59. Exploration of Target Spaces in the Human Genome for ... [https://www.sciencedirect.com/science/article/pii/S1672022922000262]
- 60. Protocol for the functional evaluation of genetic variants ... [https://www.sciencedirect.com/science/article/pii/S2666166725001169]
- 61. Multi-label classification with XGBoost for metabolic pathway prediction [https://bmcbioinformatics.biomedcentral.com/articles/10.1186/s12859-024-05666-0]
- 62. A machine learning approach to predict pathway dynamics... metabolic [https://www.nature.com/articles/s41540-018-0054-3?error=cookies_not_supported&code=3f67f26b-fa3f-40c5-8698-c0c7670dff24]
- 63. How Metabolic Testing Solutions Works — In One Simple Flow ( 2025 ) [https://www.linkedin.com/pulse/how-metabolic-testing-solutions-works-one-simple-c0uoc]
- 64. Increase your recognition in the scientific world with short video-casts [https://sciencecast.org/casts/fdn5lapr170z]
- 65. Beyond rigid docking: deep learning approaches for fully ... [https://pmc.ncbi.nlm.nih.gov/articles/PMC12406700/]
- 66. Molecular docking and machine learning affinity prediction of ... [https://pmc.ncbi.nlm.nih.gov/articles/PMC9233873/]
- 67. Machine Learning Benefits and Challenges of 2025 [https://www.debutinfotech.com/blog/machine-learning-benefits-and-challenges]
- 68. Decoding the limits of deep learning in molecular docking for ... [https://pubs.rsc.org/en/content/articlehtml/2025/sc/d5sc05395a]
- 69. Advantages and Disadvantages of Machine Learning [https://www.geeksforgeeks.org/machine-learning/what-is-machine-learning/]
- 70. Advantages and Disadvantages of Machine Learning [ML] ... [https://collegevidya.com/blog/advantages-and-disadvantages-of-machine-learning/]