Engineering Robust Microbial Cell Factories: Strategies for Enhanced Performance and Stability in Industrial Bioprocesses
This article provides a comprehensive analysis of contemporary strategies to enhance the robustness of microbial cell factories, a critical determinant for successful industrial-scale bioproduction.
Engineering Robust Microbial Cell Factories: Strategies for Enhanced Performance and Stability in Industrial Bioprocesses
Abstract
This article provides a comprehensive analysis of contemporary strategies to enhance the robustness of microbial cell factories, a critical determinant for successful industrial-scale bioproduction. Tailored for researchers, scientists, and drug development professionals, we explore the foundational principles of microbial robustness and its distinction from mere tolerance. The review systematically covers advanced engineering methodologies—including transcription factor engineering, membrane engineering, and dynamic pathway control—and addresses central challenges such as the growth-production trade-off and genetic instability. Further, we examine rigorous quantification techniques for validating robustness and present comparative analyses of strain performance. By synthesizing knowledge-based, computational, and evolutionary approaches, this work serves as a strategic guide for developing next-generation, resilient microbial systems for efficient and predictable manufacturing of biofuels, pharmaceuticals, and fine chemicals.
Defining Microbial Robustness: The Cornerstone of Predictable Industrial Bioproduction
In the development of advanced microbial cell factories (MCFs), strain robustness and tolerance are critical performance characteristics, yet they are often incorrectly used interchangeably in industrial microbiology [1] [2]. This distinction is not merely semantic but fundamental to predicting how a strain will perform when scaled from controlled laboratory conditions to industrial bioprocesses. Robustness refers to the ability of a microbial strain to maintain stable production performance (titer, yield, and productivity) despite experiencing various genetic, metabolic, or environmental perturbations [1] [2]. In contrast, tolerance describes the capacity of cells to grow or survive when exposed to single or multiple stresses, typically measured through growth-related parameters like viability or specific growth rate [1]. Understanding this distinction is crucial for designing MCFs that deliver consistent, high-level production in industrial environments characterized by unpredictable fluctuations.
Theoretical Framework: Defining the Concepts
Core Definitions and Distinctions
The performance of microbial cell factories under stress conditions can be categorized into two complementary but distinct concepts:
- Robustness: A systems-level property reflecting the phenotypic stability of a strain. A robust strain maintains constant production metrics (titer, yield, productivity) when faced with diverse perturbations encountered in scale-up bioprocesses [1] [2]. Robustness encompasses performance stability beyond mere survival.
- Tolerance: A survival-focused characteristic indicating cellular ability to withstand stress conditions. It is primarily concerned with growth maintenance or survival under single or multiple perturbations and does not guarantee sustained production capacity [1].
Table 1: Key Characteristics Differentiating Microbial Robustness and Tolerance
| Feature | Robustness | Tolerance |
|---|---|---|
| Primary Focus | Stability of production performance | Cellular survival and growth |
| Key Metrics | Titer, yield, productivity maintenance | Specific growth rate, viability |
| Scope | Systems-level property | Often stress-specific |
| Industrial Relevance | Predictable production in variable conditions | Survival under specific stress conditions |
| Genetic Basis | Often polygenic, involving global regulators | Can be specific to stress response pathways |
Conceptual Relationship
The relationship between robustness and tolerance can be visualized as a hierarchical framework where robustness represents a more comprehensive, systems-level property that incorporates but extends beyond tolerance. As noted in research on microbial cell factories, "strains with higher tolerance do not guarantee a higher yield, while the strain with higher robustness must have a higher tolerance" [1]. This establishes that robustness represents a more comprehensive characteristic that inherently requires a foundation of tolerance but adds the critical dimension of production stability.
Quantitative Evaluation Frameworks
Metrics and Assessment Protocols
Accurately distinguishing between robustness and tolerance requires specific quantitative frameworks and experimental approaches. The metrics used for each concept reflect their fundamentally different focuses in evaluating strain performance.
Table 2: Quantitative Metrics for Assessing Robustness vs. Tolerance
| Assessment Type | Robustness Metrics | Tolerance Metrics |
|---|---|---|
| Primary Parameters | Production titer stability, Yield consistency, Productivity maintenance | Specific growth rate (μ), Cell viability, Lethal concentration (LC50) |
| Temporal Metrics | Coefficient of variation in production over time, Performance half-life under stress | Lag phase duration, Growth recovery rate |
| Population Metrics | Population heterogeneity in production capacity, Plasmid stability in fermenters | Minimum inhibitory concentration (MIC), Death rate kinetics |
| Process Metrics | Performance predictability across scales, Consistency between batches | Survival rate under shock conditions, Adaptation speed |
Experimental Workflow for Concurrent Assessment
A comprehensive strain evaluation strategy should simultaneously measure both tolerance and robustness parameters to fully characterize industrial potential. The integrated protocol below enables researchers to distinguish between these characteristics experimentally.
Protocol: Concurrent Assessment of Tolerance and Robustness
Materials:
- Test microbial strain(s)
- Appropriate growth medium
- Stress-inducing compounds (e.g., ethanol, organic acids, inhibitors)
- Bioreactor or controlled culture system
- OD600 spectrophotometer or cell counter
- HPLC, GC-MS, or other product analytics
Procedure:
- Inoculum Preparation: Grow test strain overnight under optimal conditions.
- Experimental Setup: Divide culture into two treatment groups:
- Control Group: Maintained at optimal conditions throughout
- Stress Group: Exposed to predetermined stress conditions (e.g., pH shift, inhibitor addition, temperature change)
- Monitoring Phase: Sample cultures regularly over 24-72 hours:
- For Tolerance Assessment: Measure OD600, cell viability (CFU/mL), and calculate specific growth rates
- For Robustness Assessment: Analyze product titer, yield, and productivity
- Data Analysis:
- Calculate Tolerance Index = (Growth rate under stress / Growth rate under optimal conditions) × 100
- Calculate Robustness Coefficient = (Productivity under stress / Productivity under optimal conditions) × 100
Interpretation: Strains with high Tolerance Index but low Robustness Coefficient survive well but perform poorly under stress. Industrial applications require strains that maximize both parameters, with particular emphasis on Robustness Coefficient for production stability.
Engineering Strategies for Enhanced Robustness
Transcription Factor Engineering
Global Transcription Machinery Engineering (gTME) represents a powerful approach for enhancing robustness by reprogramming cellular responses to multiple stresses simultaneously. This method involves introducing mutations in generic transcription factors that control broad regulons, enabling multi-point regulation that can enhance stability under industrial conditions [1].
Protocol: Global Transcription Machinery Engineering for Robustness
Materials:
- EpPCR kit for random mutagenesis
- Plasmid library of mutated transcription factor genes
- Selection markers (antibiotics)
- Stress conditions for screening (e.g., ethanol, low pH, inhibitors)
Procedure:
- Library Construction:
- Amplify global transcription factor genes (e.g., rpoD in E. coli, SPT15 in S. cerevisiae) using error-prone PCR
- Clone mutated genes into appropriate expression vectors
- Transformation and Selection:
- Introduce plasmid library into host strain
- Plate transformants on stress-containing media (e.g., 60 g/L ethanol for E. coli, 6% v/v ethanol for S. cerevisiae)
- Screening:
- Isolate colonies showing improved growth under stress conditions
- Evaluate production performance of selected mutants under fluctuating conditions
- Validation:
- Measure robustness coefficients of promising mutants
- Sequence mutated transcription factors to identify beneficial mutations
Application Example: Engineering the housekeeping sigma factor δ70 in E. coli improved tolerance to 60 g/L ethanol and high concentrations of SDS, while resulting in a high yield of lycopene, demonstrating enhanced robustness [1].
Membrane and Transporter Engineering
Cellular membranes serve as primary interfaces with the environment, and their engineering can significantly enhance robustness by maintaining functional integrity under stress conditions. Membrane engineering focuses on modifying lipid composition to improve integrity, regulate mobility, and control permeability [1].
Protocol: Membrane Lipid Engineering for Robustness
Materials:
- Genes for fatty acid desaturases (e.g., OLE1 from S. cerevisiae)
- Genes for elongases (e.g., rELO2)
- cis-trans isomerase genes (e.g., from Pseudomonas aeruginosa)
- Fatty acid analysis equipment (GC-MS)
Procedure:
- Genetic Modification:
- Overexpress desaturase genes to increase unsaturated fatty acid content
- Express heterologous elongases or isomerases to modify membrane fluidity
- Membrane Analysis:
- Extract and analyze membrane lipids from engineered strains
- Calculate ratio of unsaturated to saturated fatty acids
- Robustness Testing:
- Challenge engineered strains with multiple stresses (ethanol, organic acids, temperature)
- Measure both growth parameters (tolerance) and production stability (robustness)
- Optimization:
- Fine-tune expression levels of membrane-modifying enzymes
- Combine multiple membrane engineering strategies for synergistic effects
Application Example: Overexpression of Δ9 desaturase Ole1 from S. cerevisiae increased the membrane oleic acid content and ratio of unsaturated to saturated fatty acids, improving tolerance to acid, NaCl, and ethanol stresses [1].
Adaptive Laboratory Evolution (ALE) for Robustness
Adaptive Laboratory Evolution applies selective pressure over multiple generations to enrich for mutants with enhanced robustness characteristics. Unlike targeted engineering, ALE can uncover novel robustness mechanisms through natural selection under simulated industrial conditions [3].
Case Study: Robustness Engineering in Yeast Platforms
Comparative Analysis of Yeast Chassis
The selection of microbial chassis with inherent robustness characteristics provides a foundation for engineering superior production strains. Recent research has highlighted the exceptional innate robustness of nonconventional yeasts like Pichia kudriavzevii compared to traditional Saccharomyces cerevisiae [4].
Table 3: Innate Stress Tolerance and Robustness Potential of Yeast Chassis
| Stress Factor | S. cerevisiae Performance | P. kudriavzevii Performance | Industrial Relevance |
|---|---|---|---|
| Low pH | Limited tolerance (pH ~3) | Exceptional tolerance (pH as low as 1.5) | Organic acid production, acidic fermentation |
| High Temperature | Moderate (up to 35-37°C) | High (up to 50°C) | Reduced cooling costs, contamination control |
| Inhibitors | Sensitive to furanics, phenolics | High tolerance to lignocellulosic inhibitors | Lignocellulosic biorefining |
| Ethanol | High tolerance | High tolerance | Biofuel production |
| Osmotic Stress | Moderate tolerance | High tolerance | High-gravity fermentations |
Protocol: Leveraging Innate Robustness in Nonconventional Yeasts
Materials:
- P. kudriavzevii strain (e.g., CABBI flagship strain)
- CRISPR-Cas9 genome editing system for nonconventional yeasts
- Lignocellulosic hydrolysate or synthetic inhibitor mix
- Low-pH fermentation media
Procedure:
- Strain Development:
- Engineer P. kudriavzevii with product pathways using adapted CRISPR-Cas9
- Integrate heterologous genes for target compound production
- Robustness Testing:
- Cultivate engineered strains in non-detoxified lignocellulosic hydrolysate
- Monitor production performance under progressively lower pH conditions
- Compare productivity stability with S. cerevisiae controls
- Process Optimization:
- Determine minimum need for pH adjustment during fermentation
- Evaluate reduction in byproduct formation (e.g., glycerol)
- Scale-Up Validation:
- Test robustness in bioreactors with variable feeding strategies
- Assess performance consistency across multiple batches
Application Insight: P. kudriavzevii has demonstrated the ability to produce succinic acid without neutralizer addition, leveraging its high innate acid tolerance to maintain stable production as pH drops during fermentation [4].
The Scientist's Toolkit: Essential Research Reagents
Table 4: Key Research Reagents for Robustness and Tolerance Studies
| Reagent/Category | Specific Examples | Function in Research | Application Context |
|---|---|---|---|
| Global Transcription Factors | rpoD (σ⁷⁰) in E. coli, SPT15 in S. cerevisiae | Reprogram cellular response to multiple stresses | gTME for multi-stress robustness |
| Membrane Modifiers | Ole1 desaturase, rELO2 elongase, cis-trans isomerase | Alter membrane fluidity and integrity | Enhancing tolerance to solvents, acids |
| Stress Reporting Systems | GFP-based biosensors, stress-responsive promoters | Quantify single-cell stress responses | Real-time monitoring of population heterogeneity |
| CRISPR Tools | Cas9, base editors, CRISPRi | Targeted genome engineering | Rapid integration of robustness features |
| Analytical Standards | Internal standards for metabolites, FAME standards | Quantify products and membrane composition | Robustness coefficient calculation |
| Evolutionary Selection | Automated ALE systems, chemostat arrays | Apply selective pressure for robustness | Uncovering novel robustness mechanisms |
The critical distinction between robustness and tolerance provides an essential framework for designing next-generation microbial cell factories. While tolerance focuses on survival under stress, robustness encompasses the preservation of production performance—a decisive factor for industrial viability. Engineering strategies that target global regulators, membrane properties, and employ adaptive evolution can significantly enhance robustness beyond basic tolerance. Moreover, selection of inherently robust chassis organisms like P. kudriavzevii provides a powerful foundation for constructing cell factories that maintain stable production under the variable and challenging conditions of industrial bioprocesses. As synthetic biology advances, explicitly designing for robustness rather than merely tolerance will be crucial for developing economically viable biomanufacturing platforms.
The pursuit of sustainable biomanufacturing using microbial cell factories is fundamentally challenged by the industrial perturbation space—a complex matrix of stressors ranging from internal metabolic toxicity to external large-scale environmental gradients. These perturbations, which include toxic intermediate metabolites, product toxicity, and variations in temperature, pH, and osmotic pressure, can significantly diminish production capacity and compromise process competitiveness [5]. Microbial robustness, defined as the ability of a microbial strain to maintain stable production performance (titers, yields, and productivity) despite various stochastic and predictable perturbations, has therefore emerged as a critical engineering target [6]. This Application Note establishes a structured framework to dissect this perturbation space, providing detailed protocols to quantify its impact and engineer superior robustness in industrial microorganisms, directly supporting advanced research within a thesis on microbial cell factory robustness.
Quantitative Profiling of the Perturbation Space
A critical first step is the systematic quantification of common industrial stressors and their synergistic effects on microbial physiology and production. The data in the table below summarizes key parameters for major perturbation categories.
Table 1: Characterization of Major Industrial Perturbations and Their Microbial Impacts
| Perturbation Category | Specific Stressors | Typical Experimental Range | Primary Microbial Impact | Common Measurement Assays |
|---|---|---|---|---|
| Metabolic Toxicity | End-products (e.g., ethanol, butanol), intermediate metabolites | 10-100 g/L for solvents [6] | Membrane integrity, protein denaturation, metabolic burden | Intracellular ATP, membrane potential, ROS assays |
| Chemical Environment | Low pH, high osmolarity, solvent concentrations | pH 4.5-6.5; 0.9 mol/L NaCl [6] | Cytoplasmic acidification, osmotic imbalance, oxidative stress | Intracellular pH, compatible solute quantification, CFU counts |
| Environmental Gradients (Field-Derived) | Temperature, soil moisture, microbiome variation | Seasonal temperature simulations [7] | Shifts in community structure and metabolic function [7] | 16S rRNA sequencing, Metabolomics (LC-MS) |
| Process-Induced Stress | Shear force, substrate gradients, nutrient limitation | Varies with bioreactor scale and design | Phenotypic heterogeneity, reduced specific growth rate | Flow cytometry, RNA-seq for transcriptomic analysis |
Application Note: Mapping an Organism's Perturbation Profile
Objective: To comprehensively characterize the tolerance and robustness of a microbial strain to a matrix of industrially relevant stressors, generating a quantitative "perturbation profile."
Background: Engineered microbial cells in the laboratory often do not account for the multiple disturbances encountered in industrial conditions, leading to poor performance upon scale-up. A systematic profiling of the host's response to these stressors is a prerequisite for targeted engineering [6] [5].
Experimental Protocol 1: High-Throughput Phenotypic Microarray
Summary: This protocol uses a plate-reader-based assay to monitor growth and production kinetics under a factorial combination of stressors.
Materials:
- Strain: The microbial strain of interest (e.g., E. coli, S. cerevisiae).
- Growth Media: Appropriate minimal or defined medium.
- Stress Stock Solutions: Prepare concentrated stocks of all stressors to be tested (e.g., ethanol, butanol, NaCl, organic acids, specific inhibitors).
- Equipment: Multimode plate reader with precise temperature control and shaking.
Procedure:
- Inoculum Preparation: Grow a seed culture overnight. Back-dilute into fresh medium and grow to mid-exponential phase (OD600 ~0.5-0.8).
- Plate Setup: In a 96-well deep-well plate, prepare a factorial matrix of stressor combinations using the stock solutions. Include a no-stress control.
- Dilution and Dispensing: Dilute the mid-exponential phase culture to a target starting OD600 of 0.05 in each well of the stress matrix. Transfer 200 µL of each condition to a clear 96-well assay plate. Cover with a breathable seal.
- Kinetic Measurement: Load the assay plate into the plate reader. Run the kinetic program for 24-48 hours with continuous shaking, measuring OD600 (biomass) and fluorescence/absorbance (for fluorescent products or reporter genes) every 15-30 minutes.
- Data Analysis: Calculate key parameters for each well:
- Maximum Growth Rate (µmax): Derived from the slope of the ln(OD600) vs. time plot.
- Final Biomass Yield: Maximum OD600 reached.
- Product Titer: Concentration of the target molecule at the end of fermentation.
Visualization of the experimental workflow and the cellular response to perturbations is provided below.
Application Note: Engineering Robustness via Transcription Factor Engineering
Objective: To enhance microbial robustness by engineering global or specific transcription factors that reprogram cellular metabolism and stress responses.
Background: Transcription factors (TFs) are key proteins that control the fine-tuning expression of target genes. Global Transcription Machinery Engineering (gTME) is a powerful non-rational approach that involves introducing mutations into generic transcription-related proteins (e.g., sigma factors in bacteria) to trigger the reprogramming of gene networks and cellular metabolism, leading to improved tolerance phenotypes [6] [5].
Experimental Protocol 2: Global Transcription Machinery Engineering (gTME)
Summary: This protocol involves creating mutant libraries of a global transcription factor and applying high-throughput selection to isolate variants conferring enhanced robustness.
Materials:
- Plasmid Vector: An expression plasmid harboring the gene for the target transcription factor (e.g., rpoD in E. coli).
- E. coli XL10-Gold or other high-efficiency cloning strains.
- Library Construction Reagents: Error-prone PCR kit, DpnI, T4 DNA Ligase.
- Selection Media: Agar plates containing the target stressor(s) at a predetermined inhibitory concentration.
Procedure:
- Library Generation:
- Perform error-prone PCR on the plasmid containing the TF gene to introduce random mutations.
- Digest the parent template with DpnI.
- Transform the mutated PCR product into a competent E. coli strain to generate a library of TF variants.
- Selection for Robustness:
- Plate the transformation output onto selection media containing the target stressor (e.g., 40 g/L ethanol, 0.9 mol/L NaCl). Also plate on non-selective media to determine library size and transformation efficiency.
- Incubate until colonies appear (typically 24-72 hours).
- Screening and Validation:
- Pick surviving colonies from the selective plates and inoculate into 96-deep well plates containing liquid media with and without the stressor.
- After 24-48 hours of growth, measure the final OD600 and the titer of the desired product.
- Identify clones that show superior growth and production under stress compared to the wild-type strain.
- Characterization:
- Sequence the TF gene in the best-performing clones to identify causative mutations.
- Re-transform the validated mutant TF plasmid into a fresh host strain to confirm the phenotype is linked to the TF variant.
Table 2: Key Transcription Factor Targets for Engineering Microbial Robustness
| Transcription Factor | Host Organism | Engineering Strategy | Resulting Phenotype | Citation (Example) |
|---|---|---|---|---|
| rpoD (σ⁷⁰) | E. coli | gTME (mutant library) | Improved tolerance to 60 g/L ethanol and high SDS; increased lycopene yield | [6] |
| CRP | E. coli | Overexpression of mutant (K52I/K130E) | Enhanced osmotic tolerance (0.9 mol/L NaCl) | [6] |
| irrE | E. coli | Heterologous expression from D. radiodurans | 10-100x improved tolerance to ethanol or butanol stress | [6] |
| Rpb7 | S. cerevisiae | gTME | 40% increase in ethanol titers under 10% (v/v) ethanol stress | [6] |
| Haa1 | S. cerevisiae | Overexpression of mutant Haa1S135F | Significantly improved acetic acid tolerance | [6] |
Application Note: Integrating Environmental Gradient Data for Predictive Modeling
Objective: To leverage environmental monitoring data to predict chemical fate and its impact on microbial communities, informing the design of more robust bioremediation strains or processes.
Background: Field studies demonstrate that seasonal environmental variations (e.g., temperature, moisture) significantly shift the soil bacterial community structure and function, with direct implications for the degradation of environmental chemicals like the herbicide 2,4-D [7]. Understanding these community-level responses to gradients provides a blueprint for designing strains that can maintain functionality in fluctuating environments.
Experimental Protocol 3: Field-Relevant Gradient Simulation in Bioreactors
Summary: This protocol simulates dynamic environmental conditions, derived from field data, in controlled bioreactors to test microbial community or strain robustness.
Materials:
- Field Data: Historical or real-time data on environmental parameters (e.g., temperature, pH) from a target site [7].
- Bioreactor System: Bench-scale bioreactors with advanced control for temperature, pH, and feed.
- Analytical Equipment: LC-MS/MS for quantifying parent compounds and transformation products (e.g., 2,4-D and 2,4-DCP) [7].
Procedure:
- Gradient Profile Definition: Based on field data [7], program the bioreactor controllers to mimic a realistic environmental gradient over time (e.g., a 72-hour diurnal temperature cycle).
- Inoculation and Monitoring: Inoculate the bioreactor with the microbial community or engineered strain of interest. Initiate the dynamic environmental profile.
- Sampling: Take periodic samples for:
- Chemical Analysis: Quantify the degradation of the target substrate (e.g., 2,4-D) and the formation of any transformation products (e.g., 2,4-DCP) using LC-MS/MS [7].
- Microbial Analysis: Extract DNA for 16S rRNA amplicon sequencing to track community dynamics, or RNA for transcriptomic analysis of an engineered strain.
- Data Integration: Correlate the abiotic parameters (temperature, pH) with biotic outcomes (degradation rate, community structure, gene expression) to build a predictive model of performance under real-world fluctuating conditions.
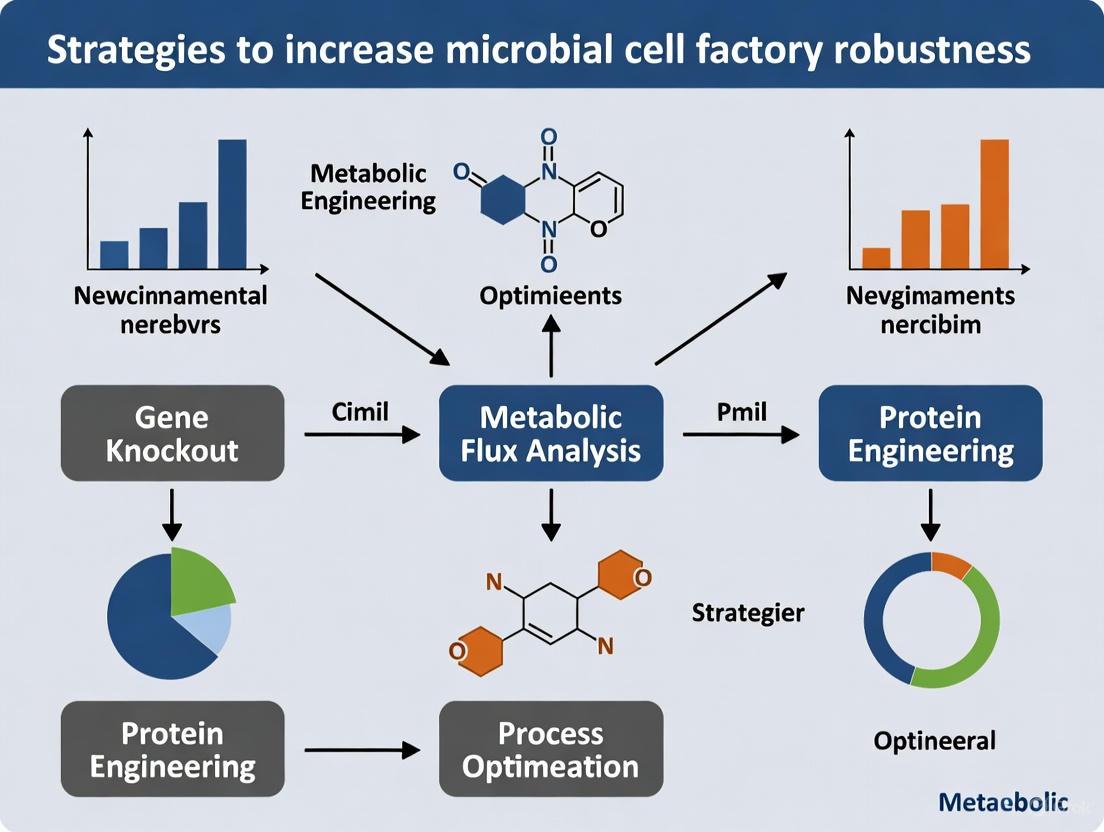
The diagram below illustrates the strategy for engineering robust microbial cells by targeting key cellular components.
The Scientist's Toolkit: Research Reagent Solutions
Table 3: Essential Reagents and Tools for Microbial Robustness Research
| Reagent / Tool | Function / Description | Example Use Case |
|---|---|---|
| Error-Prone PCR Kit | Generates random mutations in a target DNA sequence for directed evolution. | Creating mutant libraries of transcription factors (e.g., rpoD) in gTME [6]. |
| Host-Aware Kinetic Models | Multi-scale computational models simulating cell- and population-level dynamics in a batch culture. | Identifying optimal "medium-growth, medium-synthesis" operating points to maximize productivity [8]. |
| Pluripotent Stem Cell (PSC) Models | Human cell-based models (hESCs, hiPSCs) for predictive toxicology of metabolites or environmental chemicals [9]. | Assessing potential human health impacts of novel microbial-derived compounds in lieu of animal models. |
| RNA-seq Reagents | For whole-transcriptome analysis of microbial gene expression under different perturbation states. | Identifying key stress response pathways activated in engineered strains during industrial fermentation. |
| LC-MS/MS | Liquid Chromatography with Tandem Mass Spectrometry for sensitive quantification of small molecules. | Measuring degradation of substrates (e.g., 2,4-D) and accumulation of toxic transformation products (e.g., 2,4-DCP) [7]. |
| Self-Selecting Vector Systems | Enables high-throughput, autonomous screening of optimal genetic constructs from massive libraries. | Rapidly testing thousands of expression-level combinations predicted by host-aware models [8]. |
In the field of industrial biotechnology, a fundamental challenge persists: the inherent conflict between engineering microbial cell factories for high-level production and maintaining their inherent cellular fitness. This trade-off arises because the very stresses that enable high product titers, yields, and productivity—such as metabolic burden, intermediate or end product toxicity, and harsh industrial conditions—often simultaneously compromise key cellular functions like growth, viability, and stability [1]. The concept of microbial robustness has thus emerged as a critical research focus. Robustness is defined as the ability of a strain to maintain stable production performance (titer, yield, productivity) despite various genetic, metabolic, or environmental perturbations encountered during scale-up bioprocesses [1]. It is crucial to distinguish robustness from mere tolerance; while tolerance describes the ability to grow or survive under stress, robustness specifically guarantees consistent production performance under those conditions [1]. This application note, framed within a broader thesis on strategies to increase microbial cell factory robustness, analyzes this inevitable trade-off and provides detailed, actionable protocols to quantify, visualize, and mitigate it, equipping researchers and drug development professionals with the tools to design more resilient production systems.
Quantifying the Trade-off: Performance vs. Fitness Metrics
To systematically analyze the trade-off, it is essential to quantitatively monitor key performance indicators (KPIs) for both production and cellular fitness. The following metrics should be concurrently measured in engineered strains versus a baseline control (e.g., wild-type or non-producing strain) under standard and stress conditions.
Table 1: Key Metrics for Quantifying the Production-Fitness Trade-off
| Category | Metric | Description | Common Measurement Techniques |
|---|---|---|---|
| Production Performance | Maximum Theoretical Yield (Y_T) | The stoichiometric ceiling for converting a carbon source into a product [10]. | In silico calculation using Genome-Scale Metabolic Models (GEMs) [10]. |
| Titer | The concentration of the target product achieved in the fermentation broth (e.g., g/L) [1]. | HPLC, GC-MS, spectrophotometric assays. | |
| Productivity | The rate of product formation (e.g., g/L/h) [1]. | Calculated from titer over time. | |
| Carbon Efficiency | The effectiveness of channeling carbon from substrate to product [10]. | Mass balance analysis, isotopic tracing. | |
| Cellular Fitness | Specific Growth Rate (μ) | The exponential growth rate (h⁻¹), a primary indicator of metabolic health [1]. | Optical density (OD) measurements over time. |
| Final Biomass Yield | The maximum cell density achieved (e.g., OD₆₀₀ or gDCW/L). | OD or dry cell weight (DCW) measurement. | |
| Cell Viability | The percentage of living cells in a population. | Flow cytometry with viability stains (e.g., propidium iodide). | |
| Metabolic Burden | The redirection of resources from growth to product synthesis and heterologous gene expression. | Comparative transcriptomics/proteomics, reduced growth rate [1]. |
The data collected in Table 1 can be visualized as a "Trade-off Profile," where a strong negative correlation between, for example, product titer and specific growth rate, provides clear evidence of the conflict. Strains with improved robustness will show a profile closer to the high-production, high-fitness quadrant.
Detailed Experimental Protocols for Trade-off Analysis
Protocol 1: Cultivation and High-Throughput Phenotypic Screening
This protocol is designed to characterize the growth and production phenotypes of engineered strains under controlled conditions.
- Objective: To simultaneously measure microbial growth kinetics and product formation, identifying strains with superior robustness.
- Materials:
- Strains: Engineered production strain(s) and an appropriate control strain.
- Growth Media: Appropriate defined or complex medium (e.g., M9, LB) with required antibiotics.
- Equipment: Microplate reader capable of measuring OD and fluorescence (if applicable), deep-well plates, shaking incubator.
- Procedure:
- Inoculum Preparation: Pick single colonies from fresh plates to inoculate 3-5 mL of pre-culture medium. Grow overnight at the required temperature (e.g., 30°C or 37°C) with shaking (e.g., 220 rpm).
- Main Culture Dilution: Dilute the pre-culture in fresh medium to a target initial OD₆₀₀ of ~0.05 in a deep-well plate. Use a minimum of 200 µL culture per well. Include blanks with sterile medium.
- Cultivation and Monitoring: Seal the plate with a breathable membrane and place it in the pre-heated microplate reader. Set the protocol for continuous shaking and measure the OD₆₀₀ every 15-30 minutes for 24-48 hours. Maintain constant temperature.
- Sampling: At the end of the exponential phase and upon entry into the stationary phase, extract samples from designated wells for:
- Product Titer Analysis: Centrifuge samples (e.g., 13,000 rpm for 5 min) and analyze the supernatant using HPLC, GC-MS, or other relevant assays.
- Cell Viability: Use samples for flow cytometry analysis with a live/dead stain (e.g., SYTO 9/propidium iodide).
- Data Analysis:
- Calculate the specific growth rate (μ) from the linear region of the ln(OD) vs. time plot.
- Determine the maximum OD (proxy for biomass).
- Calculate productivity based on titer and cultivation time.
Protocol 2: Assessing Membrane Integrity Under Product Stress
A robust cell factory must maintain membrane integrity under industrial stress. This protocol assesses membrane damage caused by toxic products or substrates.
- Objective: To evaluate the impact of production stress on cell membrane integrity and function.
- Materials:
- Strains: As in Protocol 1.
- Reagents: PBS buffer, propidium iodide (PI) solution (e.g., 1 mg/mL), fluorescent membrane dye (e.g., FM 4-64 or Nile Red), target product or stressor (e.g., ethanol, organic acid).
- Equipment: Flow cytometer or fluorescence microscope, microcentrifuge.
- Procedure:
- Stress Exposure: Grow cultures as in Protocol 1 to mid-exponential phase. Split the culture and add a sub-lethal concentration of the target stressor (e.g., 3% v/v ethanol for alcohol tolerance tests) to the test culture, while adding an equal volume of solvent/PBS to the control. Incubate for a further 1-2 hours.
- Staining:
- For viability/membrane integrity: Pellet 1 mL of culture (5,000 rpm, 5 min). Resuspend in 1 mL PBS. Add PI to a final concentration of 1-5 µg/mL. Incubate in the dark for 15-30 minutes [1].
- For membrane fluidity/order: Use a lipophilic dye like Nile Red or FM 4-64 according to manufacturer protocols.
- Analysis:
- Flow Cytometry: Analyze at least 10,000 events per sample. For PI staining, excite with a 488 nm laser and collect emission through a 610/20 nm bandpass filter. A shift in the PI-positive population indicates loss of membrane integrity.
- Microscopy: Visualize cells to confirm uniform staining and observe morphological changes.
- Data Interpretation: A robust strain will show a significantly lower percentage of PI-positive cells after stress exposure compared to a sensitive control, indicating superior membrane integrity preservation.
Visualization of Engineering Strategies and Workflows
The following diagrams, generated using Graphviz DOT language, illustrate the core conflict and primary engineering strategies to enhance robustness.
The Core Conflict: Resource Competition
This diagram illustrates the fundamental trade-off where cellular resources are partitioned between native functions for fitness and engineered functions for production.
Multi-faceted Engineering for Robustness
This workflow outlines the key strategic pillars for engineering robust cell factories, moving beyond a single-gene approach.
Experimental Workflow for Robustness Engineering
This chart provides a practical roadmap for a research project aimed at identifying and developing more robust microbial cell factories.
The Scientist's Toolkit: Key Reagent Solutions
Successful engineering of robust cell factories relies on a suite of specialized reagents and tools. The following table details essential solutions for the featured experiments and strategies.
Table 2: Key Research Reagent Solutions for Robustness Engineering
| Reagent / Tool Category | Specific Examples | Function & Application in Robustness Research |
|---|---|---|
| Genetic Toolkits | CRISPR-Cas9 / CRISPRi systems [11] | Targeted gene knockout, knockdown (CRISPRi for essential genes like mreB or ftsZ in morphology engineering), and activation. |
| Plasmid vectors with inducible promoters | Controlled expression of heterologous pathways, transcription factors (e.g., IrrE, Haa1), or membrane desaturases (e.g., Ole1) [1]. | |
| Global Regulators & TFs | IrrE from Deinococcus radiodurans | A global transcription factor that, when expressed heterologously, can significantly enhance tolerance to solvents like ethanol and butanol in E. coli [1]. |
| Engineered sigma factor δ70 (rpoD) | Application in global Transcription Machinery Engineering (gTME) to improve lycopene yield and tolerance to ethanol and SDS in E. coli [1]. | |
| Haa1 in S. cerevisiae | A specific transcription factor that activates acetic acid-responsive genes; engineering Haa1 improves acetic acid tolerance [1]. | |
| Membrane Engineering Enzymes | Δ9 desaturase (Ole1) from S. cerevisiae | Increases the ratio of unsaturated to saturated fatty acids (UFA/SFA) in the membrane, improving tolerance to ethanol, acid, and other stresses [1]. |
| cis–trans isomerase (Cti) | Incorporates trans-unsaturated fatty acids into the membrane, altering membrane fluidity and stress resistance [1]. | |
| Selection & Screening Markers | Fluorescent proteins (GFP, RFP) | Reporters for promoter activity, gene expression levels, and rapid screening of engineered libraries. |
| Viability stains (Propidium Iodide, SYTO 9) | Differentiate between live and dead cells for flow cytometry or microscopy, directly assessing cellular fitness under stress (Protocol 2). | |
| Computational Resources | Genome-Scale Metabolic Models (GEMs) | In silico prediction of metabolic capabilities, maximum theoretical yields, and identification of engineering targets for over 235 bio-based chemicals [10]. |
| AI/Machine Learning Platforms | Data-driven prediction of protein function, optimization of metabolic pathways, and design of non-natural synthesis routes to circumvent native toxic pathways [12]. |
In the development of microbial cell factories (MCFs), achieving high performance in controlled laboratory conditions is a significant first step, but ensuring consistent performance under industrial fermentation conditions is the ultimate challenge. Microbial robustness is defined as the ability of a strain to maintain constant production performance—defined as titer, yield, and productivity—despite various genetic, environmental, and process-related perturbations [1] [6] [2]. This concept goes beyond simple tolerance or resistance, which relates primarily to survival or growth under stress. Instead, robustness encompasses the stability of the production phenotype, making it a critical determinant of economic viability in scale-up bioprocesses [2].
This Application Note outlines the core Key Performance Indicators (KPIs) used to quantify robustness and provides detailed protocols for their experimental determination. By integrating these measurements with modern strain engineering strategies, researchers can systematically develop more reliable and efficient biomanufacturing platforms.
Defining the Key Performance Indicators (KPIs)
The performance of a microbial cell factory is quantitatively assessed using three primary metrics. Their behavior under fluctuating conditions provides a direct measure of robustness.
- Titer: The concentration of the target product in the fermentation broth, typically expressed in grams per liter (g/L). A high titer is crucial as it directly reduces downstream processing costs and energy consumption [13].
- Yield: The efficiency of substrate conversion into the desired product. It is calculated as the mass of product formed per mass of substrate consumed (g product/g substrate). High yield indicates minimal carbon loss to byproducts or biomass.
- Productivity: The rate of product formation, defined as the total product formed per unit volume per unit time (g/L/h). This metric determines the production capacity and directly influences bioreactor sizing and capital expenditure.
The stability of these three metrics—when a strain can maintain its target titer, yield, and productivity across different scales, in the presence of inhibitors, or under varying pH and temperature—is the definitive signature of a robust microbial cell factory [1] [6].
KPI Relationships and Impact on Bioprocess Economics
The table below summarizes the core KPIs, their calculation, and their specific impact on process economics.
Table 1: Key Performance Indicators for Microbial Cell Factories
| KPI | Definition | Unit | Significance for Process Economics |
|---|---|---|---|
| Titer | Concentration of product in fermentation broth | g/L | High titer drastically reduces downstream separation and purification costs, water consumption, and environmental footprint [13]. |
| Yield | Mass of product formed per mass of substrate consumed | g product / g substrate | High yield maximizes raw material utilization, reduces feedstock costs, and minimizes waste generation. |
| Productivity | Amount of product formed per unit volume per unit time | g/L/h | High productivity increases bioreactor output, reducing capital expenditure (CAPEX) by requiring smaller reactors for the same annual production [14]. |
Experimental Protocols for Determining KPIs and Robustness
Accurate and consistent measurement of titer, yield, and productivity is foundational to assessing robustness. The following protocols describe standardized methodologies for their determination.
Protocol: Quantifying Titer, Yield, and Productivity in Batch Fermentation
Objective: To determine the fundamental performance metrics of a microbial cell factory under standard batch fermentation conditions.
Materials:
- Strain: Engineered microbial strain (e.g., E. coli, S. cerevisiae).
- Bioreactor: Bench-top fermenter with control for pH, temperature, and dissolved oxygen.
- Analytical Instrumentation: HPLC system with appropriate detectors (UV, RID) or GC-MS for product quantification.
Procedure:
- Inoculum Preparation: Inoculate a single colony into a seed culture medium. Incubate until the culture reaches the mid-exponential growth phase.
- Fermentation: Transfer the seed culture to the bioreactor containing the production medium. Maintain optimal process parameters (e.g., pH, temperature, aeration) throughout the run.
- Sampling: Aseptically withdraw samples at regular intervals (e.g., every 2-4 hours) for analysis.
- Analysis:
- Cell Density: Measure optical density (OD600) to track growth.
- Substrate Concentration: Quantify substrate (e.g., glucose) depletion using HPLC or enzymatic assay kits.
- Product Titer: Quantify product concentration using a calibrated HPLC or GC-MS method.
- Calculations:
- Maximum Titer: The highest product concentration recorded, typically at the end of fermentation.
- Yield: (Maximum Titer (g/L)) / (Initial Substrate Concentration - Final Substrate Concentration (g/L)).
- Productivity: Maximum Titer (g/L) / Total Fermentation Time (h).
Protocol: Assessing KPI Stability for Robustness Evaluation
Objective: To evaluate the stability of titer, yield, and productivity under simulated industrial perturbation stresses.
Materials:
- Stress Conditions: Prepared stock solutions for pH adjustment, ethanol, butanol, or osmotic agents (e.g., NaCl).
- Multi-well Plates: 24-deep well plates for high-throughput screening.
Procedure:
- Experimental Design: Prepare fermentation runs with controlled perturbations:
- Pulse Challenge: Introduce a single bolus of a stressor (e.g., 3% v/v ethanol) during the mid-exponential phase.
- Continuous Stress: Maintain a constant, sub-lethal level of stress throughout the fermentation (e.g., low pH or high osmolarity).
- Parallel Cultivation: Perform the controlled perturbation experiment in parallel with an unstressed control fermentation.
- Monitoring and Analysis: Sample and analyze all flasks/wells as described in Protocol 3.1 to determine titer, yield, and productivity under stress versus control conditions.
- Robustness Quantification:
- Calculate the % Performance Retention for each KPI:
% Retention = (KPI_stress / KPI_control) * 100 - A robust strain will exhibit high % retention across all three KPIs.
- Calculate the % Performance Retention for each KPI:
The logical workflow for designing and executing a robustness assessment is outlined below.
Strategies to Enhance Robustness and Stabilize KPIs
Several advanced metabolic engineering strategies directly target the stabilization of titer, yield, and productivity under industrial conditions.
Transcription Factor Engineering for Multi-Point Regulation
Engineering global transcription factors is a powerful method to reprogram cellular networks to be more resilient. Global Transcription Machinery Engineering (gTME) involves introducing mutations into generic transcription-related proteins (e.g., sigma factors in bacteria or TAFs in yeast) to alter the expression of numerous genes simultaneously [1] [6].
- Example: Engineering the housekeeping sigma factor δ70 (rpoD) in E. coli significantly improved tolerance to 60 g/L ethanol and high SDS concentrations, which was coupled with a high yield of lycopene [1] [6].
- Protocol: Create an error-prone PCR library of a global transcription factor gene (e.g., rpoD or spt15). Transform the library into the host strain and screen or select under the desired stress condition (e.g., high ethanol). Isolate mutants showing improved growth and validate for consistent KPI performance.
Membrane and Transporter Engineering
The cell membrane is the primary barrier against environmental stress. Engineering membrane composition enhances integrity and reduces permeability to inhibitory compounds [1].
- Example: Overexpression of Δ9 desaturase (OLE1) in S. cerevisiae increased the ratio of unsaturated to saturated fatty acids, improving tolerance to acid, NaCl, and ethanol [1].
- Protocol: Identify genes involved in fatty acid biosynthesis (e.g., fabA, fabB) or desaturation (e.g., OLE1). Overexpress or knock out these genes to modulate membrane fluidity. Assess robustness by measuring KPIs under solvent or acid stress.
Growth-Coupling Strategies
This strategy forces the cell to link product synthesis to growth, creating a strong selective pressure that stabilizes production and prevents loss-of-function mutations [14].
- Principle: By rewiring central metabolism, the synthesis of a precursor essential for growth is made dependent on the continued flux through the product synthesis pathway.
- Example: An E. coli strain was engineered for anthranilate production by disrupting native pyruvate-producing genes and expressing a feedback-resistant anthranilate synthase. This design coupled anthranilate production with pyruvate regeneration, essential for growth, leading to a 2-fold increase in product titers [14].
The diagram below illustrates the conceptual difference between a standard production pathway and a growth-coupled design.
The Scientist's Toolkit: Essential Research Reagents and Solutions
The following table lists key reagents and materials required for implementing the protocols and strategies described in this note.
Table 2: Key Research Reagent Solutions for Robustness Engineering
| Reagent / Material | Function / Application | Example Use Case |
|---|---|---|
| Error-Prone PCR Kit | Generation of mutant libraries for directed evolution. | Creating diversity in transcription factor genes for gTME [1]. |
| HPLC/GC-MS System | Quantitative analysis of substrate, product, and byproducts. | Precisely measuring titer and yield from fermentation samples [13]. |
| 24/48 Deep Well Plates | High-throughput cultivation under multiple conditions. | Parallel screening of strain libraries against various stress perturbations. |
| Stressors (e.g., Ethanol, Butanol, Organic Acids) | Simulating industrial fermentation stresses in lab-scale experiments. | Assessing KPI stability under product toxicity [1] [6]. |
| Plasmid Vectors for Overexpression | Delivering and expressing genes for membrane or pathway engineering. | Overexpressing OLE1 to alter membrane lipid composition [1]. |
| CRISPR-Cas9 Genome Editing System | Performing precise gene knock-outs, knock-ins, and edits. | Disrupting competing pathways or implementing growth-coupling designs [14]. |
Synthetic Biology and Metabolic Engineering Tools for Building Robust Hosts
Global Transcription Machinery Engineering (gTME) is an advanced metabolic engineering strategy that enhances microbial cell factory robustness by reprogramming cellular regulation at the transcriptional level. This approach involves engineering components of the global transcription machinery to elicit multigenic, complex phenotypes that are not readily accessible through traditional single-gene modifications [15]. In industrial bioprocessing, microbial cells constantly face perturbations from metabolic burden, pathway toxicity, and harsh environmental conditions, leading to decreased productivity and titer [1]. Strain robustness—the ability to maintain stable production performance despite these disturbances—is essential for reliable and sustainable bioproduction efficiency [1] [16]. gTME provides a powerful route to enhance this robustness by simultaneously modulating multiple cellular networks, enabling improved tolerance to industrial stresses while maintaining or even enhancing production capabilities [17] [15].
The fundamental principle of gTME centers on creating mutant libraries of transcription-related proteins, then screening for dominant mutant alleles that confer desired phenotypes such as improved product tolerance, substrate utilization, or environmental resistance [15]. This strategy moves beyond traditional pathway engineering by targeting the regulatory architecture that controls diverse cellular processes, thereby enabling coordinated optimization of complex traits that involve multiple genes and pathways [17].
Theoretical Foundation and Key Mechanisms
Core Principles of gTME
gTME operates on the premise that global transcription factors serve as master regulators controlling numerous cellular processes through hierarchical regulatory networks. In typical microbial systems, a relatively small number of global regulatory factors control large proportions of the genome. For instance, in E. coli, seven well-characterized global regulatory factors (CRP, IHF, FNR, ArcA, FIS, Lrp, and NarL) control over 50% of all genes [1]. By engineering these central regulators, gTME enables comprehensive reprogramming of gene expression patterns that can simultaneously address multiple limitations in industrial strains.
The strategy leverages the phenomenon that dominant mutations in global transcription factors can trigger widespread but coordinated changes in transcriptional networks, resulting in unique cellular phenotypes that would be difficult to achieve through sequential modification of individual genes [15]. This "multi-point regulation" provides a unique advantage for engineering complex traits where multiple cellular processes must be optimized in concert, such as balancing growth and production or coordinating stress response with metabolic flux [1].
Molecular Targets for gTME
Different microorganisms offer distinct targets for gTME implementation:
- In prokaryotic systems (e.g., E. coli): Engineering of sigma factors (σ70) and global regulators like CRP and IrrE
- In eukaryotic systems (e.g., S. cerevisiae): Engineering of TATA-binding protein Spt15 and transcription factor Taf25
- In unconventional hosts: Application in Yarrowia lipolytica, Lactobacillus plantarum, Rhodococcus ruber, and Zymomonas mobilis [17] [1]
The selection of appropriate targets depends on the host organism, desired phenotype, and understanding of the transcriptional regulatory network architecture. Successful implementation requires identification of transcription factors with broad regulatory influence that can be engineered to produce beneficial phenotypic changes without catastrophic fitness costs.
Experimental Protocols and Methodologies
General gTME Workflow
The following diagram illustrates the core gTME implementation workflow:
Detailed Protocol: gTME Implementation inS. cerevisiaevia Spt15 Engineering
Objective: Enhance ethanol tolerance and production in S. cerevisiae through Spt15 mutagenesis.
Materials and Reagents:
- S. cerevisiae strain (e.g., YPH499)
- Plasmid vector (e.g., pYX212)
- Primers for SPT15 gene amplification
- Error-prone PCR kit
- Transformation reagents
- Selection media (appropriate auxotrophic selection)
- Screening media with stressor (e.g., ethanol)
- Analytical equipment (HPLC, GC-MS for product quantification)
Procedure:
Library Generation:
- Amplify the SPT15 gene using error-prone PCR conditions optimized to achieve 1-3 mutations per kilobase [18] [15].
- Clone the mutated SPT15 genes into an appropriate expression vector under control of a constitutive promoter.
- Transform the mutant library into S. cerevisiae and plate on selective media to obtain approximately 10⁴-10⁵ independent transformants.
Selection and Screening:
- For improved ethanol tolerance: Screen transformants on solid media containing 4-6% (v/v) ethanol [18].
- For enhanced production: Employ product-specific screening assays or selection systems.
- For complex phenotypes: Use actual industrial substrates (e.g., corn cob hydrolysate) as sole carbon source [19].
- Isulate promising clones showing improved growth or production under selective conditions.
Validation and Characterization:
- Sequence mutated genes from selected clones to identify beneficial mutations.
- Characterize phenotypic improvements in batch fermentations under industrial-relevant conditions.
- Analyze transcriptomic profiles to understand regulatory reprogramming.
- Implement iterative cycles of mutagenesis and screening for additional improvements.
Key Parameters for Success:
- Library diversity and size
- Selection pressure stringency
- Screening methodology throughput and relevance
- Analytical methods for phenotype validation
Protocol Variations for Different Hosts
For E. coli:
- Target sigma factor σ70 (rpoD gene) or cAMP receptor protein (CRP)
- Screen for tolerance to biofuels (ethanol, butanol) or organic acids [1]
- Use stress-inducing compounds (e.g., SDS) as additional selection pressure
For Yarrowia lipolytica:
- Identify and target global transcription factors specific to oleaginous yeast
- Screen for improved lipid production or utilization of alternative carbon sources [17]
- Leverage well-developed culturing and analytical protocols for phenotype characterization
Applications and Performance Data
Quantitative Outcomes of gTME Implementation
Table 1: Documented Performance Improvements Achieved through gTME
| Host Organism | Engineering Target | Selection Pressure | Key Mutations | Performance Improvement | Reference |
|---|---|---|---|---|---|
| S. cerevisiae | Spt15 | 6% (v/v) ethanol | F177S, Y195H, K218R | Improved ethanol tolerance and production; more efficient glucose conversion to ethanol | [18] |
| S. cerevisiae | Spt15 | Corn cob acid hydrolysate | Not specified | 65.7% xylose utilization, 87.0% glucose utilization, 11.9 g/L ethanol production | [19] |
| E. coli | σ70 (rpoD) | 60 g/L ethanol, SDS | Not specified | Improved tolerance to ethanol and SDS; increased lycopene yield | [1] |
| E. coli | IrrE (from D. radiodurans) | Ethanol/butanol stress | Not specified | 10-100× improved tolerance to ethanol or butanol stress | [1] |
Application Spectrum for Robustness Enhancement
Table 2: gTME Applications for Enhancing Microbial Cell Factory Robustness
| Application Domain | Targeted Robustness Aspect | Representative Hosts | Key Outcomes |
|---|---|---|---|
| Biofuel production | Ethanol tolerance, inhibitor resistance | S. cerevisiae, Z. mobilis, E. coli | Improved growth and production under high ethanol conditions; enhanced utilization of lignocellulosic hydrolysates |
| Organic acid production | Low pH tolerance, end-product resistance | E. coli, Y. lipolytica, C. glutamicum | Enhanced acid tolerance enabling higher titers in non-neutralized conditions |
| Bioprocess optimization | Thermal stability, osmotic tolerance | Various industrial hosts | Improved performance under industrial-scale fermentation conditions |
| Metabolic pathway engineering | Metabolic burden tolerance, redox balancing | S. cerevisiae, E. coli | Enhanced cofactor balancing and reduced metabolic burden from heterologous pathways |
The Scientist's Toolkit: Essential Research Reagents
Table 3: Key Research Reagent Solutions for gTME Implementation
| Reagent/Category | Specific Examples | Function in gTME | Implementation Notes |
|---|---|---|---|
| Mutagenesis Methods | Error-prone PCR, Site-saturation mutagenesis | Introduce diversity into transcription factor genes | Optimize mutation rate to balance functional variants and protein integrity |
| Vector Systems | Plasmid-based expression, Genomic integration | Deliver mutant transcription factor genes | Consider copy number and expression level effects |
| Selection Markers | Antibiotic resistance, Auxotrophic complementation | Maintain genetic constructs in population | Antibiotic-free systems preferred for industrial applications |
| Screening Assays | Growth-based selection, Biosensors, FACS | Identify clones with desired phenotypes | Throughput and relevance critical for success |
| Analytical Tools | RNA-seq, HPLC/GC-MS, Growth phenotyping | Characterize transcriptional and phenotypic changes | Multi-omics provides mechanistic insights |
| Host Strains | S. cerevisiae, E. coli, Y. lipolytica | Chassis for gTME implementation | Choose based on industrial application and genetic toolbox availability |
Integration with Broader Robustness Engineering Strategies
gTME functions most effectively when integrated with complementary robustness enhancement strategies. The relationship between gTME and other approaches can be visualized as follows:
Synergistic Approaches
- Membrane/Transporter Engineering: While gTME addresses transcriptional reprogramming, simultaneous engineering of membrane composition and transporter systems can enhance tolerance to hydrophobic inhibitors and organic solvents [1].
- Dynamic Pathway Regulation: gTME can be combined with biosensor-enabled dynamic control to autonomously manage metabolic fluxes, reducing burden and improving stability [16].
- Genetic Stability Enhancement: Integration with toxin-antitoxin systems or auxotrophy complementation strategies maintains gTME benefits over extended cultivation periods [16].
gTME represents a powerful paradigm for enhancing microbial cell factory robustness by reprogramming global cellular regulation. The methodology has demonstrated repeated success in improving complex, industrially relevant phenotypes across diverse microbial hosts. Its key advantage lies in enabling coordinated optimization of multiple cellular functions through minimal genetic interventions, making it particularly valuable for engineering traits that involve complex genetic determinants.
Future developments in gTME will likely focus on several key areas:
- Integration with computational and systems biology approaches for predictive design
- Expansion to non-conventional microbial hosts with industrial relevance
- Combination with CRISPR-based screening for more efficient library evaluation
- Application to emerging bioproduction challenges, including novel product toxicity and alternative substrate utilization
As the field advances, gTME is poised to remain a cornerstone strategy in the robustness engineering toolkit, enabling more resilient and efficient microbial cell factories for sustainable bioproduction.
In the pursuit of sustainable biomanufacturing, microbial cell factories (MCFs) have emerged as powerful platforms for producing fuels, natural products, and pharmaceuticals. However, their industrial potential is often hampered by various stresses encountered during fermentation, including metabolic burden, product toxicity, and harsh environmental conditions. These challenges can severely compromise production efficiency and strain stability. Microbial robustness—the ability of a strain to maintain stable production performance despite perturbations—has thus become a critical engineering target for viable bioprocesses [1] [2]. Unlike tolerance, which primarily relates to survival or growth under stress, robustness encompasses the stability of key production metrics (titer, yield, productivity) under variable industrial conditions [6].
Among the various strategies to enhance robustness, membrane and transporter engineering represents a frontline defense mechanism. The cell membrane serves as the primary interface between the cell and its environment, mediating material transport, energy exchange, and environmental sensing. By engineering membrane composition, structure, and transport systems, researchers can significantly improve cellular resilience and production capacity, thereby fortifying MCFs against industrial stresses [1] [20].
Application Notes: Strategic Implementation of Membrane and Transporter Engineering
Membrane Lipid Composition Engineering
Engineering membrane lipid composition directly influences membrane fluidity, integrity, and functionality under stress conditions. Strategic modifications can enhance tolerance to various inhibitors and products.
Table 1: Membrane Lipid Engineering Strategies for Enhanced Robustness
| Engineering Strategy | Host Organism | Key Modification | Result | Citation |
|---|---|---|---|---|
| Unsaturated Fatty Acid (UFA) Regulation | E. coli | Overexpression of fabA and fabB via CpxRA system | Growth at pH 4.2; Increased UFA content | [1] |
| Fatty Acid Desaturation | S. cerevisiae | Overexpression of Δ9 desaturase OLE1 | Improved tolerance to acid, NaCl, and ethanol | [1] |
| Cyclopropane Fatty Acid (CFA) Enhancement | E. coli | Overexpression of cfa gene from E. faecalis | Increased CFA content; Improved butanol tolerance | [20] |
| cis-trans Isomerization | E. coli | Overexpression of cti from P. aeruginosa | Enhanced membrane rigidity; Increased octanoic acid production | [20] |
| Fatty Acid Elongation | S. cerevisiae | Overexpression of rat elongase 2 (rELO2) | Increased oleic acid; Tolerance to ethanol, n-propanol, n-butanol | [1] |
Transporter Engineering for Product Efflux and Sequestration
Transporters facilitate the movement of molecules across cellular membranes, playing a pivotal role in mitigating intracellular product accumulation and toxicity. Engineering specific transporters can significantly enhance production by enabling efficient product efflux or vacuolar sequestration.
Table 2: Transporter Engineering for Plant Natural Product (PNP) Biosynthesis
| Transporter Type/Name | Origin | Localization | Function/Substrate | Application in MCFs | |
|---|---|---|---|---|---|
| ABC Transporters | |||||
| - AtPGP1 | A. thaliana | Plasma membrane | Auxin transport | Model for transporter discovery | [21] |
| - CrTPT2 | C. roseus | - | Catharanthine transport | Anticancer drug precursor production | [21] |
| - AaPDR3 | A. annua | - | β-Caryophyllene transport | Sesquiterpene production | [21] |
| MATE Transporters | |||||
| - NtMATE1 | N. tabacum | Vacuolar membrane (root-specific) | Alkaloid transport to vacuoles | Detoxification and storage | [21] |
| - NtJAT2 | N. tabacum | Vacuolar membrane (leaf-specific) | Nicotine transport | Tissue-specific transport models | [21] |
| - CjMATE1 | C. japonica | Vacuolar membrane | Berberine transport | Alkaloid accumulation | [21] |
Diagram 1: Integrated cellular engineering strategy for enhanced robustness. The diagram illustrates how microbial cells sense external stress and the subsequent engineering interventions targeting membrane properties and transporter functions to achieve enhanced robustness.
Intracellular Membrane Proliferation for Storage Capacity
Many hydrophobic natural products (e.g., terpenoids, carotenoids) accumulate in membrane structures, creating a bottleneck due to limited space. Engineering strategies that promote intracellular membrane proliferation can dramatically increase storage capacity and boost production titers.
- Key Example: Overexpression of the heterologous enzyme 1,2-diacylglycerol 3-glucosyltransferase from Acholeplasma laidlawii (AlMGS) in E. coli induces the formation of numerous intracellular membrane vesicles, effectively expanding the membrane area available for product storage [20]. This strategy has been successfully applied to increase the production of compounds like beta-carotene and lycopene.
- Synergistic Approach: Combining AlMGS overexpression with the reinforcement of the endogenous membrane synthesis pathway (e.g., by overexpressing plsB and plsC) creates a powerful synergy for membrane proliferation and has led to significant increases in lycopene production [20].
Experimental Protocols
Protocol: Engineering Membrane Fluidity via Fatty Acid Composition inE. coli
This protocol details the genetic modification of E. coli to alter its unsaturated to saturated fatty acid (UFA/SFA) ratio, a key determinant of membrane fluidity and stress tolerance [1] [20].
I. Materials
- E. coli target strain (e.g., MG1655)
- Plasmid vector with inducible promoter (e.g., pET, pBAD)
- Genomic DNA from Pseudomonas aeruginosa (for cti gene)
- Phusion High-Fidelity DNA Polymerase
- DpnI restriction enzyme
- T4 DNA Ligase
- Chemically competent E. coli cells
- LB broth and agar plates with appropriate antibiotics
- Inducer (e.g., IPTG or L-Arabinose)
- Gas Chromatography-Mass Spectrometry (GC-MS) system for fatty acid analysis
II. Procedure
Day 1: Gene Cloning
- Amplify Target Gene: Use PCR to amplify the cis-trans isomerase gene (cti) from P. aeruginosa genomic DNA.
- Digest Vector and Insert: Digest the plasmid vector and the purified cti PCR product with the appropriate restriction enzymes.
- Ligate and Transform: Ligate the cti insert into the digested vector and transform into competent E. coli cells. Plate on selective LB agar and incubate overnight at 37°C.
Day 2: Colony Screening and Cultivation
- Screen Colonies: Pick several colonies, inoculate in small volumes of selective LB broth, and grow for 6-8 hours.
- Verify Clone: Isolate plasmid DNA from cultures and verify correct construction by restriction digest and/or sequencing.
- Start Overnight Culture: Inoculate a verified colony into fresh selective LB broth and incubate overnight with shaking.
Day 3: Induction and Analysis
- Sub-culture: Dilute the overnight culture into fresh, pre-warmed medium containing antibiotics.
- Induce Gene Expression: When the culture reaches mid-log phase (OD600 ≈ 0.6), add the inducer.
- Harvest Cells: 4-6 hours post-induction, harvest cells by centrifugation.
- Analyze Membrane Lipids: a. Lipid Extraction: Perform a Bligh and Dyer lipid extraction on the cell pellet. b. Fatty Acid Methylation: Derivatize fatty acids to their methyl esters (FAMEs). c. GC-MS Analysis: Analyze FAMEs by GC-MS to determine the UFA/SFA ratio and the presence of trans-UFAs.
- Phenotypic Assay: Assess tolerance by comparing the growth of the engineered strain versus the control in media containing stress agents (e.g., ethanol, butanol, organic acids).
Protocol: Functional Screening of Plant ABC Transporters in Yeast
This protocol describes a heterologous system to screen for plant-derived ABC transporters that can export hydrophobic plant natural products (PNPs) from yeast, alleviating intracellular toxicity [21].
I. Materials
- Saccharomyces cerevisiae strain (e.g., BY4741)
- Yeast expression plasmid (e.g., pYES2/CT)
- cDNA library from a plant of interest (e.g., Catharanthus roseus)
- SC-Ura broth and agar plates
- Galactose and Raffinose
- Target PNP (e.g., catharanthine, β-caryophyllene)
- LC-MS/MS system for product quantification
II. Procedure
Day 1: Library Transformation
- Prepare Competent Yeast Cells: Use a lithium acetate method to make competent yeast cells.
- Co-transform: Co-transform the yeast with the plant cDNA library cloned into the expression vector and a plasmid containing the PNP biosynthetic pathway.
- Plate and Incubate: Plate the transformation mixture on SC-Ura dropout plates and incubate at 30°C for 2-3 days.
Day 2-4: Functional Screen
- Replica Plating: Replica plate the colonies onto fresh SC-Ura plates containing galactose (to induce transporter expression) and a growth-inhibiting concentration of the target PNP or its precursor.
- Identify Resistant Clones: Identify colonies that grow robustly under selective conditions but show slow growth on control plates without induction.
- Isolate Plasmids: Recover the plasmid from the candidate yeast clones and retransform into fresh yeast to confirm the phenotype.
Day 5: Validation
- Fed-Batch Fermentation: Grow validated strains in selective medium with galactose induction.
- Sample Analysis: Collect cells and media at various time points.
- Quantify Product: Use LC-MS/MS to quantify intracellular vs. extracellular concentrations of the target PNP. A successful transporter will show a higher proportion of the product in the extracellular medium compared to control strains.
Diagram 2: Generalized workflow for transporter and membrane engineering. The flowchart outlines the key experimental steps from gene cloning to phenotypic and chemical validation of engineered microbial strains.
The Scientist's Toolkit: Research Reagent Solutions
Table 3: Essential Reagents for Membrane and Transporter Engineering Studies
| Reagent / Material | Function / Application | Example Use Case | Citation |
|---|---|---|---|
| AlMGS (A. laidlawii MGS) | Heterologous enzyme inducing intracellular membrane proliferation. | Expanding membrane storage capacity in E. coli for carotenoid production. | [20] |
| Cis-trans Isomerase (Cti) | Converts membrane UFAs from cis to trans, increasing rigidity. | Enhancing E. coli tolerance to octanoic acid and various physical/chemical stresses. | [20] |
| Δ9 Desaturase (OLE1) | Introduces double bonds in fatty acids, increasing UFA/SFA ratio. | Improving yeast tolerance to multiple stressors (ethanol, acid, NaCl). | [1] |
| Synthetic Lipids (e.g., alkynyl DPPC) | Building artificial membranes (protocells) with engineered sensing capabilities. | Creating model vesicle systems to study membrane behavior and redox sensing. | [22] |
| cfa Gene (CFA Synthase) | Synthesizes cyclopropane fatty acids for membrane lipid homeostasis. | Improving acid and solvent tolerance in engineered E. coli strains. | [20] |
| Plant ABC Transporter Genes (e.g., CrTPT2, AaPDR3) | Facilitates specific transport of plant natural products (PNPs). | Enabling efflux or sequestration of toxic PNPs in heterologous microbial hosts. | [21] |
The establishment of robust microbial cell factories is often hampered by the inherent conflict between host cell fitness and the metabolic burden imposed by heterologous pathways. Static metabolic engineering approaches frequently lead to suboptimal production performance due to unbalanced enzyme expression, metabolic congestion, and the accumulation of toxic intermediates [23]. Dynamic metabolic control has emerged as a transformative strategy to overcome these challenges by enabling autonomous regulation of metabolic pathways in response to changing intracellular conditions [23] [24].
This application note explores the integration of biosensors and quorum sensing (QS) systems as sophisticated tools for implementing dynamic control strategies. These systems enable microbial cell factories to self-regulate metabolic flux, automatically divert resources from growth to production phases, and maintain cellular homeostasis without external intervention. By framing these technologies within the context of enhancing microbial robustness, we provide detailed protocols and implementation frameworks that support the development of more reliable and productive biomanufacturing platforms.
Theoretical Foundations and Key Components
Molecular Principles of Autonomous Regulation
Autonomous dynamic regulation systems mimic the "just-in-time transcription" principles prevalent in natural metabolic networks [23]. These systems typically comprise three core components: a sensing mechanism that detects specific intracellular or extracellular signals, a processing module that interprets these signals, and an output module that executes appropriate metabolic responses.
Biosensors function as the critical sensing elements, converting biological signals into quantifiable genetic responses. The input module employs transcription factors, membrane receptors, aptamers, or nucleic acid switches to capture external stimuli such as metabolic intermediates, pH, or temperature changes [25]. Following target recognition, sensing elements activate signal transduction through conformational changes, induced dimerization, conditional stabilization, or enzymatic reactions [25].
Quorum sensing systems provide unique population-density-dependent control mechanisms. In these systems, autoinducer molecules accumulate proportionally with cell density, activating transcriptional regulators once a threshold concentration is reached. This enables coordinated population-wide responses, making QS particularly valuable for implementing two-stage fermentation processes where production is initiated only after sufficient biomass accumulation [26] [24].
Comparative Analysis of Dynamic Regulation Strategies
Table 1: Characteristics of Major Dynamic Control Modalities
| Control Strategy | Induction Mechanism | Key Advantages | Implementation Challenges | Representative Applications |
|---|---|---|---|---|
| Chemical Inducers | External addition of small molecules (e.g., IPTG, aTc) | Precise temporal control; well-characterized systems | Cost at industrial scale; potential toxicity; requires fermentation intervention | Two-phase production of malate, isoprenol, and glucaric acid [23] |
| Quorum Sensing | Autoinducer accumulation at high cell density | Autonomous induction; pathway-independent; no external inducers needed | Circuit crosstalk; dependent on population dynamics; tuning required | MK-7 production in B. subtilis; iso-butylamine production in E. coli [26] [27] |
| Biosensor-Based | Detection of specific metabolites or intracellular conditions | Real-time feedback control; responsive to metabolic state | Limited metabolite detection range; potential background interference | Lycopene, N-acetylglucosamine, and shikimate production [23] |
| Environmental Triggers | Changes in temperature, pH, or light | Non-chemical induction; potentially low-cost | Indirect control; can affect multiple cellular processes simultaneously | Light-induced isobutanol production; pH-controlled lactic acid synthesis [23] |
Application Case Studies in Metabolic Engineering
Quorum Sensing for Enhanced Menaquinone Biosynthesis
The SinR quorum sensing regulator in Bacillus subtilis was engineered through site-directed mutagenesis to dynamically control menaquinone (MK-7) production. The mutant SinRquad strain achieved a remarkable yield of 102.56 ± 2.84 mg/L MK-7, representing one of the highest reported titers [26].
Mechanistic Analysis: RNA-seq transcriptome profiling revealed that SinRquad upregulated biofilm formation genes (tapA, tasA, epsE), resulting in structural modifications that enhanced glycerol uptake efficiency. Concurrently, increased expression of NADH dehydrogenases (sdhA, sdhB, sdhC, glpD) generated elevated membrane potential, stimulating electron transport chain components including menaquinone [26].
This QS-mediated approach demonstrated how autonomous regulation could simultaneously optimize physical cell properties and metabolic flux without compromising cell viability. The wrinkly, smooth biofilms formed interconnected channels with low resistance to liquid flow, facilitating nutrient distribution and product formation.
Biosensor-Driven Dynamic Control Applications
Biosensors have enabled diverse dynamic control applications across multiple microbial hosts and pathway types:
- Acetyl phosphate-responsive control in E. coli enhanced lycopene productivity 3-fold by implementing positive feedback regulation of the PPS and Idi enzymes [23].
- Glucosamine-6-phosphate biosensors in B. subtilis improved N-acetylglucosamine titer 1.6-fold through feedback regulation of pfkA, zwf, and glmM genes [23].
- Malonyl-CoA biosensors in S. cerevisiae achieved a 10-fold increase in 3-hydroxypropionic acid production by implementing dynamic control of the MCR pathway [23].
These examples demonstrate the versatility of biosensor-based regulation for different metabolic intermediates, host organisms, and target compounds.
Table 2: Performance Metrics of Representative Dynamic Regulation Implementations
| Inducing Signal | Control Logic | Host Organism | Target Product | Performance Improvement |
|---|---|---|---|---|
| QS System (EsaR/EsaI) | Positive feedback control | E. coli | Shikimate | From unmeasurable to 100 mg/L [23] |
| QS System (LuxR/LuxI) | Positive feedback control | E. coli | Naringenin | 6.5-fold titer increase [23] |
| p-Coumaric acid | Positive feedback control | E. coli | p-Coumaric acid | 77.89% titer increase [23] |
| Pyruvate | Oscillation-based | B. subtilis | Glucaric acid | 2.5-fold titer increase [23] |
| Farnesyl pyrophosphate | Oscillation-based | E. coli | Amorphadiene | 2-fold titer increase [23] |
| QS System (Ypd1-Skn7) | Positive feedback control | S. cerevisiae | α-Farnesene | 80% titer increase [23] |
Experimental Protocols
Protocol 1: Implementation of Quorum Sensing Circuits for Two-Stage Fermentation
This protocol describes the implementation of LuxI/LuxR-based quorum sensing circuits for autonomous induction of metabolic pathways in E. coli, adapted from established methodologies with recent optimizations [23] [24] [27].
Materials and Reagents:
- E. coli strains DH5α (cloning) and production chassis (e.g., BL21)
- Plasmid vectors with compatible origins and antibiotic resistance
- LuxI/LuxR genetic elements
- Target pathway genes under Plux promoter control
- LB and fermentation media
- Acyl-homoserine lactone (AHL) standards for calibration
- Antibiotics as required for selection
Procedure:
Day 1: Circuit Assembly
- Clone the LuxI gene under a constitutive promoter (e.g., J23100) into a medium-copy plasmid.
- Clone the LuxR gene under a constitutive promoter into the same or compatible plasmid.
- Place the metabolic pathway genes under the control of the Plux promoter in a compatible expression vector.
- Transform the assembled circuits into the production host through heat shock or electroporation.
Day 2: Characterization and Calibration
- Inoculate single colonies into 5 mL LB medium with appropriate antibiotics.
- Grow cultures overnight at 30°C with shaking at 250 rpm.
- Measure baseline AHL production using analytical methods (HPLC or reporter strains).
- Determine the relationship between cell density and AHL accumulation.
Day 3: Fermentation Implementation
- Inoculate main cultures in fermentation media at 1:100 dilution from overnight cultures.
- Monitor cell growth (OD600) and product formation throughout fermentation.
- Sample periodically to verify induction timing correlates with AHL threshold concentration.
- Compare production metrics against constitutive expression controls.
Troubleshooting:
- For premature induction: Decrease LuxI expression strength or use LuxR mutants with higher activation thresholds [27].
- For delayed or weak induction: Increase LuxI expression strength or use high-copy plasmids.
- For circuit instability: Include toxin-antitoxin systems or split the circuit between multiple plasmids.
Protocol 2: Development of Metabolite-Responsive Biosensor Systems
This protocol outlines the creation and implementation of transcription factor-based biosensors for dynamic metabolic control [25] [23] [28].
Materials and Reagents:
- Native or engineered transcription factors responsive to target metabolite
- Reporter proteins (eGFP, mCherry, luciferase)
- Modular plasmid systems with varying copy numbers
- Target metabolite standards for calibration
- Microtiter plates for high-throughput screening
- Flow cytometer or plate reader for signal detection
Procedure:
Phase 1: Biosensor Assembly and Validation
- Select appropriate transcription factor and corresponding promoter elements responsive to the target metabolite.
- Clone the reporter gene under control of the responsive promoter.
- Transform the biosensor construct into the host chassis.
- Characterize biosensor response by measuring reporter signal across a range of metabolite concentrations.
- Determine dynamic range, sensitivity, and specificity of the biosensor.
Phase 2: Circuit Integration and Testing
- Replace the reporter gene with metabolic pathway genes or regulatory elements.
- Alternatively, implement AND-gate logic by retaining a fluorescent reporter for monitoring while expressing pathway genes from compatible promoters.
- Test integrated circuits in batch cultures with varying initial metabolite concentrations.
- Compare growth and production characteristics against constitutively expressed controls.
Phase 3: Fermentation Optimization
- Implement biosensor-controlled pathways in bioreactor systems.
- Monitor real-time metabolite levels and pathway expression.
- Adjust feeding strategies to maintain metabolite concentrations within biosensor activation range.
- Evaluate long-term circuit stability over multiple generations.
Key Optimization Parameters:
- Transcription factor expression levels
- Promoter strength for regulated genes
- Ribosome binding site modifications
- Plasmid copy number effects
The Scientist's Toolkit: Essential Research Reagents
Table 3: Key Research Reagent Solutions for Dynamic Metabolic Engineering
| Reagent/Component | Function | Example Applications | Implementation Notes |
|---|---|---|---|
| LuxI/LuxR System | QS circuit components | Autonomous induction in E. coli | Optimize AHL production and receptor sensitivity for specific timing [27] |
| SinR Mutants | QS transcriptional regulator in B. subtilis | MK-7 production, biofilm engineering | Site-directed mutants (e.g., SinRquad) enhance production without growth trade-offs [26] |
| TetR-Based Biosensors | Chemical-inducible systems | Two-phase fermentations with aTc induction | Well-characterized, high dynamic range; requires external inducer [24] |
| Fluorescent Reporters | Circuit characterization and monitoring | eGFP, mCherry for real-time readouts | Enable high-throughput screening and circuit optimization [25] |
| CRISPRi Modules | Dynamic repression | Competitive pathway knockdown | Combine with biosensors for bidirectional flux control [23] |
| AHL Standards | QS calibration | Quantifying autoinducer concentration | Essential for correlating cell density with induction timing [24] |
Visualization of Regulatory Mechanisms and Workflows
Diagram 1: Autonomous regulation mechanisms for dynamic metabolic control
Diagram 2: Experimental workflow for implementing dynamic control systems
Concluding Remarks
The integration of biosensors and quorum sensing systems represents a paradigm shift in metabolic engineering, moving from static to dynamic control strategies that significantly enhance microbial cell factory robustness. These approaches enable autonomous regulation that responds to intrinsic metabolic needs and population dynamics, optimizing the balance between cellular growth and product formation.
As synthetic biology tools continue to advance, particularly with the integration of machine learning and multi-omics data analysis [29], the design precision and implementation efficiency of these dynamic systems will further improve. The protocols and frameworks provided in this application note offer researchers practical methodologies for implementing these sophisticated control strategies, ultimately contributing to the development of more reliable and productive biomanufacturing platforms for chemical and pharmaceutical production.
Engineering robust microbial cell factories is essential for sustainable industrial bioproduction. A significant challenge is phenotype instability, where production efficiency declines over generations due to metabolic burden and evolutionary pressures. This application note details growth-coupling and product-addiction strategies that intrinsically link target chemical production to metabolic fitness. We provide validated experimental protocols, quantitative performance data, and essential reagent solutions to facilitate the implementation of these robustness-enhancing strategies in microbial hosts.
In industrial biomanufacturing, engineered microbial strains often face phenotype instability caused by metabolic burden, toxicity from intermediates or products, and genetic drift [16] [30]. This instability is particularly problematic in large-scale fermentations where non-producing mutants can outcompete production strains, drastically reducing overall yield and process viability [31]. Growth-coupling and product-addiction strategies address this fundamental challenge by rewiring central metabolism to make product synthesis obligatory for cell growth and survival [16]. This creates evolutionary pressure against non-producing mutants and enhances long-term production stability.
Conceptual Framework and Key Mechanisms
Growth-Coupling Strategies
Growth-coupling strategies manipulate microbial metabolism so that flux through the product synthesis pathway becomes essential for generating energy, redox balance, or key metabolic precursors required for growth [16]. This approach creates a direct correlation between biomass accumulation and product formation.
The diagram below illustrates the fundamental mechanism of growth-coupling through metabolic rewiring.
Product-Addiction Strategies
Product-addiction represents a more generalized approach where cell survival is made dependent on the target product through synthetic genetic circuits [16]. This strategy typically places essential genes under the control of product-responsive biosensors, creating a synthetic dependency that maintains production capability across generations.
The diagram below illustrates the synthetic genetic circuitry that enables product-addiction.
Experimental Protocols
Growth-Coupling Protocol for Terpenoid Production in E. coli
This protocol implements a growth-coupling strategy for terpenoid production by replacing the native MEP pathway with an orthogonal mevalonate pathway [31].
Materials:
- E. coli BW25113 or similar strain
- pTargetF plasmid with λ-Red recombinase system
- pTF-dxr donor plasmid containing FRT-flanked dxr gene
- pTet-Flp plasmid for FLP recombinase expression
- pLMVA-Lin plasmid with mevalonate pathway and linalool production genes
- LB medium with appropriate antibiotics (carbenicillin, chloramphenicol, streptomycin)
- Linalool standard for GC-MS calibration
Procedure:
dxr Gene Knockout:
- Transform E. coli with pTargetF plasmid
- Induce λ-Red recombinase system with 0.2% L-arabinose
- Transform with pTF-dxr donor plasmid
- Select clones on LB agar with streptomycin (100 μg/mL) at 30°C
- Verify dxr knockout by colony PCR and sequencing
Antibiotic Marker Excision:
- Transform Δdxr strain with pTet-Flp plasmid
- Indce FLP recombinase with 100 ng/mL anhydrotetracycline
- Screen for streptomycin-sensitive clones
- Verify marker excision by PCR
Mevalonate Pathway Integration:
- Transform Δdxr strain with pLMVA-Lin plasmid
- Select transformants on LB agar with carbenicillin (100 μg/mL)
- Confirm plasmid presence by analytical digestion
Bioreactor Cultivation:
- Inoculate 500 mL bioreactor with 10 mL overnight culture
- Use minimal medium with 20 g/L glucose
- Maintain temperature at 30°C, pH at 7.0, dissolved oxygen at 30%
- Monitor cell density (OD600) and linalool production for 72-96 hours
Analytical Methods:
- Quantify linalool production via GC-MS
- Extract samples with ethyl acetate, use 10 mg/L neral as internal standard
- Compare productivity between Δdxr and parental strains over 12-day continuous cultivation
Product-Addiction Protocol Using Essential Gene Regulation
This protocol establishes a product-addiction system by placing essential genes under control of product-responsive biosensors [16].
Materials:
- pAddiction plasmid with biosensor-promoter system
- folP and glmM essential genes cloned under biosensor control
- Host strain with deletion of chromosomal folP and glmM genes
- Complementing plasmid with inducible copy of essential genes
- Target product (e.g., mevalonate) for biosensor characterization
Procedure:
Biosensor Characterization:
- Clone biosensor responsive to target product
- Test dynamic range and sensitivity using fluorescence reporters
- Determine activation threshold and maximum response
Essential Gene Cloning:
- Amplify folP and glmM essential genes from genomic DNA
- Clone essential genes downstream of biosensor-controlled promoter
- Verify construct functionality by complementing knockout strains
Chromosomal Deletion:
- Create markerless deletion of folP and glmM genes
- Use complementing plasmid with inducible essential genes during strain construction
- Verify essentiality by testing growth without inducer
Addiction System Assembly:
- Transform deletion strain with pAddiction plasmid
- Remove complementing plasmid by counter-selection
- Verify addiction phenotype by serial passage with and without product
Long-Term Stability Assessment:
- Conduct serial passaging for 90+ generations
- Monitor production stability and genetic integrity
- Compare with control strains lacking addiction system
Performance Data and Comparative Analysis
Quantitative Comparison of Robustness Strategies
Table 1: Performance metrics of different growth-coupling implementations
| Strategy | Host | Product | Titer Improvement | Stability Duration | Key Genetic Modifications |
|---|---|---|---|---|---|
| Growth-coupling [31] | E. coli | Linalool | 2.1-fold increase in first 3 days | 12 days with stable production | Δdxr + mevalonate pathway |
| Pyruvate-driven [16] | E. coli | L-Tryptophan | 2.37-fold (1.73 g/L) | Maintained through scale-up | Removal of pyruvate-generating steps |
| Acetyl-CoA-driven [16] | E. coli | Butanone | 855 mg/L with acetate deprivation | Stable in continuous culture | ΔpoxB, ΔackA, Δpta, Δacs |
| Product-addiction [16] | E. coli | Mevalonate | Stable production | >95 generations | folP/glmM under biosensor control |
Stability Assessment Under Industrial Conditions
Table 2: Stability comparison between growth-coupled and conventional strains
| Parameter | Conventional Strain | Growth-Coupled Strain | Testing Conditions |
|---|---|---|---|
| Productivity decline | >80% after 14 generations | <15% after 14 generations | Serial passage in minimal media |
| Plasmid loss rate | 25-40% without selection | <5% without selection | 72h cultivation without antibiotics |
| Mutant accumulation | High (65% non-producers) | Low (<10% non-producers) | Single-cell analysis after 12 days |
| Performance under stress | Severe decline with nutrient shifts | Maintained >70% productivity | Nutrient and oxygen disruption |
The Scientist's Toolkit: Research Reagent Solutions
Table 3: Essential research reagents for implementing robustness strategies
| Reagent/Category | Function/Application | Examples/Specifics |
|---|---|---|
| Vector Systems | Genetic manipulation and pathway expression | pTargetF (λ-Red recombinase), pTF-dxr (donor DNA), pTet-Flp (recombinase) |
| Selection Markers | Strain construction and plasmid maintenance | Carbenicillin (100 μg/mL), Chloramphenicol (25 μg/mL), Streptomycin (100 μg/mL) |
| Pathway Modules | Heterologous production pathways | pLMVA-Lin (mevalonate pathway + linalool production) |
| Biosensor Systems | Product-responsive genetic circuits | Product-responsive promoters for mevalonate, fatty acids, or target chemicals |
| Essential Genes | Synthetic auxotrophy implementation | folP (dihydropteroate synthase), glmM (phosphoglucosamine mutase) |
| Analytical Standards | Product quantification | Linalool (for GC-MS), Mevalonolactone (for HPLC), Enzyme assays |
| Induction Systems | Controlled gene expression | Arabinose-inducible (λ-Red), Tetracycline-inducible (FLP recombinase) |
Troubleshooting and Optimization Guidelines
Common Implementation Challenges
- Incomplete growth coupling: Ensure complete knockout of native redundant pathways and verify rescue only by production pathway
- Low biosensor sensitivity: Optimize biosensor dynamic range through promoter engineering or protein mutagenesis
- Genetic instability: Use recA- strains to minimize recombination and include multimer resolution systems in plasmids
- Metabolic burden: Distribute pathway genes between genome and plasmids, use moderate-copy number plasmids
Scalability Considerations
- Process parameters: Growth-coupled strains may require optimized aeration and feeding strategies
- Medium formulation: Defined media often necessary for precise metabolic control
- Inoculum preparation: Maintain selective pressure during pre-culture to prevent population heterogeneity
- Monitoring: Implement rapid analytics for real-time process control
Growth-coupling and product-addiction strategies represent powerful approaches for enhancing the robustness of microbial cell factories. By intrinsically linking metabolic fitness to production, these methods address the fundamental challenge of strain instability in industrial bioprocesses. The protocols and data presented here provide researchers with practical tools for implementing these strategies, contributing to more reliable and economically viable biomanufacturing platforms.
Plasmid-based expression systems are fundamental to microbial cell factory engineering, yet traditional antibiotic selection methods pose significant challenges for industrial-scale fermentation, including economic constraints, regulatory pressures, and the risk of contributing to antimicrobial resistance. This application note explores two advanced genetic stabilization strategies—toxin-antitoxin (TA) systems and auxotrophy complementation—as robust alternatives for plasmid maintenance. We present quantitative performance data, detailed experimental protocols, and implementation frameworks that demonstrate how these systems significantly enhance plasmid stability, improve product yield, and eliminate antibiotic dependence. Within the broader context of microbial cell factory robustness research, these technologies provide reliable, scalable solutions for therapeutic protein production, metabolic engineering, and DNA vaccine manufacturing while addressing critical biosafety concerns.
The stability of plasmid DNA in microbial hosts is a fundamental prerequisite for reliable bioprocessing in industrial biotechnology. Conventional plasmid maintenance strategies utilizing antibiotic resistance genes present substantial limitations for large-scale applications, including escalating costs, regulatory restrictions, and potential contamination of final products with antibiotic residues [32]. Furthermore, the metabolic burden imposed by constitutive expression of antibiotic resistance genes can reduce overall productivity [33]. These challenges have accelerated the development of alternative plasmid stabilization technologies that function without antibiotic selection.
Two principal mechanisms have emerged as particularly effective for antibiotic-free plasmid maintenance: toxin-antitoxin (TA) systems based on post-segregational killing, and auxotrophy complementation based on essential gene rescue. TA systems utilize a stable toxin and an unstable antitoxin to selectively eliminate plasmid-free cells, while auxotrophy complementation creates a genetic dependency where plasmid loss results in the cessation of growth due to the absence of an essential gene product [34] [32]. This application note provides a comprehensive technical overview of these technologies, including performance metrics, standardized protocols, and implementation guidelines to enhance robustness in microbial cell factories.
Performance Comparison of Stabilization Systems
The selection of an appropriate plasmid stabilization system requires careful consideration of multiple performance parameters. The following table summarizes key metrics for major TA and auxotrophy-based systems, enabling direct comparison of their operational characteristics.
Table 1: Performance Metrics of Antibiotic-Free Plasmid Stabilization Systems
| System Type | Specific System | Escape Frequency | Stability Duration | Key Advantages | Reported Applications |
|---|---|---|---|---|---|
| TA System | hok/sok (Type I) | <1% per generation [35] | >5 days [35] | Rapid killing action; combats plasmid loss | Low-copy plasmids in E. coli |
| TA System | VapBC (Type II) | Not detected in CS14 strain [36] | Stable in clinical isolate | SNP-tuneable stability; links to antibiotic tolerance | Shigella sonnei virulence plasmid |
| TA System | yefM/yoeBsl | Stable for 8 days [37] | High in serial subcultures | Functional in Streptomyces; no antibiotics needed | Protein production in S. lividans |
| Auxotrophy | infA (STAPL) | <1% plasmid loss in 40 generations [33] | 40+ generations | Tunable PCN (5.6-fold); minimized cell-to-cell variation | Itaconic acid & lycopene production |
| Auxotrophy | infA (Arabinose) | Tight selection demonstrated [32] | Long-term maintenance | Temperature-independent; works in rich media | Various E. coli strains and plasmids |
| Auxotrophy | Artificial phosphite dependency | 1.94×10⁻¹³ [34] | Below detection limit | Non-metabolite dependency; ultra-low escape | Biosafety strains |
Table 2: Metabolic Burden and Yield Impact Comparison
| System | Plasmid Copy Number Range | Relative Metabolic Burden | Reported Yield Improvement | Complementation Requirement |
|---|---|---|---|---|
| Antibiotic Resistance | Varies by origin | High (constitutive expression) | Baseline | Antibiotics in medium |
| TA System | 2.4-8.8 [35] | Medium (toxin-antitoxin balance) | Not quantified | None |
| infA Complementation | Tunable over 5.6-fold [33] | Low (essential gene only) | 2-fold for itaconic acid & lycopene [33] | Defined or rich media |
| Combined TA + Partitioning | Low-copy (<5) [35] | Medium-high (multiple components) | Superior to either system alone [35] | None |
Experimental Protocols
Protocol 1: Implementation of Separate-Component-Stabilization TA System
This protocol adapts the TA separate-component-stabilization approach for E. coli, based on principles successfully demonstrated in Streptomyces [37] and Shigella systems [36].
Materials:
- Bacterial strain with clean genetic background (e.g., E. coli K-12 MG1655)
- Temperature-sensitive plasmid with antitoxin gene (e.g., pGM160-YefMslts for Streptomyces [37])
- Expression plasmid with antitoxin gene and multiple cloning site
- Integrative plasmid with toxin gene
- Appropriate antibiotics for selection
- λ-Red recombinase system for genetic modifications
Procedure:
Step 1: Host Strain Preparation 1.1. Delete the native TA operon from the host genome using λ-Red recombinering to create a ΔTA strain. 1.2. Transform the ΔTA strain with a temperature-sensitive plasmid containing the antitoxin gene (e.g., pGM160-YefMslts). Select transformants at permissive temperature (30°C). 1.3. Integrate the toxin gene into the genome of the ΔTA strain using an integrative plasmid (e.g., pKC796-Tox). 1.4. Cure the temperature-sensitive antitoxin plasmid by growth at non-permissive temperature (37°C) to create the final host strain. Verify strain purity by PCR and sequencing.
Step 2: Expression Plasmid Construction 2.1. Clone the antitoxin gene under a constitutive or inducible promoter into an expression plasmid backbone. 2.2. Insert the gene of interest into the multiple cloning site of the same plasmid. 2.3. Transform the constructed plasmid into the host strain from Step 1.4. 2.4. Verify plasmid stability by growing transformants without antibiotic selection for 10-15 generations and assessing retention of the plasmid.
Step 3: Fermentation Without Antibiotics 3.1. Inoculate main culture from a single colony and grow under permissive conditions. 3.2. Induce gene expression at optimal cell density. 3.3. Monitor plasmid stability throughout fermentation by plating samples on selective and non-selective media. 3.4. Calculate plasmid retention percentage as (CFU on selective media / CFU on non-selective media) × 100%.
Protocol 2: infA-Based Auxotrophic Complementation System
This protocol implements the Stable and TunAble PLasmid (STAPL) system using translation initiation factor IF-1 complementation, based on systems validated in [33] and [32].
Materials:
- E. coli strain HS996 or other K-12 derivative
- λ-Red recombinering system
- Plasmid with native infA promoter
- Complementation plasmid with infA gene and gene of interest
- Luria-Bertani (LB) medium or defined minimal medium
- Arabinose for induction (if using inducible system)
Procedure:
Step 1: Chromosomal Modification for Conditional infA Expression 1.1. Replace the endogenous infA promoter with an inducible promoter (e.g., ParaBAD) using λ-Red recombinering in a two-step protocol [32]. 1.2. Verify promoter replacement by colony PCR and sequencing. 1.3. Test inducibility by growing the modified strain with and without inducer (e.g., 0.2% arabinose).
Step 2: Complementation Plasmid Design 2.1. Amplify the infA gene with its native promoter or a promoter of desired strength. 2.2. Clone the infA expression cassette into a standard plasmid backbone. 2.3. Insert the gene of interest into the same plasmid. 2.4. Transform the complementation plasmid into the modified host strain from Step 1.
Step 3: Plasmid Stability Assessment 3.1. Grow the strain without antibiotic selection and with varying concentrations of arabinose inducer (0-0.2%). 3.2. Sample the culture every 4-8 generations, dilute, and plate on non-selective media. 3.3. Replica plate 100-200 colonies to both selective (no arabinose) and permissive (with arabinose) conditions. 3.4. Calculate plasmid loss frequency as: (Colonies growing only with arabinose / Total colonies) × 100%.
Step 4: Plasmid Copy Number Tuning 4.1. To modulate plasmid copy number, vary the expression level of the plasmid-encoded infA gene. 4.2. Utilize promoters of different strengths or modify the ribosome binding site. 4.3. Measure plasmid copy number by quantitative PCR using a chromosomal gene as reference [33].
System Architecture and Mechanisms
The following diagrams illustrate the core mechanisms of TA systems and auxotrophy complementation approaches for plasmid stabilization.
Toxin-Antitoxin System Mechanism
Diagram 1: TA System Post-Segregational Killing Mechanism. This diagram illustrates how TA systems stabilize plasmids through selective killing of plasmid-free daughter cells. When the plasmid is present, both toxin and antitoxin are produced, with the antitoxin neutralizing the toxin. Following plasmid loss, the unstable antitoxin degrades, freeing the stable toxin to arrest growth or kill the cell [37] [38].
Auxotrophy Complementation System
Diagram 2: Auxotrophy Complementation System. This diagram shows the essential gene complementation strategy for plasmid stabilization. The chromosomal copy of an essential gene is placed under control of an inducible promoter, while a functional copy is provided on the plasmid. Without the plasmid, cells cannot produce the essential protein and undergo growth arrest, creating selective pressure for plasmid maintenance [33] [32].
The Scientist's Toolkit: Research Reagent Solutions
Table 3: Essential Genetic Elements for Plasmid Stabilization Systems
| Component | Type | Function | Example Sources |
|---|---|---|---|
| hok/sok TA System | Type I TA | Post-segregational killing; sok RNA inhibits hok toxin translation | Plasmid R1 [35] |
| VapBC TA System | Type II TA | PIN domain toxin stabilized by specific SNPs; degrades mRNA | Shigella sonnei CS14 [36] |
| yefM/yoeBsl TA System | Type II TA | mRNA interferase toxin; functional in Streptomyces | S. lividans [37] |
| infA Gene | Essential gene complementation | Encodes translation initiation factor IF-1; creates non-feedable auxotrophy | E. coli chromosome [33] [32] |
| parABC System | Active partitioning | Promotes equal plasmid segregation during cell division | Plasmid R1 [35] |
| Arabinose Promoter | Inducible promoter | Tightly regulates chromosomal essential gene expression | E. coli araBAD operon [32] |
| Temperature-Sensitive Plasmid | Vector system | Allows easy curing of helper plasmids during strain construction | pGM160 derivative [37] |
Table 4: Host Strains and Application Specifications
| Host Strain | Modification | Compatible Systems | Optimal Applications |
|---|---|---|---|
| E. coli HS996 | Para::infA | infA complementation | High-density fermentation; protein production |
| E. coli Δ5 | Multiple TA deletions (MazF, RelE, YoeB, YafQ, ChpB) | TA system studies | Biofilm and persistence research [38] |
| S. lividans ΔTA | yefM/yoeBsl deletion | yefM/yoeBsl SCS system | Antibiotic-free protein secretion [37] |
| E. coli M15 | glyA mutation | Auxotrophy complementation | Plasmid maintenance without antibiotic markers [34] |
The implementation of advanced genetic stabilization systems represents a significant advancement in microbial cell factory robustness research. TA systems and auxotrophy complementation provide effective, antibiotic-free solutions for plasmid maintenance with distinct advantages for different applications. TA systems offer rapid elimination of plasmid-free cells and are particularly valuable for low-copy-number plasmids, while auxotrophy complementation enables precise control over plasmid copy number and minimizes metabolic burden. The combination of active partitioning systems with TA modules has been demonstrated to provide superior stability compared to either system alone [35].
These technologies address critical challenges in industrial biotechnology, including reducing production costs, minimizing environmental impact, and complying with regulatory requirements for therapeutic products. Furthermore, the tunability of systems like the STAPL platform enables optimization of gene expression levels for metabolic engineering applications, directly enhancing product yields [33]. As microbial cell factories continue to evolve for production of increasingly complex biopharmaceuticals and bio-based chemicals, these advanced genetic stabilization strategies will play an essential role in ensuring manufacturing reliability, product quality, and environmental safety.
Overcoming Major Hurdles: Metabolic Burden, Toxicity, and Scalability Issues
Metabolic burden is a pervasive challenge in metabolic engineering, defined as the negative physiological impact on microbial cell factories resulting from the diversion of cellular resources toward heterologous pathway expression and product synthesis [16]. This burden manifests as impaired cell growth, reduced product yields, and decreased overall robustness, ultimately limiting the industrial potential of engineered strains [39]. As the field advances toward more complex biochemical productions, developing systematic strategies to alleviate metabolic burden has become indispensable for constructing efficient microbial cell factories capable of sustaining high-level production while maintaining cellular fitness [16] [39].
Foundational Strategies for Metabolic Burden Mitigation
Metabolic Balancing
Optimal resource allocation requires precise balancing of metabolic fluxes to prevent the accumulation of toxic intermediates and cofactor imbalances that reduce cellular fitness [16].
2.1.1 Engineering Intermediates and Cofactor Balancing: Traditional approaches involve modular pathway optimization and fine-tuning gene expression to balance carbon fluxes. In one exemplary case, fine-tuning the relative expression levels of aroL, ppsA, tktA, and aroGfbr successfully avoided accumulation of toxic 2,3-dihydroxybenzoic acid during pyrogallol production in E. coli, resulting in a 2.44-fold improvement in production (893 mg/L) [16]. Cofactor balance and redox homeostasis are typically achieved by removing competitive pathways or introducing cofactor-generating reactions [16].
2.1.2 Dynamic Pathway Regulation: Advanced metabolic balancing now employs dynamic regulation using biosensors to autonomously control metabolic fluxes based on intracellular signals [16]. This approach provides more responsive control compared to static regulation. For instance, dynamic regulation of the toxic intermediate farnesyl pyrophosphate (FPP) in isoprenoid production doubled the final titer of amorphadiene to 1.6 g/L [16]. Similarly, a bi-functional dynamic regulation system applied to cis,cis-muconic acid synthesis achieved a 4.72-fold increase in titer (1,861.9 mg/L) compared to static control [16].
Table 1: Representative Examples of Metabolic Balancing Strategies
| Strategy | Metabolic Target | Host Organism | Key Engineering Approach | Outcome | Reference |
|---|---|---|---|---|---|
| Static Modular Optimization | Pyrogallol pathway | E. coli | Fine-tuning expression of aroL, ppsA, tktA, aroGfbr | 2.44-fold increase (893 mg/L); avoided toxic intermediate accumulation | [16] |
| Dynamic Regulation | Farnesyl pyrophosphate (FPP) | E. coli | Biosensor-based control of FPP accumulation | 2-fold increase in amorphadiene titer (1.6 g/L) | [16] |
| Bi-functional Dynamic Control | cis,cis-Muconic Acid | E. coli | Up-regulation of salicylic acid synthesis; down-regulation of competing pathway for malonyl-CoA | 4.72-fold increase (1861.9 mg/L) vs. static control | [16] |
| Growth-Driven Production | L-Tryptophan | E. coli | Removal of major pyruvate-generating steps except in L-tryptophan synthesis | 2.37-fold increase in titer (1.73 g/L) | [16] |
Decoupling Cell Growth and Product Synthesis
Competition between biomass accumulation and product formation presents a fundamental challenge in metabolic engineering. Two-stage fermentation processes separate growth and production phases but require manual induction and optimal timing determination [16].
Advanced autonomous dynamical pathway control systems utilizing metabolite biosensors or quorum-sensing systems now enable more precise decoupling. Implementation of a nutrient sensor responding to glucose concentration successfully delayed vanillic acid synthesis in E. coli, reducing metabolic burden by 2.4-fold and maintaining robust growth during bioconversion [16]. A layered dynamic control strategy combining a myo-inositol biosensor (ispA) with an AHL-responsive quorum sensing system balanced production and consumption rates of the key intermediate myo-inositol while decoupling cell growth from glucaric acid production, resulting in a 5-fold increase in glucaric acid titer (2 g/L) [16].
Growth-Driven and Product-Addiction Strategies
Coupling target compound production with essential cellular processes provides a powerful alternative approach to enhance strain stability and robustness.
2.3.1 Growth-Driven Phenotypes: This strategy rewrites central metabolism to make product synthesis obligatory for growth. A pyruvate-driven L-tryptophan strain was created by eliminating major pyruvate-generating steps except those in the L-tryptophan synthesis pathway, resulting in 2.37-fold and 2.04-fold increases in L-tryptophan (1.73 g/L) and cis,cis-muconic acid (1.82 g/L) production, respectively [16]. A similar acetyl-CoA-driven approach for butanone production achieved 855 mg/L butanone with complete deprivation of supplied acetate [16].
2.3.2 Product-Addiction Systems: A more generalizable approach places essential genes under control of product-responsive biosensors. A synthetic product addiction system created for mevalonate overproduction maintained stable performance over 95 generations, demonstrating remarkable long-term stability [16].
Diagram 1: Growth-coupled and product-addiction strategies for stability.
Enhancing Genetic and Phenotype Stability
Engineered strains often suffer from genetic instability, especially when utilizing plasmid-based systems. Antibiotic-free plasmid maintenance approaches provide essential tools for sustained metabolic function [16].
2.4.1 Toxin/Antitoxin (TA) Systems: These systems utilize a stable toxin protein and less stable antitoxin. Implementation of a yefM/yoeB TA pair in Streptomyces ensured stable protein production over 8-day incubation without antibiotic selection [16].
2.4.2 Auxotrophy Complementation: This straightforward approach sequesters growth-essential genes on plasmids, creating symbiotic plasmid-cell dependency. Knockout of the tpiA gene impaired E. coli viability, while its plasmid-based complementation enabled stable β-glucanase expression [16]. A synthetic auxotrophic system based on the essential gene infA demonstrated that plasmid copy number can be controlled by varying expression levels, offering tunable stability control [16].
Table 2: Genetic Stabilization Systems for Engineered Strains
| System Type | Mechanism | Key Elements | Host Organism | Performance Outcome | Reference |
|---|---|---|---|---|---|
| Toxin/Antitoxin (TA) | Post-segregational killing; cells lose plasmid produce toxin | yefM/yoeB pair | Streptomyces | Stable protein production over 8 days | [16] |
| Auxotrophy Complementation (Non-essential gene) | Plasmid encodes gene for non-essential metabolic function | tpiA (triosephosphate isomerase) | E. coli | Stable expression of β-glucanase; growth rescue | [16] |
| Auxotrophy Complementation (Essential gene) | Plasmid encodes essential gene for cell survival | infA | E. coli | Controlled plasmid copy number; stable maintenance | [16] |
| Operator-Repressor Titration (ORT) | Competitive binding of repressor between chromosomal and plasmid operators | tetR and tetO operators | E. coli | Plasmid maintenance without antibiotics | [16] |
Advanced Protocols for Robustness Engineering
Protocol: Quantifying Microbial Robustness in Dynamic Environments Using Microfluidic Single-Cell Cultivation
This protocol enables precise assessment of microbial robustness under defined environmental perturbations at single-cell resolution [40].
3.1.1 Experimental Workflow:
Diagram 2: Workflow for microfluidic single-cell robustness analysis.
3.1.2 Materials and Reagents:
- Microfluidic Chip: Fabricated from polydimethylsiloxane (PDMS) bonded to a glass slide, featuring cultivation structures with monolayer growth chambers (4 × 90 × 80 μm) [40].
- Strain: Saccharomyces cerevisiae CEN.PK113-7D bearing the ratiometric fluorescent ATP-biosensor QUEEN-2m [40].
- Media: Synthetic defined minimal Verduyn medium with 20 g/L glucose, 5 g/L (NH₄)₂SO₄, 3 g/L KH₂PO₄, 1 g/L MgSO₄·7H₂O, trace metal and vitamin solutions; pH adjusted to 5 with KOH [40].
- Imaging System: Inverted automated microscope (e.g., Nikon Eclipse Ti2) with 100× oil objective, GFP and uvGFP filter sets, LED-based fluorescence light source, and environmental incubation cage maintaining 30°C [40].
- Fluidics System: Pressure-driven pumps (e.g., Fluigent Line-up EZ series) for medium switching [40].
3.1.3 Procedure:
- Chip Preparation: Activate PDMS mold and glass slide surfaces using oxygen plasma, then bond together to create sealed microfluidic structures [40].
- Inoculation: Inoculate chip with yeast cells at OD₆₀₀ ~0.3 [40].
- Dynamic Cultivation: Apply dynamic flow profile using pressure-driven pumps, switching between glucose-containing medium (100 mbar) and glucose-free medium (70-220 mbar) to create feast-starvation cycles with intervals ranging from 1.5 to 48 minutes over 20 hours [40].
- Image Acquisition: Capture phase-contrast and fluorescent images every 8 minutes using appropriate exposure settings (phase-contrast: 100 ms; GFP: 400 ms; uvGFP: 800 ms) [40].
- Data Analysis: Use semi-automated image analysis pipeline in Fiji for cell segmentation and tracking, followed by data analysis in R to quantify function-specific robustness using the Fano factor-derived equation: Robustness = 1 - (σ²/μ), where σ² represents variance and μ represents the mean of the function across the population or over time [40].
3.1.4 Expected Outcomes: Application of this protocol typically reveals decreasing specific growth rates but increasing intracellular ATP levels with longer oscillation intervals. Cells subjected to 48-minute oscillations typically show the highest average ATP content but the lowest temporal stability and highest population heterogeneity [40].
The Scientist's Toolkit: Essential Research Reagent Solutions
Table 3: Key Research Reagents and Materials for Metabolic Burden Research
| Reagent/Material | Function/Application | Example Use Case | Key Considerations |
|---|---|---|---|
| Ratiometric Fluorescent Biosensors (e.g., QUEEN-2m) | Real-time monitoring of intracellular metabolite levels (e.g., ATP) | Quantifying metabolic state dynamics in response to feast-starvation cycles [40] | Enables live-cell imaging without disruption; requires appropriate filter sets |
| Microfluidic Single-Cell Cultivation (dMSCC) Chips | Maintaining and manipulating microenvironments while tracking single cells | Investigating population heterogeneity under defined environmental oscillations [40] | Excellent heat and mass transfer; enables condition switching within seconds |
| Dynamic Pathway Regulation Systems | Autonomous control of metabolic fluxes based on intracellular signals | Preventing accumulation of toxic intermediates (e.g., FPP) [16] | Typically consists of biosensor, promoter, and regulatory element |
| Toxin/Antitoxin (TA) Plasmid Stabilization Systems | Maintaining plasmid stability without antibiotic selection | Ensuring stable protein production in Streptomyces over extended periods [16] | Eliminates cost and regulatory concerns of antibiotics in industrial processes |
| Synthetic Auxotrophy Complementation Systems | Creating symbiotic plasmid-cell dependency for stable maintenance | Controlling plasmid copy number via essential gene (e.g., infA) expression [16] | Provides tunable stability control without external selection agents |
Alleviating metabolic burden requires an integrated approach combining dynamic pathway control, genetic stabilization, and systematic robustness quantification. The strategies and protocols outlined provide a framework for constructing microbial cell factories that maintain high productivity while withstanding industrial-scale perturbations. Implementation of these approaches will accelerate the development of robust bioprocesses capable of sustainable biochemical production at commercial scales.
The efficiency of microbial cell factories is often severely constrained by the inherent toxicity of the valuable chemicals they are engineered to produce. Toxic end-products and intermediates, such as organic acids, alcohols, and aromatic compounds, can compromise cellular viability, thereby limiting production titers and overall process efficiency. This application note delineates two fundamental defensive strategies that microorganisms employ against such toxicity: maintaining membrane integrity and activating reactive oxygen species (ROS) detoxification systems. We provide a detailed experimental framework for characterizing these mechanisms and implementing engineering interventions to enhance microbial robustness, a critical consideration for advancing industrial bioprocesses.
Core Defense Mechanisms and Engineering Strategies
A microorganism's first line of defense against toxic compounds is its cell envelope. The second involves intricate intracellular systems to manage the oxidative stress that often accompanies metabolic imbalances induced by these toxins.
Membrane Integrity: The Primary Barrier
The plasma membrane's integrity is vital for cell function and survival, acting as a selective barrier that separates the interior from the external environment [41]. Loss of this integrity leads to a failure in maintaining electrochemical gradients, cytosolic leakage, and ultimately, cell lysis [42].
Table 1: Engineering Strategies for Enhanced Membrane Integrity and Toxicity Tolerance
| Engineering Target | Specific Strategy | Microbial Host | Toxic Compound/Stress | Outcome | Reference |
|---|---|---|---|---|---|
| Phospholipid Head Group | Modification of head group composition | Synechocystis sp. | Fatty alcohols | 3-fold increase in octadecanol productivity | [43] |
| Phospholipid Head Group | Modification of head group composition | E. coli | Octanoic acid | 66% increase in octanoic acid titer | [43] |
| Fatty Acid Chain | Adjustment of unsaturation level | E. coli | Octanoic acid | 41% increase in octanoic acid titer | [43] |
| Sterols | Enhancement of ergosterol biosynthesis | Y. lipolytica | Organic solvents | 2.2-fold increase in ergosterol content | [43] |
| Membrane Transport | Overexpression of endogenous transporter | S. cerevisiae | β-carotene | 5.8-fold increase in secretion | [43] |
| Membrane Transport | Overexpression of heterologous transporter | S. cerevisiae | Fatty alcohols | 5-fold increase in secretion | [43] |
| Cell Wall | Engineering of peptidoglycan/glucan components | E. coli | Mechanical stress, Ethanol | 93% increase in PHB accumulation; 30% increase in ethanol titer | [43] |
ROS Detoxification: Managing Oxidative Stress
The accumulation of toxic intermediates or products can induce oxidative stress, a state where the generation of Reactive Oxygen Species (ROS) like superoxide anion (O₂•⁻), hydrogen peroxide (H₂O₂), and hydroxyl radicals (OH•) surpasses the cell's detoxification capacity [44] [45]. These ROS can cause damage to DNA, peroxidate lipids, and carbonylate proteins, leading to impaired metabolic function and cell death [44] [45]. Microorganisms counteract this with a sophisticated arsenal of enzymatic and non-enzymatic antioxidants.
Table 2: Key Cellular Components in ROS Management and Detoxification
| Component | Type | Primary Function in ROS Detoxification |
|---|---|---|
| Superoxide Dismutase (SOD) | Enzyme | Catalyzes the dismutation of superoxide (O₂•⁻) into oxygen and hydrogen peroxide (H₂O₂). |
| Catalase (CAT) | Enzyme | Converts hydrogen peroxide (H₂O₂) into water and oxygen. |
| Glutathione Peroxidase (GPx) | Enzyme | Reduces lipid hydroperoxides and H₂O₂ to their corresponding alcohols, oxidizing glutathione (GSH) in the process. |
| Glutathione (GSH) | Non-enzymatic Antioxidant | A major cellular thiol that acts as a redox buffer, directly scavenging ROS and serving as a cofactor for GPx. |
| Thioredoxin | Non-enzymatic Antioxidant | A small redox protein that facilitates the reduction of other proteins by cysteine thiol-disulfide exchange. |
Figure 1: ROS Detoxification Pathway. This diagram outlines the primary pathways for the generation and neutralization of key Reactive Oxygen Species (ROS). Superoxide is converted to hydrogen peroxide by Superoxide Dismutase (SOD). Hydrogen peroxide can then be safely decomposed into water and oxygen by Catalase, or, in the presence of iron, form the highly reactive hydroxyl radical via the Fenton reaction. Glutathione (GSH) and Glutathione Peroxidase (GPx) play a key role in mitigating damage from these secondary radicals.
Application Notes & Experimental Protocols
Protocol 1: Assessing Membrane Integrity
Principle: This protocol uses dye exclusion assays to evaluate plasma membrane integrity. Viable cells with intact membranes exclude charged dyes, whereas cells with compromised membranes allow dye entry and nucleic acid binding, resulting in fluorescence [42].
Workflow:
Figure 2: Membrane Integrity Assessment Workflow. A step-by-step flow chart for evaluating membrane integrity in cultured cells following exposure to a toxic compound.
Materials & Reagents:
- Propidium Iodide (PI) Stock Solution: 1 mg/mL in water. Function: Membrane-impermeant fluorescent dye that binds nucleic acids in cells with compromised membranes [42].
- Phosphate Buffered Saline (PBS): For washing and resuspending cells.
- Flow Cytometer or Fluorescence Microscope: For quantification and visualization.
Procedure:
- Cell Culture & Treatment: Grow the microbial culture to mid-log phase. Split the culture into two flasks: a untreated control and a treatment flask exposed to the target toxic compound (e.g., biofuel, organic acid). Incubate for a predetermined period.
- Staining: Harvest 1 mL of culture from each condition by centrifugation. Resuspend the cell pellet in 1 mL of PBS containing a final concentration of 1-5 µg/mL PI. Vortex gently and incubate for 15-30 minutes in the dark at room temperature.
- Analysis: Wash the cells once with PBS to remove excess dye. Resuspend in fresh PBS and analyze immediately.
- Flow Cytometry: Set excitation to ~535 nm and collect fluorescence emission at ~617 nm. Analyze at least 10,000 events per sample. The percentage of the PI-positive population indicates the proportion of cells with damaged membranes.
- Microscopy: Visualize using a fluorescence microscope with a red filter set. Intact cells will not fluoresce, while cells with compromised membranes will display red nuclear staining.
Protocol 2: Quantifying Intracellular ROS Levels
Principle: Cell-permeant fluorescent probes like H₂DCFDA are oxidized by intracellular ROS, yielding a fluorescent product that can be quantified to measure oxidative stress levels.
Workflow:
Figure 3: Intracellular ROS Quantification Workflow. A visual guide for the protocol to measure reactive oxygen species in cell populations using a fluorescent probe.
Materials & Reagents:
- H₂DCFDA (2',7'-Dichlorodihydrofluorescein diacetate) Stock Solution: 10 mM in DMSO. Function: Cell-permeant ROS sensor. It is deacetylated by cellular esterases and then oxidized by intracellular ROS to the highly fluorescent DCF [45].
- Positive Control: Menadione (100-500 µM) or Hydrogen Peroxide (1-5 mM). Function: Induces ROS generation to validate the assay.
- Microplate Reader or Flow Cytometer: For fluorescence quantification.
Procedure:
- Probe Loading: Harvest cells from mid-log phase culture, wash, and resuspend in buffer without a carbon source. Add H₂DCFDA to a final concentration of 10-50 µM. Incubate for 30-60 minutes in the dark with gentle shaking.
- Stress Induction & Measurement: Wash the cells to remove excess probe. Resuspend in fresh medium and divide into aliquots for treatment with the toxic compound and controls.
- Kinetic Measurement (Microplate Reader): Transfer 200 µL of cell suspension to a black 96-well plate. Record fluorescence (Ex/Em: ~485/535 nm) every 5-10 minutes for 1-2 hours. The slope of the fluorescence increase is proportional to the ROS generation rate.
- Endpoint Measurement (Flow Cytometry): After a defined exposure period (e.g., 60 minutes), analyze the cells by flow cytometry (Ex: 488 nm, Em: 530/30 nm). The mean fluorescence intensity of the population reflects the intracellular ROS level.
Protocol 3: Adaptive Laboratory Evolution (ALE) for Enhanced Robustness
Principle: ALE applies selective pressure over serial passages to enrich for spontaneous mutants with improved fitness under stress conditions, such as toxin presence or ROS [43] [46].
Procedure:
- Inoculation: Start multiple (e.g., 5-10) parallel evolution lines from a single clonal population.
- Serial Transfer: Grow cultures in flasks containing a sub-lethal concentration of the target toxic compound. At regular intervals (e.g., every 24-48 hours, or as growth reaches stationary phase), transfer a small aliquot (1-5% v/v) of the culture into fresh medium containing the same or a slightly increased concentration of the toxin.
- Monitoring: Monitor growth (OD₆₀₀) throughout the process. The evolution is typically continued for several tens to hundreds of generations until a stable, improved growth phenotype is observed.
- Isolation and Characterization: Plate evolved cultures to isolate single clones. Re-test these isolates for improved tolerance and production characteristics. Use whole-genome sequencing or whole-population sequencing (Pool-Seq) to identify causative mutations underlying the evolved phenotype.
The Scientist's Toolkit: Key Research Reagents
Table 3: Essential Reagents for Toxicity and Robustness Research
| Reagent/Catalog Number | Function | Key Application |
|---|---|---|
| Propidium Iodide (PI) | Membrane-impermeant nucleic acid stain | Viability staining and membrane integrity assessment via flow cytometry or microscopy [42]. |
| H₂DCFDA / DCFH-DA | Cell-permeant fluorescent probe for general ROS | Quantification of intracellular oxidative stress levels (e.g., H₂O₂, peroxynitrite) [45]. |
| MitoSOX Red | Mitochondrial superoxide indicator | Specific detection of mitochondrial superoxide (O₂•⁻) generation. |
| Antibiotic & Antifungal Cocktails | Suppress microbial contamination | Maintain axenic cultures during long-term evolution or fermentation experiments. |
| Menadione / Tert-Butyl Hydroperoxide | Chemical inducers of oxidative stress | Used as positive controls in ROS detection assays to validate experimental setup [45]. |
| SYTOX Green/Orange | Alternative membrane-impermeant nucleic acid stains | Dead cell stains for viability assays, often used in combination with other fluorescent probes. |
Concluding Remarks
Enhancing the robustness of microbial cell factories is a multi-faceted challenge that requires a deep understanding of cellular defense mechanisms. Systematic engineering of the cell envelope to fortify membrane integrity, coupled with strategies to manage and mitigate oxidative stress, provides a powerful framework for overcoming the critical bottleneck of product and intermediate toxicity. The application notes and standardized protocols detailed herein offer a practical roadmap for researchers to diagnose tolerance limitations and implement effective engineering solutions, thereby accelerating the development of efficient and industrially viable bioprocesses.
A central challenge in metabolic engineering is the inherent competition between cell growth and product synthesis in microbial cell factories. Static engineering approaches often prove suboptimal, as the metabolic state ideal for rapid biomass accumulation is rarely the same as that for high-yield product formation [8]. This limitation has spurred the development of advanced strategies that dynamically separate these phases. By programming cells to first grow to a high density and then switch to a high-production mode, it is possible to maximize both objectives sequentially, thereby enhancing overall process robustness and productivity [8]. This article details two powerful, complementary approaches to this dynamic control: two-stage fermentations and inducible genetic switches, providing application notes and detailed protocols for their implementation.
Two-Stage Microfermentations: A High-Throughput Platform
Concept and Rationale
Two-stage fermentations physically and temporally decouple growth from production. Stage 1 is dedicated to achieving high cell density, while Stage 2 is triggered by a specific environmental cue that halts growth and initiates product synthesis [47] [48] [49]. This decoupling simplifies process control and standardizes strain evaluation, which is crucial for reliably assessing the hundreds of strain variants generated with modern synthetic biology tools [47].
A key advantage of this system is its use of a simple, scalable trigger: phosphate depletion. This makes the transition from growth to production phase controllable and reproducible across different scales [48]. The methodology has been successfully developed for E. coli but is designed for adaptation to other cellular hosts and alternative triggers [47].
Detailed Protocol: Two-Stage Microfermentation inE. coli
This protocol outlines a high-throughput method for evaluating engineered strains in microtiter plates [47] [48].
- Objective: To separate biomass accumulation (Stage 1) from product synthesis in stationary phase (Stage 2), using phosphate depletion as an automatic and inducer-free trigger for heterologous expression.
- Strain Requirements: Engineered E. coli strains with production pathways designed for phosphate-dependent dynamic control.
Procedure:
Medium Preparation:
- Prepare a defined medium with a limiting concentration of phosphate (e.g., 1-5 mM). The exact concentration must be determined empirically to support robust growth in Stage 1 while ensuring complete depletion triggers Stage 2.
- Include all other necessary nutrients (e.g., carbon source, nitrogen, trace metals) in non-limiting quantities.
Stage 1: Growth Phase:
- Inoculate the defined medium in a 96-deepwell plate with the engineered E. coli strain from a single colony or pre-culture.
- Incubate the plate with continuous shaking at the appropriate temperature (e.g., 37°C) until the phosphate in the medium is fully consumed. This point is typically marked by the cessation of exponential growth, which can be monitored by optical density (OD600).
Transition to Stage 2: Production Phase:
- The depletion of phosphate automatically serves as the transition signal. No manual induction is needed.
- For some protocols, a cell washing step may be incorporated at this stage to remove growth-phase metabolites and provide a fresh production medium [47].
- Continue incubation with shaking. During this stationary phase, the engineered genetic circuit activates the heterologous pathway, leading to product synthesis.
Monitoring and Analysis:
- Monitor growth by periodically measuring OD600.
- Quantify product formation using appropriate analytical methods (e.g., HPLC, GC-MS, fluorescence assays) from samples taken throughout Stage 2.
Table 1: Key Process Parameters for Two-Stage Microfermentations
| Parameter | Stage 1: Growth | Stage 2: Production | Considerations |
|---|---|---|---|
| Phosphate | Non-zero, limiting concentration | Fully depleted | Serves as the process trigger |
| Cell State | Exponential growth | Stationary phase | Growth arrest is required for production |
| Primary Objective | Biomass accumulation | Product synthesis | - |
| Process Monitoring | OD600 (growth) | Product titer/yield | - |
Dynamic Metabolic Switches for Autonomous Control
Concept and Rationale
While two-stage fermentations use process parameters as a trigger, dynamic metabolic switches employ intracellular sensing to autonomously control gene expression. Quorum sensing (QS) is a powerful tool for this, as it allows cells to sense population density and trigger genetic programs without external inducer addition, reducing cost and operational complexity [50].
A prime application is the PhrC-RapC-SinR QS system in Bacillus subtilis. This system dynamically represses competing pathways to redirect metabolic flux toward the target product, thereby balancing the often-conflicting demands of cell growth and product synthesis [50].
Case Study & Protocol: Dynamic Regulation of Menaquinone-7 (MK-7) inB. subtilis
This protocol details the construction of a PhrC-RapC-SinR molecular switch to enhance MK-7 production [50].
- Objective: To auto-regulate bypass pathways for phenylalanine, tyrosine, tryptophan, folic acid, dihydroxybenzoate, and hydroxybutanone in B. subtilis 168, channeling precursors toward MK-7 synthesis.
- Engineering Principle: As cell density increases, the extracellular PhrC peptide accumulates. Upon import into the cell, it inhibits RapC, which relieves the repression of SinR. SinR then acts as a repressor of the targeted bypass pathway genes, reducing their expression and redirecting flux to MK-7.
Procedure:
Genetic Modifications:
- Promoter Engineering: Identify and clone the native promoters of the key genes in the targeted bypass pathways. Replace these native promoters with a SinR-regulated promoter (containing the SinR-binding sequence 5'-GTTCTYT-3').
- Circuit Assembly: Ensure the constitutive expression of the SinR repressor and the genes for the PhrC-RapC system are stably integrated into the genome or placed on a plasmid.
Strain Cultivation:
- Media: Use LB medium for genetic construction and a defined fermentation medium (e.g., containing soybean peptone, glycerol, and yeast extract) for production assays.
- Culture Conditions: Grow engineered B. subtilis strains at 37°C.
System Operation and Validation:
- Low Cell Density: During early growth, SinR repression is active, minimally affecting bypass pathways to support biomass accumulation.
- High Cell Density: At a threshold density, accumulated PhrC peptide is imported and inhibits RapC. This derepresses SinR, which then strongly represses the bypass pathway promoters, shunting precursors (e.g., DHAP, chorismate) into the MK-7 synthesis pathway.
- Analysis: Monitor cell growth (OD600) and quantify MK-7 titer (e.g., via HPLC) over time to confirm the dynamic behavior and enhanced production.
Table 2: Performance of the PhrC-RapC-SinR Dynamic Switch in B. subtilis
| Strain/Condition | MK-7 Titer (mg/L) | Fold Increase | Key Observation |
|---|---|---|---|
| Wild-type Control | 13.95 | (Baseline) | - |
| QS-Engineered Strain | 87.52 | 6.27 | Balanced growth and production |
| Static Knock-out | ~15.4 | ~1.1 | Severe growth impairment |
The Scientist's Toolkit: Research Reagent Solutions
Table 3: Essential Reagents for Implementing Dynamic Control Strategies
| Reagent / Tool | Function / Application | Example / Note |
|---|---|---|
| Phosphate-Limited Medium | Enables growth-to-production transition in 2-stage fermentations | Defined medium with [PO₄] < 5 mM [47] |
| SinR Repressor Protein | Binds DNA to repress transcription in QS switches | Binds consensus sequence 5'-GTTCTYT-3' [50] |
| PhrC Peptide (PhrC-5) | Signaling molecule in QS; inhibits RapC | Secreted and re-imported via Opp transporter [50] |
| RapC Phosphatase | Regulatory node in QS cascade; repressed by PhrC | Controls activity of downstream response regulators [50] |
| Constitutive Promoters | Drives constant expression of regulatory elements (e.g., SinR) | Essential for foundational circuit components [50] |
| SynTF-based Circuits | Artificial genetic circuits for dynamic pathway control | Can be designed to inhibit host metabolism [8] |
| Coproporphyrinogen III Dehydrogenase (HemY/YfeX) | Enzyme in CPD heme pathway for precursor production | Enables extracellular precursor synthesis [51] |
| Coproheme Decarboxylase (ChdC/HemH) | Cell-free enzyme for heme synthesis | Converts Fe-CP-III to heme in vitro [51] |
The strategic decoupling of cell growth and product synthesis represents a paradigm shift in metabolic engineering, moving beyond static optimization. Two-stage fermentations provide a standardized, high-throughput platform for strain evaluation using simple process triggers like phosphate depletion [47] [48]. In parallel, autonomous dynamic switches, such as the PhrC-RapC-SinR QS system, offer a powerful means to internally rewire metabolism in response to cell density, effectively balancing metabolic burden and product yield [50]. The application of these strategies, supported by the detailed protocols provided, enables the creation of more robust and productive microbial cell factories, which is a core objective in advancing industrial biotechnology.
In the pursuit of sustainable biomanufacturing, engineering robust microbial cell factories (MCFs) is paramount. Strain robustness—the ability of a microbe to maintain stable production performance despite genetic, metabolic, or environmental perturbations—is essential for transitioning laboratory successes to industrial-scale production [1]. Traditional metabolic engineering approaches often rely on intuitive, single-point modifications, which frequently fail to account for the complex, systemic interactions within cellular metabolic networks and the harsh realities of large-scale bioreactors [52] [53]. Computational design aids have emerged as powerful tools to overcome these limitations. By integrating Genome-Scale Models (GEMs) and Machine Learning (ML) with advanced synthetic biology techniques, researchers can now perform rational, systems-level strain design, predicting and engineering microbial hosts for enhanced robustness and productivity from the outset [52] [54] [1].
Genome-Scale Metabolic Models (GEMs) for Predictive Strain Design
Genome-Scale Metabolic Models (GEMs) are mathematically structured representations of an organism's metabolic network, encompassing all known biochemical reactions, genes, and metabolites [52]. They serve as in silico replicas of cellular metabolism, enabling researchers to simulate metabolic fluxes, identify potential bottlenecks, and predict the outcomes of genetic interventions before conducting wet-lab experiments.
GEM Reconstruction and Validation Protocol
Protocol 1: Reconstruction and Curation of a High-Quality GEM
- Draft Model Reconstruction: Employ a scaffold-based approach using a well-curated GEM of a phylogenetically close organism (e.g., using the CLIB122 strain model for Yarrowia lipolytica W29). Identify gene homologs and transfer metabolic reactions based on functional conservation [52].
- Manual Curation and Gap-Filling: Manually refine the draft model using organism-specific genomic, biochemical, and physiological data. Fill metabolic gaps (missing reactions) to ensure network connectivity and functionality, often utilizing biochemical databases and literature evidence.
- Compartmentalization: Distribute metabolites and reactions across relevant cellular compartments (e.g., cytosol, mitochondria, peroxisome). The model iWT634 for Y. lipolytica, for instance, comprises 1364 reactions across eight compartments [52].
- Model Validation: Validate the model's predictive capability by comparing its simulations with experimental data:
- Phenotype Prediction: Test the model's accuracy in predicting growth capabilities on different carbon sources (e.g., achieving 88.9% accuracy on 18 carbon sources) [52].
- Growth Rate Correlation: Assess the correlation coefficient (R²) between simulated growth rates and experimentally measured rates (e.g., R² = 0.98) [52].
Application of GEMs for Succinic Acid Production inYarrowia lipolytica
The application of GEMs in designing a robust succinic acid producer from Yarrowia lipolytica strain W29 demonstrates their power. The following table summarizes key in silico predictions and their validated outcomes for enhancing succinic acid flux [52].
Table 1: GEM-Predicted Genetic Interventions for Enhanced Succinic Acid Production in Y. lipolytica
| Intervention Type | Target Gene/Pathway | Predicted Effect | Resulting SA Flux (mmol/gDW/h) | Theoretical Yield Increase |
|---|---|---|---|---|
| Gene Knockout | Succinate Dehydrogenase (SDH) | Blocks oxidative TCA branch, redirecting flux to SA | 4.36 | 0.56 g/g glycerol [52] |
| Gene Knockout | Acetyl-CoA Hydrolase (ACH) | Suppresses acetate co-production | 4.36 | 0.56 g/g glycerol [52] |
| Enzyme Overexpression | Pyruvate Carboxylase (PC) | Enhances anaplerotic flux into oxaloacetate | - | Up to 186% [52] |
| Enzyme Overexpression | TCA/Glyoxylate Cycle Enzymes | Boosts reductive SA synthesis and carbon efficiency | - | Up to 186% [52] |
Protocol 2: In Silico Strain Design Using GEMs
- Objective Definition: Define the biological objective, typically maximizing the production rate of a target compound (e.g., succinic acid) under simulated growth conditions.
- Constraint-Based Modeling: Use methods like Flux Balance Analysis (FBA) to simulate metabolic fluxes. Constraints include substrate uptake rate and ATP maintenance requirements.
- Identification of Intervention Targets: Leverage algorithms to systematically identify gene knockout (e.g., OptKnock), knockdown, or overexpression targets that couple product synthesis with growth [52].
- Validation and Refinement: Test the predicted genetic modifications in vivo and use the resulting experimental data (e.g., growth rates, product titers) to further refine and validate the model, creating an iterative design-build-test-learn cycle.
The diagram below illustrates the integrated computational and experimental workflow for GEM-guided strain design.
Machine Learning for Biological System Prediction and Optimization
While GEMs provide a mechanistic framework, Machine Learning (ML) excels at finding complex, non-linear patterns in large, high-dimensional biological datasets, offering a complementary approach to strain design [54].
Key ML Applications in Strain Design
- Protein Engineering: ML models predict the functional outcomes of protein sequences, guiding the design of enzymes with improved stability, solubility, and catalytic efficiency for non-native environments [55].
- Pathway Optimization: ML analyzes multi-omic data (genomics, transcriptomics, metabolomics) to predict optimal expression levels of pathway enzymes, balancing flux and minimizing metabolic burden [54] [56].
- Predicting Cellular Phenotypes: ML models learn from experimental data to predict how genetic modifications or environmental changes will affect complex phenotypes like growth, tolerance, and productivity [54].
The synergy between ML and other computational tools creates a powerful engineering loop, as visualized below.
Engineering for Robustness in Industrial Bioprocesses
A robust strain must maintain performance not only in controlled lab conditions but also in the heterogeneous environment of large-scale industrial bioreactors, which feature gradients in nutrients, pH, and dissolved oxygen [53]. Computational frameworks are key to addressing these challenges.
Computational Strategies for Robustness
- Alleviating Metabolic Burden: Rewiring metabolism for production often imposes a substantial burden, diverting resources from growth and leading to genetic instability. GEMs and constrained models can predict optimal flux distributions that balance production with cellular fitness. Strategies include dynamic pathway control and using microbial consortia for division of labor [56].
- Transcription Factor (TF) Engineering: Global Transcription Machinery Engineering (gTME) introduces mutations into generic transcription factors (e.g., σ⁷⁰ in E. coli) to reprogram cellular gene networks broadly, enhancing tolerance to stresses like ethanol, low pH, and high osmolarity [1].
- Membrane and Transporter Engineering: The cell membrane is the primary barrier against environmental stress. Computational models can guide engineering of membrane lipid composition (e.g., increasing unsaturated fatty acid content via Δ9 desaturase Ole1) to improve integrity and tolerance [1].
- Integration with Computational Fluid Dynamics (CFD): To simulate industrial-scale conditions, spatiotemporal multiscale cellular models (like kinetic models derived from GEMs) can be coupled with CFD models of bioreactor fluid dynamics. This integration predicts how environmental fluctuations in a large tank will impact cell physiology and production, guiding the design of more robust strains and bioreactors [53].
Essential Research Reagent Solutions
The following table catalogues key reagents, tools, and software essential for implementing the computational strain design strategies discussed.
Table 2: Research Reagent Solutions for Computational Strain Design
| Category | Item/Software | Function/Application |
|---|---|---|
| Modeling & Simulation Software | COBRA Toolbox | A MATLAB suite for constraint-based reconstruction and analysis (GEM simulation) [52]. |
| OptKnock/FBA | Algorithms for identifying gene knockout targets that couple growth with production [52]. | |
| Machine Learning Toolboxes | Scikit-learn (Python) | Provides standard algorithms for regression, classification, and clustering on biological data [54]. |
| Deep Learning Frameworks (TensorFlow, PyTorch) | For building complex neural network models on large omics datasets [54]. | |
| Databases | KEGG, BioCyc, BRENDA | Provide curated information on metabolic pathways, genes, and enzyme kinetics for model reconstruction [54]. |
| Biological Materials | Genome-Scale Model (e.g., iWT634) | A validated GEM of Y. lipolytica W29 for predicting succinic acid engineering targets [52]. |
| gTME Mutant Libraries | Libraries of mutated global transcription factors (e.g., Spt15 for yeast) for screening improved robustness [1]. | |
| Plasmid Systems for Dynamic Control | Vectors containing inducible promoters or biosensors for dynamic pathway regulation to lessen burden [56]. |
Concluding Remarks
The integration of Genome-Scale Models and Machine Learning marks a paradigm shift in metabolic engineering, moving from ad-hoc, intuitive modifications to a predictive and systematic framework for strain design. GEMs provide a mechanistic understanding of the metabolic network, enabling in silico prediction of effective genetic interventions. ML complements this by extracting hidden patterns from complex data, accelerating the optimization of pathways and cellular functions. Together, these computational aids are indispensable for engineering the next generation of robust microbial cell factories that can withstand the rigors of industrial bioprocessing, thereby paving the way for more efficient and sustainable biomanufacturing.
The development of robust microbial cell factories is pivotal for sustainable industrial biomanufacturing. While rational engineering employs targeted genetic modifications based on prior knowledge, it often struggles with the complexity of cellular networks and unpredictable phenotypic outcomes. Adaptive Laboratory Evolution (ALE) offers a complementary "irrational design" approach, simulating natural selection to evolve strains with enhanced traits like stress tolerance and production capacity under controlled serial culturing [57] [1]. The integration of these two paradigms creates a powerful synergistic workflow, leveraging the empirical strength of ALE to bypass system complexities and the precision of rational design to refine and stabilize high-performing phenotypes. This combined strategy is particularly effective for enhancing microbial robustness—the ability to maintain stable production performance under industrial-scale perturbations [1]. Framed within a broader thesis on increasing microbial cell factory robustness, this article provides detailed application notes and protocols for implementing integrative ALE-Rational Engineering solutions, focusing on the model organism Escherichia coli.
ALE Methodological Principles and Experimental Design
Adaptive Laboratory Evolution operates on the principle of imposing artificial selection pressures over numerous generations to enrich beneficial mutations. The molecular basis involves random mutations from DNA replication errors (spontaneous rate ~1 × 10⁻³ per gene per generation) and stress-induced DNA repair processes like the SOS response, which upregulates error-prone DNA polymerases [57]. ALE-induced mutations are categorized into: (1) Recurrent mutations (identical mutations in different strains under identical pressure), (2) Reverse mutations (restoring ancestral gene functions), and (3) Compensatory mutations (activating bypass pathways) [57].
Core ALE Experimental Platforms
ALE experiments primarily utilize three technical modules, each with distinct advantages and applications summarized in Table 1.
Table 1: Comparison of Core ALE Experimental Platforms
| Platform | Key Feature | Primary Application | Mutational Dynamics |
|---|---|---|---|
| Continuous Transfer (Serial Batch) | Manual serial passaging in culture tubes/flasks [57] | General phenotypic optimization; fundamental evolution studies [57] | Accelerated fixation of dominant genotypes; risk of losing low-frequency beneficial mutations [57] |
| Chemostat | Continuous cultivation with fixed dilution rate controlling growth rate [57] | Studying evolution under specific, steady-state metabolic fluxes [57] | Mutations optimizing substrate consumption at fixed growth rate |
| Turbidostat | Continuous cultivation with cell density-controlled fresh medium delivery [57] | Selecting for maximal growth rate under constant, high nutrient availability [57] | Mutations conferring maximal growth advantage in rich medium |
Detailed Protocol: Continuous Transfer ALE
This protocol outlines the foundational continuous transfer method for ALE in E. coli.
- Primary Goal: Evolve strains with improved tolerance to inhibitory compounds (e.g., biofuels, organic acids) or enhanced substrate utilization.
- Strain Background: E. coli K-12 MG1655 or other relevant production strain.
- Duration: 200–1000 generations (typically 2–4 months).
Materials and Reagents
- M9 Minimal Medium: Prepare M9 salts (e.g., Na₂HPO₄, KH₂PO₄, NH₄Cl, NaCl), supplement with 2 mM MgSO₄, 0.1 mM CaCl₂, and a carbon source (e.g., 2–4 g/L glucose). For stress ALE, add the target stressor (e.g., ethanol, butanol, acetate) [57] [1].
- Antibiotics: If required for plasmid maintenance.
- Sterile Culture Tubes or Flasks.
- Orbital Shaker Incubator (37°C).
- Spectrophotometer for OD₆₀₀ measurement.
Procedure
- Inoculation: Inoculate a single colony of the base strain into a test tube containing 5–10 mL of M9 medium with the target carbon source.
- Initial Growth: Grow the culture for 24 hours at 37°C with shaking (200–250 rpm). This is the parent culture (P₀).
- Serial Passaging: a. Measure the OD₆₀₀ of the P₀ culture. b. Aseptically transfer a small volume (typically 1–5% of the total culture volume) into a fresh tube containing the same medium. The transfer volume is critical: a low volume (1–5%) accelerates fixation of dominant genotypes but risks losing beneficial mutations, while a higher volume (10–20%) preserves diversity [57]. c. Incubate the new culture as before. This constitutes one passage. d. Repeat this transfer process daily or at a fixed interval, ensuring transfers occur before the culture enters the death phase, typically at the transition to stationary phase [57].
- Monitoring and Storage: a. Regularly monitor growth by measuring OD₆₀₀ over time to calculate specific growth rates and track adaptation. b. Periodically (e.g., every 50–100 generations), archive frozen glycerol stocks (15–25% final glycerol concentration) at -80°C of the evolving population for retrospective analysis.
Data Analysis
- Growth Kinetics: Plot specific growth rate (μ) and maximum OD₆₀₀ over generations to quantify fitness gains.
- Selection Pressure: For stress ALE, gradually increase the concentration of the inhibitory compound as adaptation is observed to maintain effective selection pressure.
Synergistic Integration with Rational Engineering
The true power of this approach lies in the iterative cycling of ALE and rational engineering. ALE can be used to optimize strains pre- or post-rational design, or the two can be deeply intertwined in continuous systems.
Application Workflow
The following diagram illustrates the core iterative workflow for integrating ALE with rational engineering.
Case Study Protocol: Enhancing L-Tryptophan Production inE. coli
This protocol demonstrates the integrated approach to develop a high-yield Trp producer, based on [58].
- Rationale: Inactivating the native Phosphotransferase System (PTS) for glucose uptake can theoretically double the Trp yield by saving phosphoenolpyruvate (PEP), a precursor for Trp synthesis. However, PTS-negative strains grow poorly. ALE restores growth while maintaining high yield [58].
- Goal: Engineer a PTS-defective E. coli with high Trp yield and robust growth.
Stage 1: Rational Engineering of a PTS-Defective Strain
- Step 1 – Base Strain: Start with a rationally engineered Trp-producing E. coli strain (e.g., S028 from literature) [58].
- Step 2 – PTS Inactivation: Use CRISPR/Cas9 to knockout the ptsI gene (encoding Enzyme I of the PTS system) in the base strain.
- Step 3 – Enable Alternative Uptake: Introduce a plasmid expressing the galactose permease (galP) and glucokinase (glk) genes under a tunable promoter (e.g., PJ23119) to facilitate PTS-independent glucose uptake [58].
- Outcome: The resulting strain (e.g., G028) is PTS-negative and GalP/Glk-dependent but exhibits impaired growth.
Stage 2: ALE for Growth Recovery and Performance Enhancement
- ALE Method: Perform ALE in M9 minimal medium with glucose using a turbidostat system to maintain continuous, rapid growth.
- Automated Continuous Evolution (Advanced): Integrate CRISPR/Cas9-facilitated in vivo mutagenesis with real-time monitoring of optical density (growth) and Trp-mediated fluorescence (productivity). This auto-CGSS system automatically enriches mutants with improved growth and production [58].
- Outcome: After ~100s of generations, isolate evolved clones (e.g., strain T5) showing restored growth and increased Trp yield (0.164 g/g glucose vs. 0.137 g/g in the pre-ALE strain) [58].
Stage 3: Final Rational Optimization
- Step 1 – Genotype-Phenotype Mapping: Sequence the evolved strain T5 to identify beneficial mutations.
- Step 2 – Incorporate Beneficial Enzymes: Stably integrate previously engineered enzyme variants (e.g., AroGD6G−D7A and AnTrpCR378F) that are known to enhance flux and deregulate the Trp pathway [58].
- Final Validation: Perform fed-batch fermentation. The final strain (T5AA) achieves a Trp yield of 0.195 g/g glucose and a high specific production rate of 28.83 mg/g DCW/h [58].
Table 2: Key Reagent Solutions for Integrated Strain Engineering
| Reagent / Tool | Function / Application | Example(s) from Literature |
|---|---|---|
| CRISPR/Cas9 System | Targeted gene knockouts (e.g., ptsI) and in vivo mutagenesis during continuous ALE [58]. | pCas9 plasmid; sgRNA targeting ptsI [58]. |
| Tunable Promoters | Modulate expression of key genes (e.g., galP/glk) to balance metabolic burden and function [58]. | PJ23119 series promoters [58]. |
| Genome-Scale Model (GEM) | In silico prediction of theoretical yields, flux bottlenecks, and gene knockout targets [59]. | GEMs of E. coli, B. subtilis, C. glutamicum, P. putida, S. cerevisiae [59]. |
| Fluorescent Biosensors | Online, real-time monitoring of product formation (e.g., Trp) during evolution in automated systems [58]. | Trp-responsive biosensor for fluorescence output [58]. |
| Global Transcription Factor Engineering (gTME) | Reprogramming global gene expression to enhance complex traits like robustness [1]. | Mutant sigma factor δ70 (rpoD) for ethanol tolerance; cAMP receptor protein (CRP) engineering [1]. |
The strategic integration of Adaptive Laboratory Evolution and Rational Engineering represents a paradigm shift in constructing robust microbial cell factories. This synergistic approach leverages the power of natural selection to solve complex biological problems that are intractable by design alone, followed by rational analysis and precision engineering to lock in and enhance the evolved traits. The provided application notes and detailed protocols for ALE setups and the L-tryptophan case study offer a actionable framework for researchers. By adopting this iterative, hypothesis-generating workflow, scientists can accelerate the development of strains with enhanced industrial robustness, capable of maintaining high productivity under the challenging conditions of scale-up bioprocesses.
Quantifying and Benchmarking Robustness for Informed Strain Selection
In both natural habitats and industrial bioprocesses, microorganisms exist not in static environments but in dynamic ones, experiencing fluctuations in parameters like substrate concentration and pH within timeframes ranging from seconds to days [40]. This is particularly pronounced in large-scale industrial bioreactors, where insufficient mixing leads to gradients that can decrease productivity, increase metabolic costs, and foster population heterogeneity [40] [60]. The ability of a microbial cell factory to maintain stable function—a property known as robustness—in the face of such perturbations is crucial for reproducible and efficient bioprocessing [6]. Robustness refers specifically to the stability of a function (e.g., yield, titer, or specific rates) when a system is subjected to perturbations, going beyond mere growth tolerance to focus on production performance stability [6].
Traditional scale-down reactors simulate large-scale gradients but often lack single-cell resolution and the ability to control rapid, metabolism-independent environmental changes [40] [60]. Dynamic Microfluidic Single-Cell Cultivation (dMSCC) has emerged as a powerful tool to overcome these limitations. By enabling precise control of microenvironments and tracking of individual cells over time, dMSCC allows researchers to investigate cellular performance and robustness at unprecedented resolution [40] [61]. This application note details how dMSCC, combined with live-cell imaging and robustness quantification, can be deployed to analyze microbial cell factories, providing a high-throughput pipeline for assessing strain stability and guiding robust bioprocess development.
Key Quantitative Insights from dMSCC Studies
dMSCC experiments generate rich, quantitative datasets on physiological and morphological responses. The tables below summarize key findings from recent investigations into microbial behavior under dynamic conditions.
Table 1: Impact of Dynamic Conditions on Key Physiological Parameters in S. cerevisiae
| Oscillation Period (min) | Specific Growth Rate | Intracellular ATP Levels | ATP Stability Over Time | Population Heterogeneity | Strain-Specific Responses |
|---|---|---|---|---|---|
| 1.5 - 6 | Higher | Lower | Higher | Lower | CEN.PK113-7D showed increased oxidative stress response [60]. |
| 24 - 48 | Lower | Higher | Lower | Higher | Ethanol Red showed highest robustness to substrate oscillations [60]. |
| Impact of Parameter | Decreases with longer oscillation intervals [40]. | Increases with longer oscillation intervals [40]. | Lowest at the longest (48 min) intervals [40]. | Highest at the longest (48 min) intervals [40]. | PE-2 showed higher relative glycolytic flux [60]. |
Table 2: dMSCC Experimental Parameters for Emulating Bioreactor Gradients
| Experimental Parameter | Typical Range/Settings | Rationale and Context |
|---|---|---|
| Oscillation Frequencies | 0.75, 1.5, 6, 12, 24, 48 min [40] [60] | Mimics mixing times and gradient exposures in large-scale bioreactors (seconds to minutes) [60]. |
| Glucose Concentration (Feast) | 20 - 50 g/L [40] [60] | Represents substrate excess and can induce osmotic stress, simulating industrial conditions [60]. |
| Glucose Concentration (Starvation) | 0 - 10 mg/L [60] | Maintains metabolic activity above the maintenance threshold while representing severe limitation [60]. |
| pH Oscillations | pH 5.0 pH 3.5 [60] | pH 5.0 is optimal for growth; pH 3.5 imposes a stress that guarantees growth but avoids excessive mortality [60]. |
| Cultivation Temperature | 30°C [40] | Standard optimal temperature for many model microorganisms like S. cerevisiae and C. glutamicum. |
| Imaging Interval | Every 8 min [40] | Balances temporal resolution with computational load and potential phototoxicity during long-term (e.g., 20 h) experiments. |
Experimental Protocols for dMSCC
Chip Fabrication and Assembly
The foundation of a successful dMSCC experiment is a properly designed and fabricated microfluidic chip.
- Design and Master Wafer Fabrication: Using CAD software, design a chip consisting of multiple cultivation structures. Each structure typically contains arrays of monolayer-growth chambers (e.g., 4 µm in height, 90 µm in width) connected by supply channels (e.g., 14 µm in height) [40]. The design must ensure reliable cell trapping, sufficient nutrient supply via diffusion, and long-term cultivation capability. The master wafer is fabricated via photolithography using a photomask or via stereolithography (3D printing) [61].
- PDMS Molding and Bonding: Mix polydimethylsiloxane (PDMS) base and curing agent (typically at a 10:1 ratio), pour over the master wafer, and bake to cure. Peel off the cured PDMS mold and use a biopsy puncher to create inlets and outlets. After cleaning both the PDMS mold and a glass slide, activate their surfaces with oxygen plasma and bond them together irreversibly to form the final sealed chip [40] [61].
Biological Preparation and Cultivation
- Strain and Biosensor Preparation: The microbial strain of interest, such as S. cerevisiae CEN.PK113-7D, can be engineered to express genetically encoded biosensors for intracellular metabolites (e.g., the QUEEN-2m biosensor for ATP) [40] [60]. A pre-culture is grown overnight in a shaking flask with appropriate medium to reach mid-exponential phase.
- Chip Loading and Cultivation: Place the assembled chip in an inverted automated microscope with a controlled environmental chamber (e.g., 30°C). Dilute the pre-culture to an OD600 of ~0.3 and inoculate the chip by gently flowing the cell suspension through the inlets, allowing cells to be trapped in the growth chambers [40] [61].
- Application of Dynamic Perturbations: Using pressure-driven pumps, perfuse the chip with cultivation media. To create dynamic environments, switch between different media reservoirs (e.g., glucose-containing medium and glucose-free medium) according to a predefined flow profile. The switch intervals can be precisely controlled, ranging from every 0.75 minutes to 48 minutes, to simulate various frequencies of environmental oscillation [40] [60].
Live-Cell Imaging and Data Acquisition
- Time-Lapse Microscopy: Acquire images automatically at regular intervals (e.g., every 8 minutes) over the entire cultivation period (e.g., 20 hours). Use phase-contrast microscopy to monitor growth, cell division, and morphology. For biosensor-equipped strains, acquire fluorescence images using appropriate filter sets (e.g., for GFP and uvGFP in the case of QUEEN-2m) [40].
- Semi-Automated Image and Data Analysis: Use image analysis software (e.g., Fiji) to segment cells, track lineages, and quantify fluorescence intensities over time. This data is then processed with data analysis environments (e.g., R) to extract quantitative parameters such as specific growth rates, biosensor signals, and morphological descriptors at the population, subpopulation, and single-cell levels [40].
Quantification of Robustness
A key final step is quantifying the stability of cellular functions using a dedicated robustness metric derived from the Fano factor (variance-to-mean ratio). This formula allows for the comparison of robustness for specific functions (e.g., growth rate, product yield) across different strains, conditions, and time frames. It can measure the stability of a function over time as well as the degree of heterogeneity within a population at a given time point [40] [60]. This quantitative output is critical for objectively ranking the robustness of different microbial cell factories.
The Scientist's Toolkit: Essential Research Reagent Solutions
Table 3: Key Materials and Reagents for dMSCC Experiments
| Item | Function/Description | Example/Reference |
|---|---|---|
| Microfluidic Chip (PDMS-glass) | Biocompatible platform for cell cultivation and observation under flow [61]. | Custom design with monolayer growth chambers (e.g., 4 x 90 x 80 µm) [40]. |
| Pressure-Driven Pump System | Provides precise, pulsation-free flow control for medium perfusion and rapid environment switching [40]. | Fluigent Line-up EZ series; Elveflow OB1 [40] [62]. |
| Inverted Automated Microscope | Enables high-resolution, time-lapse live-cell imaging over long durations. | Nikon Eclipse Ti2 with incubation cage [40]. |
| Genetically Encoded Biosensors | Report real-time dynamics of intracellular metabolites and physiological states. | QUEEN-2m for ATP [40]; FRET-based sensors for glycolytic flux, redox state [60]. |
| Polydimethylsiloxane (PDMS) | Two-component silicone elastomer used for rapid prototyping of microfluidic chips via soft lithography [61]. | Sylgard 184 (Dow) [63] [61]. |
| Defined Cultivation Media | Provides nutrients and defines the environmental conditions for cultivation. | Synthetic defined medium (e.g., Verduyn medium for yeasts) [40]. |
| Image Analysis Software | Segments cells, tracks lineages, and quantifies fluorescence intensities from microscopy data. | Fiji/ImageJ [40]; Custom scripts in R or Python [40]. |
Visualizing Physiological Responses to Dynamic Perturbations
dMSCC experiments reveal how intracellular signaling and metabolism are affected by rapid environmental changes. The diagram below maps this response for a yeast cell experiencing glucose feast-starvation cycles.
Dynamic Microfluidic Single-Cell Cultivation represents a paradigm shift in our ability to probe the resilience of microbial cell factories. By enabling the application of precisely controlled, rapid environmental changes while monitoring physiological responses at the single-cell level, dMSCC moves beyond population-averaged data to uncover the roots of heterogeneity and functional stability. The integration of this technology with genetically encoded biosensors and a mathematical framework for quantifying robustness provides a powerful, high-resolution pipeline for strain characterization. This approach is instrumental in bridging the gap between laboratory-scale performance and industrial-scale viability, ultimately guiding the selection and engineering of more robust microbial cell factories for reliable biomanufacturing.
Robustness, defined as the ability of a microbial cell factory to maintain stable phenotypic performance despite genetic or environmental perturbations, is crucial for predictable and efficient industrial bioprocesses [2]. Unlike tolerance, which primarily describes survival or growth under stress, robustness specifically refers to the stability of key production metrics such as titer, yield, and productivity across variable conditions [6] [2]. The inherent variability of large-scale fermentation processes, including fluctuating nutrient availability, inhibitor accumulation, and physicochemical gradients, often leads to diminished performance in strains optimized under ideal laboratory conditions [40] [16]. Therefore, quantifying robustness provides a critical tool for selecting and engineering superior production strains.
A significant challenge has been the lack of a standardized, dimensionless metric that allows for direct comparison of robustness across different cellular functions and between different strains. Recently, a Fano factor-based quantification method has been developed to meet this need, enabling a high-throughput and systematic approach to robustness assessment [64] [65]. This framework allows researchers to move beyond performance-centric screening and intentionally select for strains with stable, predictable behavior, ultimately de-risking bioprocess scale-up.
Mathematical Framework of Robustness Quantification
The Mean-Normalized Fano Factor
The core of the modern robustness quantification framework is the application of the Fano factor, a statistical measure traditionally defined as the ratio of variance to the mean (σ²/μ) [66]. Originally used to measure dispersion in counting processes, it has been adapted for robustness by normalizing it to the mean performance across all strains and perturbations under investigation [64].
For a specific cellular function i (e.g., growth rate, product yield), strain S, and a defined perturbation space P, robustness (R) is calculated as:
R = 1 - (σ²i,S,P / x̄i,S,P) / mi,P
Where:
- σ²i,S,P is the variance of the function i for strain S across the perturbation space P.
- x̄i,S,P is the mean of the function i for strain S across the perturbation space P.
- mi,P is the mean of the function i across all strains within the perturbation space P [64].
This formulation adheres to four key criteria for an ideal robustness metric:
- Independence from perturbation number: The number of tested perturbations influences statistical significance but not the R-value itself.
- Negative impact of all deviations: Both positive and negative deviations from the mean performance reduce the R-value.
- Intuitive scale: A higher R-value indicates greater robustness, with 0 representing the highest possible robustness.
- Dimensionless property: The metric is dimensionless, allowing for comparison of functions operating at different orders of magnitude [64].
Comparison with Alternative Metrics
The mean-normalized Fano factor was established after evaluating other potential metrics. The two primary alternatives were found to have significant shortcomings.
Table 1: Comparison of Different Robustness Quantification Metrics
| Metric | Formula | Advantages | Disadvantages |
|---|---|---|---|
| Coefficient of Variation (CV) | σ / x̄ | Dimensionless. | Poor accuracy for data with means between 0 and 1; interpretation is complicated when CV >1 [64]. |
| Kitano's Formula | Σ [ ψ(p) * (fi,S(p) / fi,S(0)) ] | Context-specific. | Requires a defined control condition; functions performing better than the control are assigned higher robustness, which can be misleading [64]. |
| Mean-Normalized Fano Factor | 1 - [ (σ² / x̄) / m ] | Dimensionless; frequency-independent; requires no arbitrary control; all deviations reduce robustness [64]. | Robustness values are always relative to the strains and perturbations tested [64]. |
Experimental Protocols for Robustness Quantification
Implementing this quantification framework requires carefully designed experiments to generate the necessary performance data across a defined perturbation space.
Protocol 1: High-Throughput Robustness Screening in Microtiter Plates
This protocol is designed for efficiently screening multiple strains against a suite of environmental perturbations, such as hydrolysates or inhibitor cocktails [64] [65].
- Step 1: Define Perturbation Space. Compose a set of conditions relevant to the industrial process. For lignocellulosic ethanol production, this may include 20-30 different single-inhibitor conditions (e.g., acetic acid, furfural, vanillin) or, more effectively, a range of real lignocellulosic hydrolysates (e.g., from wheat straw, sugarcane bagasse, spruce) to capture compound synergy [64] [65].
- Step 2: Cultivation and Data Collection.
- Strains: Inoculate the strains of interest (e.g., S. cerevisiae CEN.PK, Ethanol Red, PE-2) in pre-culture medium [64].
- Cultivation: Transfer cultures to a 96-well microtiter plate containing the different perturbation media and a control medium. Use a high-throughput cultivation system (e.g., a BioLector) to monitor growth and fluorescence online [65].
- Data Extraction: For each strain and condition, extract key functions:
- Maximum specific growth rate (μmax): Fit growth curve data to an appropriate model.
- Product yields (Yp/s): Measure product (e.g., ethanol) and substrate (e.g., glucose) concentrations at endpoint.
- Cell dry weight (CDW): Correlate with optical density or measure directly [64].
- Step 3: Robustness Calculation. For each strain and function, calculate the mean (x̄) and variance (σ²) across all perturbations. Calculate the global mean (m) for each function across all strains. Apply Trivellin's formula to compute the robustness (R) for each function and strain [64] [65].
Protocol 2: Single-Cell Robustness Analysis Using Dynamic Microfluidic Cultivation (dMSCC)
This protocol assesses robustness in rapidly changing environments and quantifies population heterogeneity, providing resolution unattainable in bulk cultures [40].
- Step 1: Chip Preparation and Inoculation.
- Fabricate or acquire a dynamic microfluidic single-cell cultivation (dMSCC) chip featuring monolayer growth chambers connected to a perfusion system [40].
- Introduce a diluted culture of the sensor-equipped strain (e.g., CEN.PK113-7D with QUEEN-2m ATP biosensor) into the chip at an OD600 of ~0.3 [40].
- Step 2: Apply Dynamic Perturbations and Live-Cell Imaging.
- Use pressure-driven pumps to perfuse the chip with two media: one containing a carbon source (e.g., glucose) and one without (starvation) [40].
- Program a dynamic flow profile to create feast-starvation cycles, oscillating between media at frequencies relevant to large-scale reactors (e.g., every 1.5 to 48 minutes) [40].
- Place the chip in an inverted automated microscope within a temperature-controlled cage (e.g., 30°C). Capture phase-contrast and fluorescent images (e.g., for GFP and uvGFP channels) at regular intervals (e.g., every 8 minutes) over a 20-hour period [40].
- Step 3: Image and Data Analysis.
- Use a semi-automated pipeline in Fiji (ImageJ) and R to track individual cells over time, extracting parameters like:
- Specific growth rate from cell area increase.
- Intracellular metabolite levels (e.g., ATP) from biosensor fluorescence ratios [40].
- Calculate robustness in two ways:
- Temporal Stability: For a single cell or the population mean, calculate R for a function (e.g., ATP level) over the time series.
- Population Heterogeneity: For a single time point, calculate R for a function (e.g., ATP level) across all individual cells in the population. A lower R indicates higher heterogeneity [40] [65].
- Use a semi-automated pipeline in Fiji (ImageJ) and R to track individual cells over time, extracting parameters like:
Figure 1: Experimental Workflow for Robustness Quantification. Researchers can choose a high-throughput bulk screening approach or a dynamic single-cell analysis depending on their research question. Both paths converge on the calculation of the robustness metric using the Fano factor.
The Scientist's Toolkit: Key Reagents and Strains
Successful implementation of robustness quantification relies on specific biological and technical tools.
Table 2: Essential Research Reagent Solutions for Robustness Studies
| Category | Item | Function / Example | Application Notes |
|---|---|---|---|
| Model Strains | S. cerevisiae CEN.PK113-7D | Laboratory reference strain [64]. | Serves as a baseline for comparing industrial strains. |
| S. cerevisiae Ethanol Red | Robust industrial bioethanol producer [64]. | Often exhibits higher growth rate and yield robustness [64] [65]. | |
| S. cerevisiae PE-2 | Industrial strain from sugarcane bioethanol [64]. | Can show performance-robustness trade-offs [64]. | |
| Biosensor Kits | ScEnSor Kit [65] | Fluorescent biosensors for 8+ intracellular parameters (ATP, pH, oxidative stress, UPR, etc.). | Enables monitoring of physiological state and population heterogeneity; requires genomic integration [65]. |
| Perturbation Media | Lignocellulosic Hydrolysates | Complex substrates from wheat straw, spruce, etc. [65]. | Provide realistic, multi-stress perturbations; composition varies by source. |
| Single-Inhibitor Cocktails | Defined media with acids, aldehydes, phenolics [64]. | Allows mechanistic study of specific inhibitor effects. | |
| Cultivation Systems | 96-well Microtiter Plates with Online Monitoring | Enables high-throughput, parallel cultivation [64]. | Ideal for screening large perturbation spaces. |
| Dynamic Microfluidic Single-Cell Cultivation (dMSCC) Chip | Creates precisely controlled, rapid environmental changes [40]. | Essential for studying temporal stability and population heterogeneity. |
Data Interpretation and Application in Strain Selection
The primary output of this framework is a quantitative robustness score (R) for each strain-function pair. Interpreting these scores reveals critical biological insights and guides strain selection.
- Identifying Robust Strains and Functions: A strain with a high R-value for a specific function (e.g., specific growth rate) maintains that function consistently across the tested perturbations. For example, Ethanol Red has been shown to possess significantly higher robustness for growth rate and ethanol yield compared to CEN.PK and PE-2 in lignocellulosic perturbation spaces [64] [65].
- Uncovering Trade-offs: Robustness is function-specific, and a strain rarely excels at all functions. The framework systematically identifies performance-robustness trade-offs. For instance, PE-2 may achieve a high mean ethanol yield but with low robustness, while Ethanol Red might trade peak yield for higher stability [64]. Similarly, dynamic single-cell studies show that conditions promoting high average metabolite levels (performance) can coincide with high temporal instability and population heterogeneity (low robustness) [40].
- Informing Engineering Strategies: Quantification pinpoints which cellular functions are fragile in a given chassis, directing engineering efforts. A strain with robust growth but fragile product yield is a prime candidate for pathway engineering to stabilize expression [64] [16]. Furthermore, quantifying population heterogeneity helps target mechanisms to reduce phenotypic divergence in production populations [40] [65].
Figure 2: Integrating Robustness Quantification with Strain Engineering. The quantification framework provides data-driven insights that directly inform the choice of engineering strategies to ultimately construct more robust microbial cell factories.
The transition to a sustainable bio-based economy relies heavily on the efficient conversion of lignocellulosic biomass into biofuels and biochemicals. Microbial cell factories, particularly the yeast Saccharomyces cerevisiae, serve as cornerstone biological agents in this process, catalyzing the fermentation of sugars to valuable products [67]. However, the pretreatment of lignocellulosic biomass unavoidably generates a complex mixture of inhibitory compounds—including furanaldehydes, weak acids, and phenolics—that severely impair yeast growth and metabolic performance [68] [69]. This inhibition represents a major bottleneck for the industrial viability of second-generation biorefineries.
Understanding and enhancing microbial robustness—the ability to maintain performance under these inhibitory conditions—is a central objective in industrial biotechnology research. This case study provides a detailed phenotypic comparison of evolved and engineered S. cerevisiae strains, highlighting their differential tolerance mechanisms when exposed to lignocellulosic hydrolysates. We present standardized protocols for assessing strain performance, quantitative data analysis, and molecular insights that collectively inform the rational design of more robust microbial cell factories.
Key Inhibitory Compounds in Lignocellulosic Hydrolysates
The table below summarizes the major classes of inhibitors, their formation pathways, and primary mechanisms of toxicity to S. cerevisiae.
Table 1: Major Inhibitory Compounds in Lignocellulosic Hydrolysates
| Inhibitor Class | Representative Compounds | Formation Pathway | Toxic Mechanisms |
|---|---|---|---|
| Furanaldehydes | Furfural, 5-Hydroxymethylfurfural (HMF) | Acid-catalyzed dehydration of pentoses (furfural) and hexoses (HMF) [68] | DNA damage [70], inhibition of dehydrogenases [70], disruption of mitochondria [70], induction of oxidative stress [71] |
| Carboxylic Acids | Acetic acid, Formic acid | Dehydration of sugar degradation products or lignin side-chain cleavage [68] | Cytoplasmic acidification [72], disruption of proton motive force (uncoupler) [70], depletion of ATP [70] |
| Phenolic Compounds | Vanillin, Syringaldehyde, 4-Hydroxybenzoic acid | Degradation of lignin [70] [69] | Membrane fluidity disruption [70], induction of reactive oxygen species (ROS) [70] |
Comparative Phenotypic Analysis of S. cerevisiae Strains
Strain Selection and Origins
Research has characterized a diverse set of S. cerevisiae strains with varying origins and tolerance mechanisms, providing a basis for comparative analysis.
Table 2: S. cerevisiae Strains with Enhanced Tolerance to Lignocellulosic Inhibitors
| Strain Name | Origin / Engineering Strategy | Key Documented Phenotype / Mechanism |
|---|---|---|
| GHP1 & GHP4 | Evolved from an industrial strain via directed evolution and adaptation in pretreated pine [70] | Improved fermentative capability on pretreated pine; GHP4 performance is consistent, while GHP1 is pre-culturing dependent; Enhanced mitochondrial integrity and cellular integrity [70] |
| RDS1 Overexpression Strain | Rational engineering: overexpression of aldehyde reductase RDS1 [71] | Shorter lag phase (12h vs 26h in parent) under 35 mM furfural challenge; NADH-dependent furfural reduction; Enhanced ROS resistance [71] |
| Evolved F12 Strain | Adaptive Laboratory Evolution (ALE) in the presence of inhibitors and insoluble solids [69] | ~5x increase in ethanol yield with inhibitors and 10% (w/v) solids; Enhanced xylose consumption; Upregulation of cell wall integrity genes (SRL1, CWP2) [69] |
| Industrial & Wild Strains (KE6-12, Ethanol Red, LBCM isolates) | Natural isolates from specific industrial environments or collections [73] | Distinct transcriptional stress responses under anaerobic fermentation in wheat straw hydrolysate; Strain-specific upregulation of sugar transporters, iron metabolism, or lipid biosynthesis genes [73] |
Quantitative Fermentation Performance
The performance of robust strains has been quantitatively assessed under inhibitory conditions. The following table summarizes key metrics from published studies.
Table 3: Comparative Fermentation Performance of S. cerevisiae Strains Under Inhibitory Conditions
| Strain | Fermentation Conditions | Key Performance Metrics | Reference |
|---|---|---|---|
| GHP1 | Simultaneous Saccharification and Fermentation (SSF) of pretreated pine (17.5% dw/v) | Performance dependent on pre-culturing with inhibitors; Improved ethanol titer vs. parent | [70] |
| GHP4 | SSF of pretreated pine (17.5% dw/v) | Consistent performance independent of pre-culturing; Improved ethanol titer vs. parent | [70] |
| RDS1 Overexpression | Synthetic medium with 35 mM furfural | Lag phase reduced to ~12 hours vs. 26 hours for parental strain | [71] |
| Evolved F12 | Synthetic medium with 100% inhibitor mix and 10% (w/v) Water Insoluble Solids (WIS) | ~5x increase in ethanol yield compared to parental F12 strain | [69] |
| S. cerevisiae PE-2 | Medium with furfural | Maximum specific growth rate (μmax) reduced to 35% of the control | [72] |
Experimental Protocols for Phenotypic Characterization
Protocol 1: Adaptive Laboratory Evolution (ALE) for Enhanced Robustness
This protocol is adapted from the ALE procedure used to generate the evolved F12 strain with improved tolerance to both inhibitors and insoluble solids [69].
Application: To generate novel yeast strains with enhanced robustness for high-gravity lignocellulosic conversion processes.
Materials:
- Basal Medium: Yeast Nitrogen Base (YNB) supplemented with 7.5 g/L (NH₄)₂SO₄ [69].
- Carbon Sources: Glucose and xylose.
- Selection Pressures:
- Inhibitor Mix: Furfural (2.1 g/L), 5-HMF (0.3 g/L), acetic acid (13.4 g/L), formic acid (10.5 g/L), ferulic acid (0.4 g/L), syringaldehyde (0.2 g/L), vanillin (0.1 gyl/L) [69].
- Insoluble Solids: 4-mm diameter glass beads or water-insoluble solids (WIS) from pretreated lignocellulose (e.g., steam-exploded wheat straw) [69].
- Equipment: Erlenmeyer flasks, orbital shaker, spectrophotometer, centrifuge.
Procedure:
- Inoculation: Inoculate S. cerevisiae F12 (or another starting strain) into 50 mL of basal medium containing 10 g/L glucose and 10 g/L xylose at an initial OD₆₀₀ of 0.1.
- Evolution Conditions: Incubate flasks at 32°C, 150 rpm, and pH 5.0.
- Sequential Transfers: Monitor growth (OD₆₀₀). When the culture reaches the mid-exponential phase, harvest cells and reinoculate into fresh medium at OD₆₀₀ = 0.1.
- Progressive Stress Application: Gradually increase the selection pressure over successive rounds:
- Stage 1: 20% (w/w) glass beads + 12.5% (v/v) inhibitor mix.
- Stage 2: Increase the xylose-to-glucose ratio (e.g., to 15:5) and the inhibitor mix concentration (e.g., to 25% v/v).
- Stage 3+: Continue increasing inhibitor concentration (up to 80% v/v) and the proportion of xylose (e.g., to 18:2 xylose:glucose) to evolve co-tolerance and xylose utilization under stress [69].
- Isolation: After approximately 2,200 generations, plate the culture on solid YPXD-agar to isolate single colonies. Select promising clones for further characterization [69].
Protocol 2: Simultaneous Saccharification and Fermentation (SSF) Assay
This protocol outlines the standard method for evaluating strain performance under industrially relevant conditions, as used to characterize the GHP strains [70].
Application: To assess the fermentative capability of yeast strains on real or simulated pretreated lignocellulosic biomass.
Materials:
- Biomass: SO₂-steam explosion pretreated Loblolly pine wood chips or other pretreated biomass [70].
- Enzymes: Cellulase (e.g., 15 FPU/g dry biomass), cellobiase (e.g., 60 CBU/g dry biomass) [70].
- Fermentation Medium: Tryptone soy broth (TSB) or other nutrient-supplemented medium.
- Equipment: Baffled flasks, water bath shaker, GC system for ethanol analysis, HPLC for inhibitor/sugar analysis.
Procedure:
- Biomass Preparation: Weigh a mass of pretreated biomass equivalent to a high solids loading (e.g., 17.5% dry weight/volume) into a baffled flask and sterilize by autoclaving [70].
- Enzyme and Medium Addition: Prior to inoculation, add filter-sterilized enzymes and nutrients to the biomass. Adjust the final volume with sterile water and maintain a 1x concentration of TSB [70].
- Inoculation: Inoculate using cells from a 24-hour pre-culture. Centrifuge, wash, and inoculate at an industrially relevant cell density (e.g., 2 × 10⁷ cells/mL or ~2 g dw/L) [70].
- Fermentation: Maintain conditions at 37°C, pH 5.0, with constant agitation (e.g., 200 rpm) for the duration of the run (e.g., 96-144 hours) [70].
- Sampling and Analysis: Collect samples at regular intervals. Centrifuge to separate solids and analyze the supernatant for:
Molecular Mechanisms of Tolerance: Insights from Transcriptomics
Comparative transcriptomic studies have been pivotal in unraveling the complex molecular responses of robust yeast strains.
Figure 1: Integrated Transcriptional Response to Lignocellulosic Inhibitors. Stresses like furfural and acids trigger signaling pathways that rewire gene expression. Robust strains show coordinated activation of detoxification, structural reinforcement, and metabolic reprogramming, leading to improved growth and fermentation [70] [73] [69].
Key transcriptomic findings include:
- Cell Wall Integrity: The evolved F12 strain showed upregulation of genes SRL1, CWP2, WSC2, and WSC4, which are crucial for maintaining cell wall structure under combined stress from inhibitors and solids [69].
- Divergent Evolutionary Adaptations: Different wild isolates (LBCM31 vs. LBCM109) exhibited distinct expression profiles; LBCM31 showed high expression of sugar transporters, while LBCM109 upregulated genes for iron metabolism and synthesis of sphingolipids, phospholipids, and ergosterol [73].
- Metabolic Reallocation: Robust strains often show repression of genes related to iron transport and homeostasis (e.g., FTR1, ARN1, FRE1), potentially limiting iron-mediated oxidative damage or conserving resources [69].
The Scientist's Toolkit: Essential Research Reagents and Materials
Table 4: Key Reagents and Materials for Strain Robustness Research
| Reagent / Material | Function / Application | Example Use Case |
|---|---|---|
| Defined Inhibitor Mix (Furfural, HMF, Acetic Acid, Phenolics) [70] [69] | Standardized, reproducible challenge for phenotypic screens and ALE; allows dissection of synergistic effects. | Used in ALE of strain F12 and to test tolerance of GHP strains [70] [69]. |
| Water Insoluble Solids (WIS) from Pretreated Biomass | Mimics the physical stress and unknown adsorbent effects present in real SSF processes. | Evaluating the effect of solids on inhibitor tolerance in evolved F12 [69]. |
| Yeast Nitrogen Base (YNB) | Defined minimal medium for ALE and controlled physiological studies. | Basal medium in ALE experiments to avoid masking effects of complex nutrients [69]. |
| Cellulase & Cellobiase Enzymes | Hydrolyze cellulose in pretreated biomass to fermentable sugars during SSF assays. | Essential for SSF experiments with high solids loading, e.g., with pretreated pine [70]. |
| RNA Sequencing Kits | Genome-wide transcriptional profiling to identify tolerance mechanisms and gene targets. | Used to compare stress responses across lab, industrial, and wild strains [73]. |
This comparative analysis demonstrates that multiple evolutionary and engineering paths can lead to improved robustness in S. cerevisiae. Whether through ALE, rational overexpression of key genes like RDS1, or the selection of inherently robust natural isolates, the resulting tolerant strains often share common phenotypic traits, such as shorter lag phases and improved fermentation under inhibition. The molecular underpinnings of these phenotypes, however, can be highly strain-dependent, involving diverse transcriptional reprogramming. The protocols and data presented here provide a framework for systematically characterizing and engineering robust yeast strains, thereby accelerating the development of efficient microbial cell factories for the sustainable bioprocessing of lignocellulosic feedstocks.
In the development of advanced microbial cell factories (MCFs), a critical challenge lies in bridging the gap between high performance in laboratory conditions and stable, productive output in industrial bioprocesses. Microbial robustness—defined as the ability of a strain to maintain a stable phenotype (e.g., yield, titer, productivity) despite multiple genetic, metabolic, or environmental perturbations—is a key determinant for successful scale-up [2] [1]. This Application Note delineates robust experimental and computational protocols for the systematic quantification of robustness and for analyzing its inherent trade-offs with production metrics, thereby providing a structured framework for strain selection and engineering.
Defining Robustness and Performance in MCFs
Robustness vs. Tolerance
A fundamental prerequisite for this analysis is distinguishing robustness from the related concept of tolerance, as these terms are often erroneously used interchangeably.
- Robustness: A systems-level property reflecting the stability of a specific phenotypic function (e.g., product yield, specific growth rate) in the face of multiple, often simultaneous, perturbations. It is measured by the consistency of a desired output [2] [1].
- Tolerance: A cell-survival or growth-centric property, typically described in response to a single perturbation (e.g., alcohol tolerance, acid tolerance). A highly tolerant strain is not guaranteed to be a robust producer [1].
Key Performance and Robustness Metrics
The evaluation of strains requires a multi-faceted approach, capturing both output intensity and stability. Core metrics are summarized in Table 1.
Table 1: Key Metrics for Evaluating Strain Performance and Robustness
| Category | Metric | Definition | Relevance |
|---|---|---|---|
| Production Performance | Titer | Final concentration of the target product (g/L) | Economic feasibility |
| Productivity | Rate of product formation (g/L/h) | Process efficiency & capital cost | |
| Yield | Amount of product per substrate consumed (g/g) | Resource utilization & operational cost | |
| Robustness Quantification | Robustness Index (R) | Stability of a function across a perturbation space [65] | Predictability & scale-up potential |
| Population Heterogeneity | Variance of a parameter within an isogenic population [65] [40] | Process stability & culture consistency |
Quantitative Framework for Robustness Quantification
A cornerstone of modern robustness research is the application of a dimensionless, quantitative metric derived from the Fano factor, often referred to as Trivellin's robustness equation [65]. This formula allows for the direct comparison of function stability across different strains, conditions, and timeframes.
The robustness ( R ) of a specific function ( f ) (e.g., specific growth rate) in a system ( s ) (e.g., a yeast strain) across a set of perturbations ( P ) (e.g., different hydrolysates) is calculated as:
[ R{f,s} = \frac{1}{\text{Fano Factor}} = \frac{\muf}{\sigma_f^2} ]
Where:
- ( \mu_f ) is the mean value of the function ( f ) across all perturbations.
- ( \sigma_f^2 ) is the variance of the function ( f ) across all perturbations.
A higher ( R ) value indicates greater stability (lower variance) relative to the mean performance, signifying higher robustness [65].
Experimental Platforms for Robustness Profiling
Robustness can be profiled across multiple scales and resolutions, from population-level averages to single-cell dynamics.
Population-Level Screening in Microtiter Plates
Application: High-throughput initial characterization of multiple strains across a matrix of environmental perturbations [65].
- Perturbation Space: Utilizes a set of diverse, complex substrates like lignocellulosic hydrolysates (e.g., from wheat straw, sugarcane bagasse, spruce), which inherently present a combination of inhibitory compounds, osmotic stress, and product inhibition [65].
- Workflow: Strains are cultivated in parallel in a microtiter plate containing different hydrolysates and a control medium. Growth (OD600) and product concentration are monitored. The specific growth rate, product yield, and productivity are calculated for each strain in each condition.
- Robustness Analysis: The robustness index ( R ) is computed for each function (e.g., ( R{\text{growth}} ), ( R{\text{yield}} )) for each strain across the hydrolysate perturbation space [65].
Single-Cell Analysis Using Dynamic Microfluidic Cultivation (dMSCC)
Application: Investigating robustness and population heterogeneity in response to rapid, dynamic perturbations mimicking large-scale bioreactor gradients [40].
- Perturbation: Feast-starvation cycles are applied by rapidly switching the medium flow between glucose-containing and glucose-free solutions, with oscillation intervals ranging from minutes to hours [40].
- Monitoring: Single cells are trapped in monolayer growth chambers and tracked via live-cell imaging over time. Functions like growth rate and intracellular parameters (e.g., ATP levels) are quantified using fluorescent biosensors like QUEEN-2m [40].
- Robustness Analysis:
- Temporal Stability: Robustness ( R ) is calculated for a function over time within the same cell or population.
- Population Heterogeneity: The robustness index is applied to the distribution of a parameter (e.g., instantaneous ATP level) across the population at a single time point, where a lower ( R ) indicates higher heterogeneity [40].
Diagram 1: Workflow for single-cell robustness analysis using dynamic microfluidic cultivation (dMSCC).
Protocols for Robustness Evaluation
Protocol 1: Quantifying Growth and Production Robustness Across Hydrolysates
Objective: To rank the robustness of yeast strains for growth and ethanol production in diverse lignocellulosic hydrolysates [65].
Materials:
- Strains: S. cerevisiae CEN.PK113-7D, Ethanol Red, PE-2.
- Media: Synthetic defined (control) medium and a set of ≥7 different lignocellulosic hydrolysates (e.g., from wheat straw, sugarcane bagasse, corn stover, birch, spruce) [65].
- Equipment: 96-well microtiter plates, plate reader with shaking and incubation.
Procedure:
- Pre-culture: Grow all strains in synthetic medium to mid-exponential phase.
- Inoculation: Transfer a standardized inoculum into each well containing the different hydrolysates and control medium. Use a minimum of three biological replicates.
- Cultivation & Monitoring: Incubate in the plate reader at 30°C with continuous shaking. Monitor optical density (OD600) every 15-30 minutes to track growth.
- Product Analysis: At the end of fermentation, analyze ethanol concentration in each well using HPLC or GC.
- Data Analysis: a. For each strain in each condition, calculate the specific growth rate (μ), ethanol yield (Yp/s), and volumetric productivity (Qp). b. For each strain, assemble the values for each function (μ, Yp/s, Qp) across all hydrolysate conditions. c. Apply Trivellin's equation to calculate the robustness index ( R ) for each function for each strain.
- Interpretation: Strains with higher ( R ) values for key functions are considered more robust. This data can reveal performance-robustness trade-offs.
Protocol 2: Profiling Temporal and Population Robustness with dMSCC
Objective: To assess the stability of intracellular ATP levels in a yeast strain subjected to dynamic feast-starvation cycles [40].
Materials:
- Strain: S. cerevisiae CEN.PK113-7D expressing the ratiometric ATP biosensor QUEEN-2m.
- Media: Synthetic defined medium with (feast) and without (starvation) glucose.
- Equipment: Dynamic microfluidic single-cell cultivation (dMSCC) system, inverted automated microscope with environmental chamber, fluorescence imaging capabilities (GFP and uvGFP filters) [40].
Procedure:
- Chip Preparation & Inoculation: Fabricate or obtain a dMSCC chip. Inoculate the chip with yeast cells at an OD600 of ~0.3.
- Dynamic Cultivation: Initiate perfusion with a dynamic flow profile, switching between feast and starvation media at defined intervals (e.g., 1.5, 6, 12, 24, 48 minutes).
- Live-Cell Imaging: Capture phase-contrast and fluorescent images (both GFP and uvGFP channels) every 8 minutes for a minimum of 20 hours.
- Image & Data Analysis: a. Use Fiji/ImageJ and R scripts for semi-automated cell segmentation, tracking, and fluorescence intensity quantification. b. Calculate the ratiometric ATP signal for each cell at each time point. c. For each tracked cell, determine the mean intracellular ATP level over time and its variance.
- Robustness Calculation: a. Temporal Robustness: Calculate ( R{\text{ATP}} ) for individual cells or the population mean over the cultivation time. b. Population Heterogeneity: Calculate ( R{\text{ATP}} ) from the distribution of mean ATP levels across the entire population at a specific time point. A lower ( R ) indicates higher heterogeneity.
- Interpretation: Identify how oscillation frequency affects both the average ATP level and its stability, providing insights into metabolic robustness.
Correlating Robustness with Production: Identifying Trade-offs
A primary goal of robustness research is to understand its relationship with production performance. Computational and experimental studies consistently reveal a fundamental trade-off between high yield/productivity and robustness.
Table 2: Performance-Robustness Trade-offs in Microbial Strains
| Strain Type | Production Phenotype | Robustness Profile | Key Engineering Insight |
|---|---|---|---|
| High-Growth, Low-Synthesis | Low Yield, Low Productivity | Moderate to High Growth Robustness | Maximizes growth rate but consumes substrate for biomass [74]. |
| Low-Growth, High-Synthesis | High Yield, Low Productivity | High Synthesis Robustness | Achieves high yield but from a small population, limiting productivity [74]. |
| Balanced Growth-Synthesis | Medium Yield, Max. Productivity | Balanced Robustness | Requires optimal sacrifice in growth rate to maximize volumetric productivity [74]. |
| Two-Stage Production Circuit | High Yield & High Productivity | Programmed Robustness | Escapes the trade-off by separating growth and production phases [74]. |
Computational "host-aware" modeling demonstrates that while strains can be engineered for high yield (low-growth, high-synthesis) or high productivity (medium-growth, medium-synthesis), all fall on a Pareto front, confirming an inescapable trade-off under static conditions [74]. This is visualized in Diagram 2.
Diagram 2: The fundamental growth-synthesis trade-off in one-stage bioprocesses and the strategy to overcome it using two-stage processes with genetic circuits.
Engineering Strategies to Enhance Robustness
To mitigate the performance-robustness trade-off, several engineering strategies can be employed, focusing on system-level regulation rather than single-gene modifications.
- Transcription Factor (TF) Engineering: Modifying global transcription factors (e.g., gTME) can reprogram cellular networks to enhance multi-stress robustness. For example, engineering the sigma factor δ70 in E. coli or Spt15 in S. cerevisiae has improved tolerance to ethanol and other inhibitors, thereby stabilizing production of compounds like lycopene [1].
- Membrane and Transporter Engineering: Reinforcing the cell membrane, a primary barrier against environmental stress, enhances robustness. This can be achieved by modulating the ratio of unsaturated to saturated fatty acids through the overexpression of enzymes like Δ9 desaturase (Ole1) or cis-trans isomerase (Cti) [1].
- Two-Stage Fermentation with Genetic Circuits: This strategy decouples growth and production. A genetic circuit is designed to keep cells in a high-growth, low-synthesis state initially. Upon induction (e.g., at a critical population density or after a set time), the circuit triggers a switch to a high-synthesis state, often by inhibiting core host metabolism to redirect resources [74]. This approach can achieve both high titers and high productivity, effectively breaking the classical trade-off.
The Scientist's Toolkit: Essential Reagents and Platforms
Table 3: Key Research Reagent Solutions for Robustness Studies
| Tool / Reagent | Function / Application | Example |
|---|---|---|
| Fluorescent Biosensor Kits | Real-time, single-cell monitoring of intracellular parameters. | ScEnSor Kit: Enables tracking of 8+ parameters (pH, ATP, oxidative stress, UPR, etc.) in S. cerevisiae [65]. |
| Lignocellulosic Hydrolysates | Complex perturbation space for stability screening. | Hydrolysates from wheat straw, sugarcane bagasse, spruce, etc., providing a mix of inhibitors and osmotic stressors [65]. |
| Microfluidic Cultivation Systems | High-resolution analysis of single cells in dynamic environments. | dMSCC Systems: Allow for perfusion-based cultivation with rapid medium switching and single-cell tracking [40]. |
| "Host-Aware" Modeling Software | Computational prediction of resource competition and strain performance. | Kinetic models integrating gene expression, metabolism, and resource allocation to simulate growth-synthesis trade-offs [74]. |
In the pursuit of designing robust microbial cell factories (MCFs), metabolic heterogeneity presents both a significant challenge and a potential engineering target. Cellular populations within industrial bioprocesses are not uniform; instead, they consist of individuals exhibiting divergent metabolic states and capabilities. This heterogeneity arises from stochastic gene expression, uneven nutrient distribution, and cellular aging, ultimately leading to suboptimal bioreactor performance and reduced product yields [75]. Emerging single-cell technologies now provide an unprecedented view into this cellular diversity, revealing that pre-existing metabolomic heterogeneity can determine divergent cellular fates under stress conditions [76]. Understanding and managing this heterogeneity is crucial for advancing MCF robustness, as it enables strategies that account for population-level dynamics rather than idealized average cell behavior. This Application Note integrates cutting-edge analytical frameworks with practical engineering protocols to characterize and leverage metabolic heterogeneity for improved biomanufacturing outcomes.
Advanced Analytical Frameworks for Assessing Metabolic Heterogeneity
Single-Cell Technologies for Metabolic Profiling
The comprehensive assessment of metabolic heterogeneity requires analytical platforms capable of measuring biochemical activities at the single-cell level. Several advanced technologies have emerged to address this need:
Single-Cell Live Imaging Mass Spectrometry (SCLIMS) represents a cross-modality approach that integrates live-cell imaging with mass spectrometry. This technique enables researchers to simultaneously capture metabolomic features and phenotypic characteristics of individual cells, establishing direct links between metabolic status and cellular function. In practice, SCLIMS involves incubating cells with fluorescent probes (e.g., DCFDA for oxidative stress), followed by microscopic imaging and single-cell sampling via patch-clamp micropipettes for subsequent mass spectrometric analysis. This methodology has demonstrated that approximately 61.4% of metabolites show significant inverse correlation with cellular oxidative stress levels, highlighting the profound metabolic reprogramming that occurs in response to environmental challenges [76].
Ultra-Low Flow Rate Desorption Electrospray Ionization Mass Spectrometry Imaging (u-DESI-MSI) provides subcellular spatial resolution for molecular mapping while preserving cells in their native states. This ambient ionization technique operates without vacuum requirements or extensive sample preparation, maintaining the integrity of delicate biomolecules. The platform utilizes a precisely controlled solvent delivery system at 150 nL/min coupled with optimized interface geometry, achieving rastering step sizes as fine as 5 μm. This resolution enables visualization of both intercellular and intracellular molecular heterogeneity, revealing distinct lipid distribution patterns in subcellular regions of human pancreatic cells [77].
Single-Cell Transcriptomic Analysis extends metabolic assessment to the gene regulatory level, connecting transcriptional heterogeneity with metabolic pathway utilization. In papillary thyroid carcinoma, for example, this approach has revealed 15 distinct malignant subgroups with variations in ferroptosis activity, metabolic pathways, and cell-cell communication networks. Specific subgroups demonstrated unique correlation patterns between ferroptosis and metabolic pathways, including positive correlations with the pentose phosphate pathway and negative correlations with glycolysis [78].
Table 1: Comparison of Single-Cell Analysis Platforms for Metabolic Heterogeneity Assessment
| Technology Platform | Spatial Resolution | Molecular Coverage | Key Applications | Technical Considerations |
|---|---|---|---|---|
| SCLIMS [76] | Single-cell | 83 confirmed metabolites (500+ ion signals) | Linking metabolome with oxidative stress/senescence | Requires fluorescent labeling; combines patch-clamp sampling with MS |
| u-DESI-MSI [77] | 5 μm (subcellular) | Lipids, metabolites | Native state biomolecule mapping; subcellular heterogeneity | Ambient ionization; minimal sample preparation; ultra-low flow rates |
| Single-Cell RNAseq [78] | Single-cell | Transcriptome-wide | Metabolic pathway activity inference; cell subpopulation identification | Indirect metabolic assessment via gene expression; requires computational inference |
Computational Modeling of Population Heterogeneity
Beyond analytical measurements, computational frameworks provide powerful tools for understanding and predicting heterogeneous metabolic behaviors:
Mechanistic Metabolic Models integrated with artificial intelligence offer white-box modeling approaches for strain design. These models incorporate cell-level dynamics including metabolism, resource competition, and gene expression with population-level behavior in batch cultures. The deep integration of AI with metabolic models enables the identification of optimal engineering strategies that account for heterogeneous population responses [79].
Growth Optimization Models incorporating heterogeneity explain counterintuitive metabolic phenomena such as overflow metabolism (the Warburg effect). These models demonstrate that the combination of optimal protein allocation with heterogeneity in enzyme catalytic rates among cells quantitatively explains why and how cells choose between respiration and fermentation under different nutrient conditions. This framework reveals that metabolic heterogeneity is not merely noise but can represent a bet-hedging strategy that enhances population fitness in fluctuating environments [75].
Constraint-Based Metabolic Modeling of host-microbiome systems extends heterogeneity analysis to complex multi-species communities. This approach has revealed how inflammation-associated metabolic changes manifest concurrently across data layers involving NAD, amino acid, one-carbon, and phospholipid metabolism. Such models can predict dietary interventions that remodel microbial communities to restore metabolic homeostasis [80].
Experimental Protocols for Characterizing Metabolic Heterogeneity
Protocol: Integrated Single-Cell Metabolomics and Phenotypic Profiling
This protocol details the implementation of SCLIMS for correlating single-cell metabolomes with oxidative stress levels, adapted from established methodologies [76].
Materials and Reagents
- Cell Culture: HEK293T cells (or desired microbial cell factory strain)
- Oxidative Stress Inducer: H₂O₂ prepared in culture medium at 80 μM working concentration
- Fluorescent Probe: Dichlorodihydrofluorescein diacetate (DCFDA) prepared as 20 mM stock in DMSO
- Sampling Equipment: Patch-clamp micropipettes (1-2 μm diameter)
- Mass Spectrometry: High-resolution mass spectrometer with nanoESI source
- Imaging System: Inverted fluorescence microscope with environmental control
Procedure
Oxidative Stress Induction:
- Culture cells to 70-80% confluency in appropriate medium.
- Treat with 80 μM H₂O₂ in culture medium for 1 hour.
- Replace with fresh medium and allow 48-hour recovery before analysis.
Fluorescent Labeling:
- Incubate cells with 10 μM DCFDA in buffer for 25 minutes at 37°C.
- Rinse gently with PBS to remove excess probe.
Live-Cell Imaging:
- Acquire fluorescence images using standard FITC filter set.
- Quantify fluorescence intensity using ImageJ or similar software.
- Maintain cells at constant temperature (37°C) and CO₂ (5%) throughout imaging.
Single-Cell Sampling:
- Using patch-clamp micropipettes, carefully aspirate contents of individual cells.
- Note the correspondence between sampled cells and their fluorescence intensities.
Mass Spectrometric Analysis:
- Directly inject cell contents into nanoESI-mass spectrometer.
- Operate in positive ion mode with m/z range 67-1000.
- Employ data-dependent MS/MS acquisition for metabolite identification.
Data Integration:
- Pair metabolomic data with corresponding fluorescence intensities for each cell.
- Perform correlation analysis (Pearson's r) between metabolite abundances and oxidative levels.
Data Analysis and Interpretation
Process raw MS data using software such as XCMS for feature detection and alignment. Annotate metabolites by matching m/z values to databases (e.g., HMDB) with MS/MS confirmation. Statistically evaluate correlations between metabolite abundances and phenotypic measurements, with false discovery rate correction for multiple comparisons. Generate heatmaps visualizing coordinated changes in metabolite abundance relative to phenotypic gradients.
Protocol: Subcellular Spatial Metabolomics with u-DESI-MSI
This protocol enables high-resolution spatial mapping of metabolites within individual microbial cells [77].
Materials and Specialized Equipment
- Substrate: Indium tin oxide (ITO)-coated glass slides
- Solvent System: 96% methanol, 4% water, 0.1% formic acid
- Mass Spectrometer: High-resolution instrument with cyclic ion mobility capability
- DESI Source: Commercial DESI-XS ion source with emitter cartridge (30 μm inner diameter)
- Solvent Delivery: NanoAcquity UPLC system for precise low-flow delivery
Procedure
Sample Preparation:
- Grow microbial cells to mid-log phase.
- Trypsinize (if adherent) and seed onto ethanol-washed ITO slides at 5×10³ cells/mL.
- Incubate for 1-3 days until cells adhere properly.
- Remove media and wash three times with PBS followed by 150 mM ammonium acetate.
- Dry slides under vacuum and record bright-field images for registration.
u-DESI-MSI System Optimization:
- Set solvent flow rate to 150 nL/min (resulting in ~5500 psi back pressure).
- Allow 25 minutes for signal stabilization at ultra-low flow rate.
- Configure geometric parameters:
- Incidence angle: 75° relative to surface plane
- Sprayer-to-inlet capillary distance: 5 mm
- Sprayer-to-surface distance: 0.5 mm
- Inlet capillary-to-surface distance: 0.5 mm
- Set inlet capillary temperature to 120°C.
Data Acquisition:
- Set rastering step size to 5-10 μm for single-cell resolution.
- Acquire data in positive ion mode across m/z 50-1200.
- For lipid identification, perform MS/MS with transfer collision energy of 30-45 V.
Data Processing:
- Process MS images using HDI 1.6 software with 0.02 Da m/z window.
- Generate averaged m/z lists containing 4000 most abundant features.
- Export region-of-interest data for further statistical analysis.
Experimental Design Considerations
Include biological replicates (n≥3) and quality control samples. For microbial studies, compare different growth phases or stress conditions. Validate lipid identifications through complementary LC-MS/MS analysis of lipid extracts.
Engineering Strategies for Managing Metabolic Heterogeneity
Dynamic Metabolic Control in Bioprocessing
Advanced bioprocessing strategies address the inherent competition between cellular growth and product synthesis by implementing dynamic control systems:
Two-Phase Dynamic Control decouples growth and production phases, programming cells to first achieve high density before switching to production mode. Research has demonstrated that the most effective genetic circuits for this purpose don't simply activate production pathways but actively inhibit the host's native metabolic enzymes responsible for growth. This strategic shutdown re-routes cellular resources toward product synthesis. Surprisingly, simplified circuits that only suppress host metabolism without directly activating production enzymes can perform nearly as well as more complex systems, offering more robust engineering solutions [8].
Multi-level Metabolic Modeling reveals that maximum volumetric productivity is not achieved at maximum growth or synthesis rates. Instead, optimal performance typically lies at a carefully balanced "medium-growth, medium-synthesis" point. This counterintuitive finding challenges conventional wisdom that pushing either variable to its extreme would maximize output. The model further indicates that universally boosting expression of substrate transporter proteins represents a simple yet highly effective strategy for improving productivity across various control circuits [8].
Table 2: Engineering Strategies for Managing Metabolic Heterogeneity in Microbial Cell Factories
| Engineering Approach | Mechanism of Action | Key Findings | Implementation Considerations |
|---|---|---|---|
| Dynamic Metabolic Control [8] | Decouples growth and production phases | Inhibition of native metabolism outperforms simple pathway activation | Requires tunable promoters; circuit predictability varies |
| Morphology Engineering [11] | Optimizes cellular geometry for industrial settings | Filamentous morphology presents challenges in industrial bioreactors | Affects mixing, oxygen transfer, and product secretion |
| Robustness Engineering [81] [82] | Enhances stress tolerance and genetic stability | Improves performance in large-scale bioreactors | Uses ALE, transcription factor engineering, membrane modifications |
Morphology and Robustness Engineering
Physical cellular properties significantly influence metabolic heterogeneity and industrial performance:
Morphology Engineering optimizes cellular geometry for industrial settings. While bacterial shapes have evolved to benefit organisms in their natural environments, these shapes are often suboptimal for industrial applications. Filamentous bacteria, for instance, present unique challenges in bioreactor environments. Successful engineering strategies have included modifying cell division proteins, altering cytoskeleton components, and implementing synthetic morphological regulation to improve bioprocess efficiency [11].
Robustness Enhancement focuses on developing strains that maintain consistent industrial performance despite fluctuating conditions. Key strategies include engineering transcription factors to rewire stress responses, modifying membrane composition and transporters to improve stress tolerance, and implementing adaptive laboratory evolution (ALE) to select for enhanced robustness. Computational approaches including genome-scale modeling help predict robustness determinants and guide engineering interventions [81] [82].
Diagram: Integrative Workflow for Analysis and Engineering of Metabolic Heterogeneity
Workflow for Metabolic Heterogeneity Management
The Scientist's Toolkit: Essential Research Reagent Solutions
Table 3: Key Research Reagents and Platforms for Metabolic Heterogeneity Studies
| Reagent/Platform | Function | Application Context | Key Characteristics |
|---|---|---|---|
| DCFDA Probe [76] | Fluorescent detection of cellular oxidative stress | SCLIMS integration; redox metabolism studies | Live-cell compatible; requires esterase activity for activation |
| u-DESI-MSI Platform [77] | Subcellular spatial metabolomics | Lipid heterogeneity mapping; native state analysis | 5 μm spatial resolution; ambient ionization; minimal sample prep |
| Patch-Clamp Micropipettes [76] | Single-cell content extraction | SCLIMS sampling; volume ~1-5 pL | 1-2 μm diameter; glass capillaries |
| Genome-Scale Metabolic Models [79] [80] | In silico prediction of metabolic fluxes | Strain design; host-microbiome interactions | Constraint-based modeling (FBA); context-specific reconstruction |
| AI-Powered Strain Design Tools [79] | Prediction of optimal genetic modifications | Dynamic circuit design; proteome allocation | Integrates mechanistic models with machine learning |
| Adaptive Laboratory Evolution (ALE) Systems [81] [82] | Selection of robust mutants under stress | Robustness engineering; tolerance improvement | Serial transfer or chemostat-based; applies selective pressure |
The systematic assessment and management of metabolic heterogeneity represents a paradigm shift in microbial cell factory design. By moving beyond population-averaged measurements to single-cell resolution analysis, researchers can identify the fundamental sources of performance variation in industrial bioprocesses. The integrated application of cross-modality single-cell technologies, advanced computational modeling, and targeted engineering strategies enables the transformation of metabolic heterogeneity from an unresolved challenge into a design feature. Implementation of the protocols and frameworks outlined in this Application Note will support the development of next-generation microbial cell factories with enhanced robustness, productivity, and economic viability. Future advances will likely focus on real-time monitoring and control of metabolic heterogeneity directly within bioreactor environments, further closing the loop between analytical insight and engineering implementation.
Conclusion
Enhancing the robustness of microbial cell factories is not a singular task but a multi-faceted endeavor requiring the integration of foundational understanding, sophisticated engineering methodologies, and rigorous validation. The strategies outlined—from global transcriptional rewiring and dynamic control to growth-coupling and advanced quantification—collectively provide a powerful toolkit for stabilizing production phenotypes against industrial perturbations. A key synthesis is that overcoming the fundamental performance-robustness trade-off is paramount, often through temporal strategies that separate growth and production phases. Future directions will be dominated by the tighter integration of real-time biosensing with autonomous genetic circuits, the application of AI for predicting robust designs, and a heightened focus on engineering microbial consortia for distributed metabolic tasks. For biomedical and clinical research, these advances promise more reliable and cost-effective microbial systems for producing complex therapeutics, vaccines, and diagnostic molecules, ultimately accelerating translation from laboratory discovery to scalable industrial and clinical application.
References
- 1. Strategies to increase the robustness of microbial cell ... [https://link.springer.com/article/10.1007/s44307-024-00018-8]
- 2. Robustness: linking strain design to viable bioprocesses [https://www.sciencedirect.com/science/article/pii/S016777992200004X]
- 3. Regulating cellular activity to enhance microbial cell factory ... [https://www.sciencedirect.com/science/article/abs/pii/S0734975025002319]
- 4. Comparison of stress tolerance mechanisms between ... [https://pmc.ncbi.nlm.nih.gov/articles/PMC12097485/]
- 5. Strategies to increase tolerance and robustness of ... [https://www.sciencedirect.com/science/article/pii/S2405805X21000983]
- 6. Strategies to increase the robustness of microbial cell ... [https://pmc.ncbi.nlm.nih.gov/articles/PMC11740849/]
- 7. Seasonal environmental variation impacts 2,4-D fate and ... [https://academic.oup.com/etc/article/44/11/3321/8228583]
- 8. Optimizing Microbial Factories: New Rules for ... [https://www.ailurus.bio/post/optimizing-microbial-factories-new-rules-for-biomanufacturing]
- 9. Advancing Environmental Toxicology In Vitro - PubMed Central [https://pmc.ncbi.nlm.nih.gov/articles/PMC11503916/]
- 10. A Blueprint for Biomanufacturing: Systematizing Microbial Cell ... [https://www.ailurus.bio/post/a-blueprint-for-biomanufacturing-systematizing-microbial-cell-factory-design]
- 11. Engineering bacterial cell morphology for the design of ... [https://pubmed.ncbi.nlm.nih.gov/40529343/]
- 12. Data-Driven Synthetic Cell Factories Development for ... [https://www.sciencedirect.com/science/article/pii/S2693125724000773]
- 13. Fermentation Titer Optimization and Impact on Energy ... [https://pmc.ncbi.nlm.nih.gov/articles/PMC6472596/]
- 14. Balancing Cell Growth and Product Synthesis for Efficient ... [https://pmc.ncbi.nlm.nih.gov/articles/PMC12561436/]
- 15. Using transcription machinery engineering to elicit complex cellular phenotypes - PubMed [https://pubmed.ncbi.nlm.nih.gov/22083746/]
- 16. Recent advances in improving metabolic robustness of ... [https://pmc.ncbi.nlm.nih.gov/articles/PMC7744323/]
- 17. Global transcription machinery engineering in Yarrowia lipolytica - PubMed [https://pubmed.ncbi.nlm.nih.gov/40338609/]
- 18. Engineering yeast transcription machinery for improved ethanol tolerance and production - PubMed [https://pubmed.ncbi.nlm.nih.gov/17158319/]
- 19. gTME for improved adaptation of Saccharomyces cerevisiae to corn cob acid hydrolysate - PubMed [https://pubmed.ncbi.nlm.nih.gov/21365181/]
- 20. Transcending membrane barriers: advances in membrane engineering to enhance the production capacity of microbial cell factories - PMC [https://pmc.ncbi.nlm.nih.gov/articles/PMC11128114/]
- 21. Transportation engineering for enhanced production of plant ... [https://pmc.ncbi.nlm.nih.gov/articles/PMC11224930/]
- 22. Protocol for building synthetic protocell membranes that ... [https://pmc.ncbi.nlm.nih.gov/articles/PMC11264183/]
- 23. Dynamic Metabolic Control: From the Perspective of ... [https://pmc.ncbi.nlm.nih.gov/articles/PMC10986841/]
- 24. Delaying production with prokaryotic inducible expression ... [https://microbialcellfactories.biomedcentral.com/articles/10.1186/s12934-024-02523-w]
- 25. Innovative applications and research advances of bacterial ... [https://pmc.ncbi.nlm.nih.gov/articles/PMC12055861/]
- 26. Site-directed mutagenesis of the quorum-sensing ... [https://microbialcellfactories.biomedcentral.com/articles/10.1186/s12934-021-01603-5]
- 27. Special Issues Details - Synthetic Biology and Engineering [https://www.sciepublish.com/journals/sbe/special_issues/syn_bio_chem_fuels]
- 28. Microbial Whole-Cell Biosensors - PubMed Central - NIH [https://pmc.ncbi.nlm.nih.gov/articles/PMC8376793/]
- 29. Data-driven synthetic microbes for sustainable future [https://www.nature.com/articles/s41540-025-00556-4]
- 30. Strategies to increase the robustness of microbial cell factories - PubMed [https://pubmed.ncbi.nlm.nih.gov/39883204/]
- 31. A growth-coupling strategy for improving the stability of ... [https://microbialcellfactories.biomedcentral.com/articles/10.1186/s12934-024-02548-1]
- 32. Method for plasmid-based antibiotic-free fermentation [https://microbialcellfactories.biomedcentral.com/articles/10.1186/s12934-023-02291-z]
- 33. Synthetic auxotrophs for stable and tunable maintenance ... [https://www.sciencedirect.com/science/article/abs/pii/S1096717617304147]
- 34. Auxotrophy to Xeno-DNA - PubMed Central - NIH [https://pmc.ncbi.nlm.nih.gov/articles/PMC6090650/]
- 35. The combination of active partitioning and toxin-antitoxin ... [https://www.nature.com/articles/s41467-025-62473-8]
- 36. Shared mechanisms of enhanced plasmid maintenance ... [https://pubmed.ncbi.nlm.nih.gov/PMC11796401]
- 37. Stable expression plasmids for Streptomyces based on a toxin ... [https://microbialcellfactories.biomedcentral.com/articles/10.1186/1475-2859-12-39]
- 38. Toxin-Antitoxin Systems Influence Biofilm and Persister ... [https://pmc.ncbi.nlm.nih.gov/articles/PMC3165247/]
- 39. Relieving metabolic to improve robustness and bioproduction... burden [https://pubmed.ncbi.nlm.nih.gov/38944217/]
- 40. Quantifying microbial robustness in dynamic environments ... [https://microbialcellfactories.biomedcentral.com/articles/10.1186/s12934-024-02318-z]
- 41. Plasma membrane integrity: implications for health and disease [https://pmc.ncbi.nlm.nih.gov/articles/PMC8042475/]
- 42. Membrane Integrity - an overview [https://www.sciencedirect.com/topics/engineering/membrane-integrity]
- 43. Engineering microorganisms for enhanced tolerance to toxic ... [https://pmc.ncbi.nlm.nih.gov/articles/PMC12604016/]
- 44. Antimicrobials Functioning through ROS-Mediated ... [https://www.mdpi.com/2076-2607/10/1/61]
- 45. Reactive Oxygen Species (ROS)-Mediated Antibacterial ... [https://pmc.ncbi.nlm.nih.gov/articles/PMC11241369/]
- 46. Metabolic engineering strategies for L-Homoserine production ... [https://microbialcellfactories.biomedcentral.com/articles/10.1186/s12934-024-02623-7]
- 47. 2-Stage microfermentations [https://www.sciencedirect.com/science/article/pii/S2214030124000026]
- 48. 2-Stage microfermentations [https://pubmed.ncbi.nlm.nih.gov/38665924/]
- 49. 2-Stage microfermentations. - Scholars@Duke publication [https://scholars.duke.edu/publication/1624914]
- 50. Engineering a PhrC-RapC-SinR quorum sensing molecular ... [https://microbialcellfactories.biomedcentral.com/articles/10.1186/s12934-025-02714-z]
- 51. Two-Step Bio-Based Production of Heme: In Vivo Cell ... [https://www.mdpi.com/2311-5637/11/4/198]
- 52. Metabolic model-guided strain design for improved ... [https://www.sciencedirect.com/science/article/abs/pii/S0960852425014750]
- 53. Developing a Computational Framework To Advance ... [https://www.sciencedirect.com/science/article/abs/pii/S0167779920300251]
- 54. Machine Learning Empowering Microbial Cell Factory [https://pubmed.ncbi.nlm.nih.gov/40397295/]
- 55. Computational design of enzymes for biotechnological ... [https://pubmed.ncbi.nlm.nih.gov/33513434/]
- 56. Relieving metabolic burden to improve robustness and ... [https://www.sciencedirect.com/science/article/pii/S0734975024000958]
- 57. Advances in adaptive laboratory evolution applications for ... [https://pmc.ncbi.nlm.nih.gov/articles/PMC12391446/]
- 58. Integrated laboratory evolution and rational engineering of ... [https://pmc.ncbi.nlm.nih.gov/articles/PMC7907822/]
- 59. Comprehensive evaluation of the capacities of microbial ... [https://www.nature.com/articles/s41467-025-58227-1]
- 60. Physiology and Robustness of Yeasts Exposed to Dynamic ... [https://pmc.ncbi.nlm.nih.gov/articles/PMC12152528/]
- 61. How to Perform a Microfluidic Cultivation Experiment—A ... [https://pmc.ncbi.nlm.nih.gov/articles/PMC8699335/]
- 62. Microfluidic application notes [https://elveflow.com/microfluidic-application-notes/]
- 63. Protocol to perform dynamic microfluidic single-cell ... [https://www.sciencedirect.com/science/article/pii/S2666166723004033]
- 64. Quantification of Microbial Robustness in Yeast - PMC [https://pmc.ncbi.nlm.nih.gov/articles/PMC9016762/]
- 65. Four ways of implementing robustness quantification in ... [https://pmc.ncbi.nlm.nih.gov/articles/PMC10729505/]
- 66. Fano factor [https://en.wikipedia.org/wiki/Fano_factor]
- 67. Microbial Cell Factories: Biodiversity, Pathway ... [https://www.mdpi.com/2036-7481/15/1/18]
- 68. Mechanism and improvement of yeast tolerance to ... [https://www.sciencedirect.com/science/article/abs/pii/S0734975025000485]
- 69. Insights into cell robustness against lignocellulosic ... [https://www.nature.com/articles/s41598-021-04554-4]
- 70. Phenotypic characterization and comparative transcriptomics ... [https://biotechnologyforbiofuels.biomedcentral.com/articles/10.1186/s13068-016-0614-y]
- 71. Phenotypic and comparative transcriptomics analysis of ... [https://www.sciencedirect.com/science/article/abs/pii/S1389172323002256]
- 72. Lignocellulosic hydrolysate composition influences ... [https://pubmed.ncbi.nlm.nih.gov/40554021/]
- 73. Saccharomyces cerevisiae strains performing similarly ... [https://pubmed.ncbi.nlm.nih.gov/38587374/]
- 74. Design principles for engineering bacteria to maximise ... [https://www.nature.com/articles/s41467-024-55347-y]
- 75. Overflow metabolism originates from growth optimization ... [https://elifesciences.org/articles/94586]
- 76. Integrative single-cell metabolomics and phenotypic ... [https://www.nature.com/articles/s41467-025-57992-3]
- 77. Delineation of Subcellular Molecular Heterogeneity in ... [https://pmc.ncbi.nlm.nih.gov/articles/PMC12101054/]
- 78. Single-cell transcriptomic analysis reveals metabolic and ... [https://www.sciencedirect.com/science/article/pii/S2405844025020948]
- 79. Cell factory design with advanced metabolic modelling ... [https://www.sciencedirect.com/science/article/pii/S1096717624000879]
- 80. Metabolic modeling reveals a multi-level deregulation of ... [https://www.nature.com/articles/s41467-025-60233-2]
- 81. Industrial–scale production of various bio–commodities by ... [https://www.sciencedirect.com/science/article/abs/pii/S1385894724091708]
- 82. Microbial Cell Factory Engineering for Scalable Production ... [https://jbiochemtech.com/article/microbial-cell-factory-engineering-for-scalable-production-of-bio-commodities-emphasis-on-robustnes-dgle43o7euadt9i]