MS vs NMR in Isotopic Labeling: A Comprehensive Guide for Biomedical Researchers
This article provides a comparative analysis of Mass Spectrometry (MS) and Nuclear Magnetic Resonance (NMR) spectroscopy for isotopic labeling studies, tailored for researchers and drug development professionals.
MS vs NMR in Isotopic Labeling: A Comprehensive Guide for Biomedical Researchers
Abstract
This article provides a comparative analysis of Mass Spectrometry (MS) and Nuclear Magnetic Resonance (NMR) spectroscopy for isotopic labeling studies, tailored for researchers and drug development professionals. It covers foundational principles, methodological applications across metabolomics, proteomics, and structural biology, and offers practical guidance for troubleshooting and optimization. By synthesizing current methodologies and validation strategies, this guide aims to empower scientists in selecting the appropriate technique for their specific research objectives, from pathway discovery to drug metabolism studies.
Discovering Core Principles: How MS and NMR Detect Isotopic Labels
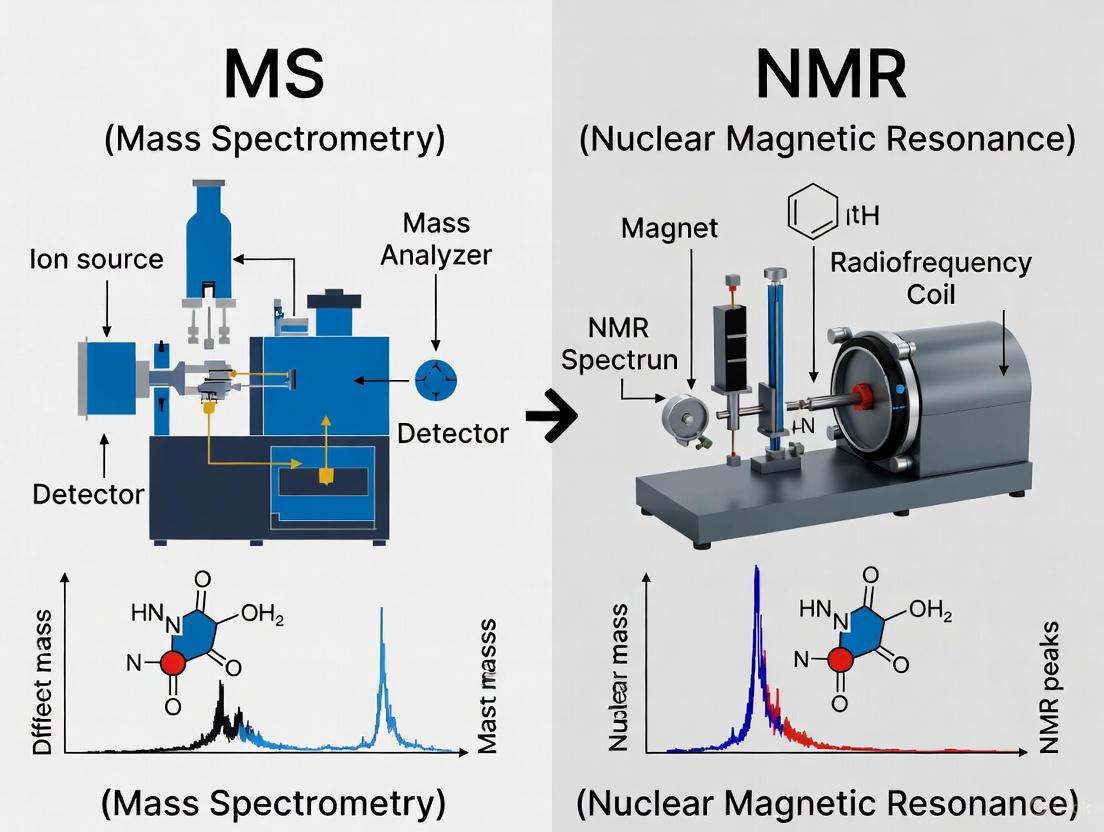
In the fields of metabolomics, natural products research, and drug development, accurately measuring the molecular composition of complex biological samples is a fundamental challenge. Two analytical techniques stand as pillars for this task: Mass Spectrometry (MS) and Nuclear Magnetic Resonance (NMR) spectroscopy. While both provide invaluable data, their underlying detection mechanisms are fundamentally different. MS separates and identifies ions based on their mass-to-charge ratios (m/z), whereas NMR detects the magnetic properties of specific atomic nuclei, such as ¹H or ¹³C, within a molecule. This guide provides an objective comparison of these two techniques, with a particular focus on their performance in isotopic labeling studies, supported by current experimental data and protocols.
Core Principles and Comparative Strengths
The distinct physical principles behind MS and NMR directly result in complementary strengths and weaknesses.
- Mass Spectrometry (MS) relies on the ionization of molecules to generate gas-phase ions, which are then separated by their m/z ratio in an electric or magnetic field. The detection of these ions provides information on molecular mass and, through fragmentation patterns, structural clues.
- Nuclear Magnetic Resonance (NMR) Spectroscopy exploits the magnetic properties of atomic nuclei. When placed in a strong magnetic field, nuclei with a non-zero spin (like ¹H or ¹³C) can absorb and re-emit radiofrequency energy. The frequency of this resonance is exquisitely sensitive to the local chemical environment, providing direct information on molecular structure, dynamics, and atomic connectivity.
The table below summarizes the key performance characteristics of both techniques.
Table 1: Comparative Analysis of MS and NMR Techniques
| Feature | Mass Spectrometry (MS) | Nuclear Magnetic Resonance (NMR) |
|---|---|---|
| Detection Principle | Mass-to-charge ratio (m/z) of ions [1] | Magnetic properties of atomic nuclei (e.g., ¹H, ¹³C) [2] |
| Sensitivity | High (detection of low-abundance metabolites) [3] [4] | Lower, but steadily improving with cryoprobes & high-field magnets [2] [4] |
| Quantification | Requires calibration curves & internal standards; can be semi-quantitative | Inherently quantitative; signal intensity is directly proportional to nucleus count [2] [4] |
| Structural Elucidation | Provides molecular mass & fragment patterns; limited for isomers [4] | Unmatched for determining unknown structures & identifying isomers [2] [4] |
| Isotope Analysis | Quantifies isotopic labeling distributions [2] | Identifies specific atomic positions of isotope labels (e.g., ¹³C, ¹⁵N) [2] [5] |
| Sample Preparation | Often requires separation (LC/GC) and/or derivatization [3] | Minimal preparation; can be non-destructive and applied in vivo [2] [3] |
| Reproducibility | Can vary with ionization efficiency and matrix effects | Highly reproducible and quantitative over a wide dynamic range [2] |
| Key Strength | High sensitivity and throughput | Robust quantification and unambiguous structural analysis |
Quantitative Performance in Isotopic Analysis
Isotopic labeling is a cornerstone technique for tracing metabolic pathways and fluxes. Here, the complementary nature of MS and NMR is particularly evident.
NMR for High-Precision Isotopic Analysis
Quantitative NMR (qNMR) is increasingly recognized for its high precision in isotopic ratio measurement. Advanced software tools like rnmrfit 2.0 have been developed specifically for this purpose. This tool uses semi-global peak fitting with automated peak region selection to achieve high precision, demonstrating performance superior to common commercial NMR analysis software [6].
Table 2: Isotopic Precision Achievable with NMR Spectroscopy
| Isotope | Achievable Precision | Key Technique / Software |
|---|---|---|
| ²H (Deuterium) | 0.26% | rnmrfit 2.0 software for peak fitting [6] |
| ¹³C (Carbon-13) | 0.16% | rnmrfit 2.0 software for peak fitting [6] |
A critical advantage of NMR in isotope analysis is its ability to determine the specific position of a label within a molecule. For example, in a ¹³C-labeled glucose molecule, NMR can distinguish which carbon atom carries the label, providing direct insight into the metabolic pathway that produced it. MS, in contrast, typically quantifies the overall isotopic enrichment but cannot pinpoint the exact atomic position without additional, often indirect, experiments [2].
Experimental Protocol: NMR-Based Isotopic Quantification
The following is a generalized protocol for high-precision isotopic analysis using NMR, based on methodologies described in the literature [6] [7]:
- Sample Preparation: The analyte is dissolved in a deuterated solvent. An internal quantitative standard (e.g., maleic acid) of known concentration is added for absolute quantification [7].
- Data Acquisition: ¹H or ¹³C NMR spectra are acquired on a spectrometer (e.g., Bruker Avance III HD) with a cryoprobe for enhanced sensitivity. Critical acquisition parameters must be optimized:
- Pulse Sequence: A quantitative pulse sequence (e.g., zg) with a flip angle of 90° is used.
- Relaxation Delay (d1): Set to > 10 times the longitudinal relaxation time (T₁) of the slowest-relaxing nucleus of interest to ensure complete relaxation between scans for accurate integration [7].
- Number of Scans (NS): Adjusted to achieve sufficient signal-to-noise ratio (e.g., > 150:1).
- Spectral Processing: The Free Induction Decay (FID) is processed with careful attention to:
- Data Analysis with rnmrfit 2.0:
- Load the processed spectrum into the software.
- Define the spectral regions of interest for the analyte and internal standard.
- Execute the semi-global fitting algorithm, which models the experimental spectrum as a sum of individual peak shapes (e.g., Lorentzian lines).
- The software outputs the integrated area for each peak, which is used to calculate the concentration and isotopic enrichment with high precision [6].
NMR Isotopic Analysis Workflow
Synergistic Applications: Combining MS and NMR
Rather than viewing MS and NMR as competitors, the most powerful approach is to use them synergistically. The combination of both techniques greatly improves the confidence and depth of compound identification in complex mixtures [2] [4].
- MS-Driven Discovery to NMR Validation: A common workflow uses the high throughput and sensitivity of MS to identify potential biomarkers or interesting metabolites in a complex mixture. Subsequently, NMR is employed for the unambiguous structural elucidation of these shortlisted compounds, distinguishing between isomers and confirming atomic connectivity [4].
- Integrated Data Analysis: Advanced methods now exist to simultaneously analyze data from both MS and NMR. One approach filters data from one technique against the other to increase the number of compounds confidently identified. Another method identifies compounds by exploiting the principle that abundance/intensity ratios are relatively constant for the same metabolite in different samples analyzed by both techniques [2].
- Comprehensive Isotope Tracing: In metabolic flux analysis, MS generally quantifies the overall distribution of isotopic labeling, while NMR provides the specific labeling positions within a molecule. Using both techniques offers a complete picture of metabolic pathway dynamics [2].
Complementary MS-NMR Relationship
Essential Research Reagent Solutions
Successful implementation of MS and NMR methodologies, especially in isotopic labeling studies, relies on key reagents and materials.
Table 3: Key Reagents and Materials for Isotopic Analysis
| Item | Function | Application Context |
|---|---|---|
| Stable Isotope-Labeled Precursors (e.g., ¹³C-glucose, ¹⁵N-ammonia) | To trace metabolic pathways and measure flux. | Used in both MS and NMR experiments to introduce a detectable label into metabolic systems [2] [5]. |
| Deuterated Solvents (e.g., D₂O, CD₃OD) | Provides a lock signal for the NMR spectrometer and minimizes interfering solvent signals. | Essential for high-resolution NMR spectroscopy [7]. |
| Internal Quantitative Standards (e.g., TSP, maleic acid) | A reference compound of known purity and concentration for absolute quantification in qNMR. | Added directly to the NMR sample; its signal is used as a calibrant [7] [8]. |
| Methyltransferases (e.g., Msp, 2Bst) | Enzymes for site-specific installation of ¹³C-methyl labels on DNA or RNA. | Enables NMR studies of large nucleic acids and their complexes via the methyl TROSY effect [5]. |
| Cryoprobes and Microprobes | NMR probe technology that increases sensitivity by reducing thermal noise or optimizing sample volume. | Critical for detecting low-abundance metabolites and analyzing mass-limited samples [2] [4]. |
| rnmrfit 2.0 Software | An open-source tool for high-precision fitting of NMR peaks for isotopic ratio measurement. | Used for quantitative analysis of ¹³C and ²H NMR spectra, offering superior precision over commercial software [6]. |
Both Mass Spectrometry and Nuclear Magnetic Resonance spectroscopy are indispensable tools in the modern scientist's toolkit. The choice between them is not a matter of which is universally better, but which is more appropriate for the specific research question at hand, and more often, how they can be best used together.
MS is the preferred tool for high-throughput screening, detecting low-abundance metabolites, and rapidly determining molecular formulas. NMR is unmatched for unambiguous structural elucidation, distinguishing isomers, performing absolute quantification without specific standards, and identifying the precise positions of isotope labels within a molecule. For advanced isotopic analysis in metabolic flux studies or authenticity testing, NMR, particularly with tools like rnmrfit 2.0, provides a level of precision and positional information that is complementary to the high sensitivity of MS. By leveraging the synergistic power of both mass-based and magnetic property-based detection, researchers can achieve a more complete and robust understanding of complex biological systems.
Natural Abundance and its Impact on Experimental Design
The natural abundance of stable isotopes is a fundamental physical property that profoundly shapes the design and execution of experiments in chemical and pharmaceutical research. For nuclei critical to molecular structure elucidation, such as carbon-13 (∼1.1%) and nitrogen-15 (∼0.05%), their low natural occurrence renders them nearly invisible to routine nuclear magnetic resonance (NMR) detection [9]. This limitation is a pivotal factor driving the need for isotopic labeling, a process that introduces enriched isotopes into molecules to make them detectable by analytical techniques like NMR and Mass Spectrometry (MS). Within drug discovery, understanding the Absorption, Distribution, Metabolism, and Excretion (ADME) of compounds is paramount, and isotopic labeling provides the necessary tracers for these studies [10]. The choice between MS and NMR as the primary detection method directly influences the experimental design, from the selection of the isotope to the labeling strategy employed. This guide objectively compares the performance of MS and NMR in the context of isotopic labeling, providing researchers with a framework to select the optimal technique for their investigative goals.
The Fundamental Challenge: Low Natural Abundance of Key Isotopes
The natural abundance of an isotope dictates its baseline detectability. For 1H-NMR, the high (∼99.98%) natural abundance of protons enables the direct acquisition of spectra without enrichment. However, the narrow dispersion of proton chemical shifts leads to significant signal overlap in complex molecules, complicating analysis [9]. This is where the higher chemical shift dispersion of other nuclei, like carbon-13 and nitrogen-15, becomes invaluable. Unfortunately, their low natural abundance means that, in a uniformly unlabeled sample, the probability of a molecule containing even a single 13C or 15N atom at a specific position is exceedingly low. Consequently, the signals from these nuclei are too weak to be practically detected in NMR experiments, creating a fundamental barrier to studying molecular structure and dynamics [9]. This experimental void necessitates the artificial enrichment of these isotopes to raise their concentration to detectable levels, thereby enabling detailed spectroscopic analysis.
Comparative Analysis: MS vs. NMR as Detection Techniques for Isotopic Labels
The selection between Mass Spectrometry (MS) and Nuclear Magnetic Resonance (NMR) spectroscopy is a critical decision point in experimental design, as each technique has distinct strengths, requirements, and outputs based on the isotopic labels used. The table below provides a structured comparison of these two cornerstone technologies.
Table 1: Performance Comparison of MS and NMR in Isotopic Labeling Analysis
| Feature | Mass Spectrometry (MS) | Nuclear Magnetic Resonance (NMR) |
|---|---|---|
| Core Detection Principle | Measures mass-to-charge ratio (m/z) of ions [11]. | Detects nuclear spin transitions in a magnetic field [9]. |
| Impact of Natural Abundance | Can complicate spectra with complex isotopologue patterns, but high sensitivity allows detection of low-abundance species. | Low natural abundance of 13C/15N makes detection without enrichment impractical; enrichment is required for detailed study [9]. |
| Primary Isotopes Used | ²H (D), ¹³C, ¹⁵N, ¹⁸O [11]. | ¹³C, ¹⁵N, ²H (for dilution) [12] [9]. |
| Key Strength | High sensitivity; ideal for tracing and quantifying isotopes in complex mixtures (e.g., metabolic flux) [11]. | Provides atomic-resolution structural and dynamic information (e.g., protein-ligand interactions, conformation) [13] [9]. |
| Typical Application | Metabolic flux analysis (13C-MFA), ADME studies, quantitative proteomics (SILAC) [11] [10]. | Protein structure determination, fragment-based drug discovery, mapping binding sites [13] [9]. |
| Sample Requirement | Low (picomole to femtomole levels). | High (nanomole to micromole levels). |
| Data Output | Quantification of isotopic incorporation and distribution. | Site-specific assignment of isotopic labels and reporting on local chemical environment. |
Isotopic Labeling Strategies to Overcome Natural Abundance Limitations
To leverage the power of MS and NMR, researchers employ sophisticated labeling strategies that move beyond simple uniform enrichment. These strategies are designed to simplify complex spectra, reduce costs, and provide specific information.
Table 2: Common Isotopic Labeling Strategies and Their Experimental Utility
| Labeling Strategy | Description | Primary Technique | Experimental Purpose |
|---|---|---|---|
| Uniform Labeling | Incorporates an isotope (e.g., ¹³C or ¹⁵N) at all possible sites in the molecule [9]. | NMR | Foundation for multi-dimensional NMR experiments; enables comprehensive structural studies [12]. |
| Amino Acid-Specific Labeling | Incorporates isotopes into a single type of amino acid (e.g., [U-¹⁵N]-lysine) [9]. | NMR | Simplifies spectra by turning "on" signals only for selected residues; aids in assignment and analysis of large proteins [9]. |
| Reverse Labeling | Uses unlabeled amino acids or precursors in an otherwise uniformly labeled background, thereby "turning off" selected signals [9]. | NMR | Simplifies crowded regions of NMR spectra by removing signals from abundant residue types (e.g., aliphatic/aromatic in membrane proteins) [9]. |
| Stable Isotope Labeling with Amino Acids in Cell Culture (SILAC) | Incorporates "heavy" ¹³C/¹⁵N-labeled amino acids into proteomes of cultured cells for comparative analysis [11]. | MS | Quantitative proteomics; accurately compares protein expression levels between different samples [11]. |
| Deuteration (²H) | Replaces ¹H with ²H in the protein backbone or sidechains [9]. | NMR | Reduces signal-broadening in large proteins, enabling TROSY-based studies of macromolecular complexes [9]. |
| Hydrogen Isotope Exchange (HIE) | Replaces hydrogen with deuterium (²H) or tritium (³H) via catalytic exchange, often in late-stage synthesis [10]. | MS / Scintillation | Creates labeled compounds for ADME studies; improves metabolic stability via the Kinetic Isotope Effect (deuterium) [10]. |
Experimental Protocols for Key Labeling Workflows
The practical implementation of labeling strategies requires standardized protocols. Below are detailed methodologies for two foundational approaches: one for NMR and one for MS.
Protocol: Residue-Specific Reverse Labeling for NMR Spectroscopy
This protocol is used to simplify crowded regions in a 2D ¹H-¹⁵N HSQC spectrum of a uniformly labeled protein by making specific amino acid types NMR-invisible [9].
- Molecular Biology: Clone the gene of interest into an appropriate expression vector for Escherichia coli (E. coli).
- Media Preparation: Prepare a defined minimal medium using M9 salts. Use ¹⁵NH₄Cl as the sole nitrogen source to ensure uniform ¹⁵N labeling. Supplement this medium with a single, unlabeled (natural abundance) amino acid that you wish to "reverse label" (e.g., unlabeled lysine).
- Protein Expression: Transform the expression plasmid into an E. coli expression strain. Grow the culture in the prepared medium. Induce protein expression with Isopropyl β-d-1-thiogalactopyranoside (IPTG) at the optimal cell density (OD₆₀₀ ~0.6-0.8). Express the protein for several hours at a temperature conducive to solubility (e.g., 18-37°C).
- Protein Purification: Harvest cells by centrifugation. Lyse the cells using sonication or a French press. Purify the protein using affinity chromatography (e.g., Ni-NTA for His-tagged proteins), followed by size-exclusion chromatography if needed.
- NMR Data Acquisition: Concentrate the purified protein and prepare an NMR sample in an appropriate buffer. Acquire a 2D ¹H-¹⁵N HSQC spectrum. The cross-peaks corresponding to the reverse-labeled amino acid (e.g., lysine) will be absent or significantly diminished, simplifying spectral analysis.
Protocol: Metabolic Flux Analysis with ¹³C-Labeled Glucose
This protocol is a cornerstone of MS-based analysis for tracking carbon flow through metabolic pathways [11].
- Cell Culture and Labeling: Grow cells (e.g., E. coli, yeast, or mammalian cells) in a tightly controlled bioreactor. Once the culture reaches a steady state of growth, rapidly switch the carbon source from unlabeled glucose to an equivalent amount of uniformly labeled ¹³C-glucose.
- Sampling and Quenching: At precise time intervals after the switch, withdraw culture samples and immediately quench metabolism using cold methanol or similar rapid-quench methods to "freeze" the metabolic state.
- Metabolite Extraction: Extract intracellular metabolites from the quenched cell pellets using a solvent system like cold methanol/acetonitrile/water.
- MS Analysis and Isotopomer Modeling: Analyze the extracted metabolites using Liquid Chromatography-MS (LC-MS) or Gas Chromatography-MS (GC-MS). The mass spectra will reveal the distribution of ¹³C atoms (isotopologues) in each metabolite. This data is then fed into computational models (e.g., using software like INCA or OpenFLUX) to calculate the metabolic flux rates through the network.
Visualization of Experimental Workflows
The following diagrams illustrate the logical flow of the two primary experimental strategies discussed, highlighting the role of isotopic labeling and the divergence towards MS or NMR detection.
Diagram 1: MS vs NMR Experimental Design Workflow
The Scientist's Toolkit: Essential Research Reagent Solutions
Successful isotopic labeling experiments depend on specific, high-quality reagents. The table below details key materials and their functions in this field.
Table 3: Key Research Reagents for Isotopic Labeling Experiments
| Reagent / Material | Function / Application | Example Isotopologues |
|---|---|---|
| Labeled Amino Acids | Residue-specific labeling in proteins for NMR; essential for SILAC in MS-based proteomics [9] [11]. | [U-¹⁵N]-Lysine, [¹³C₆,¹⁵N₂]-Lysine (for SILAC) |
| ¹³C-Labeled Carbon Sources | Serves as the carbon backbone for microbial growth and uniform ¹³C protein labeling; used as a tracer for Metabolic Flux Analysis (MFA) in MS [9] [11]. | [U-¹³C]-Glucose, 1-¹³C-Glucose |
| ¹⁵N-Labeled Nitrogen Sources | Provides the nitrogen for uniform ¹⁵N labeling of proteins for NMR, enabling ¹H-¹⁵N correlation experiments [9]. | ¹⁵NH₄Cl |
| α-Ketoacid Precursors | Cost-effective metabolic precursors for selective side-chain (e.g., methyl group) labeling in proteins for NMR, especially in challenging expression systems [14]. | 2-[¹³C]-methyl acetolactate (for Val/Leu) |
| Deuterium Oxide (D₂O) | Deuterium source for producing deuterated proteins to suppress ¹H-¹H relaxation, crucial for NMR studies of large proteins [9]. | D₂O |
| HIE Catalysts | Facilitate late-stage, direct hydrogen-deuterium/tritium exchange on complex molecules, streamlining the creation of labeled compounds for ADME studies [10]. | Iridium, Ruthenium complexes |
Natural abundance is not merely a statistical footnote but a central factor that dictates the feasibility and design of experiments aimed at understanding molecular structure and function. The low natural abundance of isotopes like 13C and 15N creates a detection threshold that can only be overcome through deliberate isotopic enrichment. The choice between MS and NMR as the core analytical technique leads to divergent experimental pathways: MS excels in high-sensitivity tracing and quantification within complex mixtures, while NMR provides unparalleled atomic-resolution insight into structure and dynamics. By understanding the comparative strengths of these techniques and mastering the associated labeling strategies—from uniform enrichment to residue-specific reverse labeling and metabolic tracing—researchers can design robust experiments that turn the challenge of natural abundance into a powerful tool for scientific discovery and drug development.
Stable isotopic labels, including Carbon-13 (13C), Nitrogen-15 (15N), and Deuterium (2H), serve as powerful, non-radioactive tracers for investigating complex biological systems. These isotopes are incorporated into metabolites, drugs, and biomolecules to track their fate through metabolic pathways, study protein structure and dynamics, and quantify biochemical flux. The choice of isotope and detection technology—either Nuclear Magnetic Resonance (NMR) spectroscopy or Mass Spectrometry (MS)—is fundamental to experimental design, as each combination offers distinct advantages and limitations. NMR provides unparalleled structural detail and atom-by-atom tracking within molecules, while MS offers exceptional sensitivity for detecting low-abundance species. This guide provides a systematic comparison of these isotopic labels and detection techniques, empowering researchers to select the optimal approach for their specific applications in pharmaceutical and biochemical research.
Technical Principles and Comparison of Detection Techniques
Fundamental Principles of NMR and MS for Isotope Detection
Nuclear Magnetic Resonance (NMR) spectroscopy exploits the magnetic properties of atomic nuclei. When placed in a strong magnetic field, nuclei with a non-zero spin, such as 1H, 13C, and 15N, absorb and re-emit electromagnetic radiation. The frequency of this radiation (the chemical shift) is exquisitely sensitive to the local chemical environment, providing detailed structural information. For isotopic labeling studies, NMR directly detects the labeled nuclei (e.g., 13C) or detects their influence on nearby sensitive nuclei (e.g., 1H). A key advantage of NMR is its ability to differentiate isotopomers—molecules that differ in the positional arrangement of isotopes—which is crucial for understanding metabolic pathways [15].
Mass Spectrometry (MS) separates ions based on their mass-to-charge ratio (m/z). Introducing a stable isotope, such as 13C or 15N, increases the mass of a molecule or fragment, creating a distinct signal that can be resolved from the unlabeled species. MS is exceptionally sensitive and can detect very low concentrations of labeled compounds. However, it typically identifies isotopologues—molecules differing in their total isotopic composition—without directly revealing the specific atomic position of the label within the molecule [15].
Comparative Analysis: NMR vs. MS
The table below summarizes the core technical characteristics of NMR and MS in the context of stable isotope detection.
Table 1: Technical Comparison of NMR and MS for Isotopic Label Detection
| Feature | Nuclear Magnetic Resonance (NMR) | Mass Spectrometry (MS) |
|---|---|---|
| Information Obtained | Identifies isotopomers (positional enrichment) [15]. Provides direct structural and stereochemical data. | Identifies isotopologues (total mass enrichment) [15]. Structural inference requires fragmentation (MS/MS). |
| Quantitation | Inherently quantitative; signal intensity is directly proportional to the number of nuclei [15] [16]. | Requires calibration curves for absolute quantitation; relative quantitation is robust [15]. |
| Sensitivity | Historically lower, requiring larger samples or enrichment. Enhanced by hyperpolarization [17] or cryoprobes [18]. | Extremely high sensitivity, capable of detecting metabolites in the nanomolar range or lower [16]. |
| Sample Throughput | Lower throughput; acquisition times can be minutes to hours. | High throughput; rapid analysis times (minutes) [15]. |
| Key Strength | Chemical specificity, atom-by-atom tracking, non-destructive. | Sensitivity, high molecular specificity when coupled with chromatography, suitability for high-throughput workflows. |
| Key Limitation | Lower sensitivity, requires larger sample amounts. | Cannot distinguish positional enrichment without additional experiments (e.g., fragmentation). |
In-Depth Analysis of Individual Isotopic Labels
Carbon-13 (13C) Labeling
13C is one of the most versatile labels due to its presence in all organic compounds. Its relatively low natural abundance (1.1%) makes it an excellent tracer.
- NMR Applications: 13C NMR benefits from a wide chemical shift range (~250 ppm), which minimizes signal overlap compared to 1H NMR [19]. Quantitative 13C NMR (13C qNMR) is used for pharmaceutical analysis, from small molecules to biopolymers [19]. A significant innovation is the use of hyperpolarized 13C, where techniques like dynamic nuclear polarization (DNP) can enhance signal by >10,000-fold, enabling real-time tracking of metabolism in living systems [17]. For example, injecting hyperpolarized [1-13C]pyruvate allows monitoring its conversion to lactate, alanine, and bicarbonate in cancer models [17].
- MS Applications: 13C labeling is widely used in fluxomics to track carbon flow through metabolic networks. An advanced application is Single-Cell MS (scMS), which tracks 13C incorporation into specialized metabolites, like alkaloids in plant cells, at single-cell resolution, revealing cell-to-cell heterogeneity in metabolic pathways [20].
- Indirect 1H NMR Detection: To overcome the inherent low sensitivity of direct 13C detection, a high-throughput method uses 1H NMR to indirectly measure 13C enrichment. When a 1H nucleus is attached to a 13C atom, the J-coupling constant changes. By comparing 1H spectra with and without 13C decoupling, researchers can quantify the 13C enrichment fraction, combining the sensitivity of 1H NMR with the tracing power of 13C [15].
Nitrogen-15 (15N) Labeling
15N is primarily used to study nitrogen-containing compounds, such as amino acids, nucleotides, and proteins.
- NMR Applications: 15N is essential for biomolecular NMR, especially for studying protein structure and dynamics. A key challenge is its low natural abundance (0.37%) and sensitivity, which are improved with high-field spectrometers and cryoprobes [18]. Optimal Control (OC) pulses have been developed for 15N at high magnetic fields (e.g., 1.2 GHz) to ensure efficient and uniform spin manipulation, enhancing the sensitivity of 13C-detected experiments for proteins, including intrinsically disordered proteins (IDPs) [21]. A powerful targeted profiling strategy involves chemically tagging metabolites containing carboxyl groups with a 15N-ethanolamine label. This allows for the detection of over 100 carboxyl-containing metabolites using sensitive 1H-15N 2D NMR experiments, greatly reducing spectral complexity [16].
- MS Applications: 15N-labeled compounds are easily distinguished by MS due to a mass shift. They are routinely used in quantitative proteomics (e.g., SILAC) and metabolomics. The 15N tag from ethanolamine also provides a predictable mass shift for tagged metabolites, facilitating their identification in complex mixtures by MS [16].
Deuterium (2H) Labeling
Deuterium (2H) has a nucleus that is NMR-active, but its low gyromagnetic ratio makes it less sensitive than 1H.
- NMR Applications: Deuterium Metabolic Imaging (DMI) is an emerging in vivo application where 2H-labeled substrates (e.g., 2H-glucose) are administered. The metabolism is then tracked using 2H Magnetic Resonance Spectroscopic Imaging (MRSI) at high field strengths (e.g., 7 T). This technique maps the production of metabolites like lactate and glutamate in tissues. Due to low signal-to-noise, advanced low-rank denoising methods (e.g., SPIN-SVD, tMPPCA) are employed to enhance data quality, enabling mapping of metabolic fluxes in the brain and tumors [22].
- MS Applications: 2H labeling is very common in MS-based tracing due to the significant mass shift and lower cost compared to 13C. It is extensively used in drug metabolism studies (to track metabolites) and in kinetic studies. As demonstrated in single-cell MS, deuterated precursors (e.g., d5-tryptamine) can be fed to protoplasts to track the synthesis of deuterated alkaloids over time, elucidating biosynthetic pathways with cellular resolution [20].
Table 2: Summary of Isotopic Labels and Their Primary Applications
| Isotope | Natural Abundance | Primary NMR Applications | Primary MS Applications |
|---|---|---|---|
| 13C | 1.1% | Hyperpolarized metabolic imaging [17], qNMR for pharmaceuticals [19], structural analysis. | Metabolic flux analysis [20], isotopologue profiling. |
| 15N | 0.37% | Protein structure/dynamics [21], targeted metabolomics via chemical tagging [16]. | Quantitative proteomics (SILAC), identification of N-containing metabolites. |
| 2H | 0.011% | Deuterium Metabolic Imaging (DMI) for in vivo metabolism [22]. | Drug metabolism studies, kinetic profiling, biosynthetic pathway tracing [20]. |
Experimental Protocols and Workflows
Protocol 1: Indirect Quantification of 13C Enrichment via 1H NMR
This protocol is designed for high-throughput quantification of 13C-labeled metabolites in cell lines and tissue extracts [15].
- Cell Culture and Labeling: Plate cells (e.g., 1 × 10^6 cells per well). Treat according to experimental design. Replace media with media containing either 5 mM natural abundance glucose or 5 mM [1,6-13C]glucose. Incubate for a set period (e.g., 3 hours).
- Metabolite Extraction: Remove media and store at -80°C. Wash cells with cold PBS. Add 2 mL of 80% cold methanol to the cells and incubate at -80°C overnight to extract water-soluble metabolites. Centrifuge at 4000 rpm for 30 min at 4°C. Collect the supernatant and lyophilize.
- Sample Preparation for NMR: Reconstitute the lyophilized extract in 600 μL of buffer containing 10% D2O, 0.5 mM DSS (internal chemical shift and quantitation standard), and 10 mM imidazole (pH indicator). For media samples, first remove proteins using a 3 kDa centrifugal filter.
- 1H NMR Data Acquisition: Acquire 1D 1H NMR spectra with and without 13C decoupling during acquisition.
- Data Analysis: In the 1H spectrum without decoupling, signals from protons bound to 12C appear as singlets, while signals from protons bound to 13C are split into doublets (due to J-coupling). The 13C-decoupled spectrum collapses all signals to singlets. The fractional 13C enrichment for a specific metabolic pool is calculated by measuring the signal intensity loss of the 12C-bound proton singlet in the decoupled spectrum compared to the non-decoupled spectrum.
Diagram 1: Workflow for Indirect ¹³C Quantification via ¹H NMR.
Protocol 2: Targeted Metabolite Profiling Using 15N Tagging
This protocol uses a chemoselective 15N tag to profile carboxyl-containing metabolites with high sensitivity in complex biological samples like serum and urine [16].
- Derivatization Reaction: Mix the biological sample (e.g., serum or urine) with 15N-ethanolamine and the coupling reagent 4-(4,6-Dimethoxy-1,3,5-triazin-2-yl)-4-methylmorpholinium chloride (DMT-MM). Incubate to allow the conjugation of the 15N-tag to the carboxyl groups of metabolites.
- Sample Purification: After the reaction is complete, purify the mixture using a centrifugal filter device (e.g., Centriprep YM-10) to remove excess reagents and buffer exchange.
- 2D 1H-15N NMR Acquisition: Acquire a 2D 1H-15N heteronuclear correlation spectrum (e.g., HSQC or HMQC). The 15N tag creates a new, well-dispersed 1H-15N spin system for every tagged metabolite.
- Metabolite Identification and Quantification: Identify metabolites by matching the observed 1H and 15N chemical shifts to a database of known 15N-ethanolamine derivatives. The signal intensity in the 2D spectrum is directly proportional to metabolite concentration, enabling absolute quantification against an internal standard.
Diagram 2: Workflow for Targeted Profiling with ¹⁵N Tagging.
The Scientist's Toolkit: Key Research Reagent Solutions
Table 3: Essential Reagents and Materials for Isotopic Labeling Studies
| Item | Function/Application | Example Use Case |
|---|---|---|
| [1,6-13C]Glucose | A common tracer for glycolytic and pentose phosphate pathway flux. | Tracing carbon fate in cell cultures and in vivo models [15]. |
| d5-Tryptamine | Deuterated precursor for alkaloid biosynthesis studies. | Elucidating the monoterpene indole alkaloid pathway in plants at single-cell resolution [20]. |
| 15N-Ethanolamine | Chemoselective tag for carboxyl-group containing metabolites. | Enabling sensitive detection and quantification of >100 carboxylic acids in biofluids via 2D NMR [16]. |
| DSS (4,4-dimethyl-4-silapentane-1-sulfonic acid) | Internal reference standard for NMR chemical shift and quantitation. | Referencing and quantifying metabolites in 1H NMR experiments [15]. |
| DMT-MM Coupling Reagent | Activates carboxyl groups for amide bond formation with amines. | Facilitating the conjugation of 15N-ethanolamine to metabolites [16]. |
| Hyperpolarized [1-13C]Pyruvate | A super-polarized metabolic probe for real-time in vivo spectroscopy. | Monitoring real-time metabolic fluxes to lactate, alanine, and bicarbonate in cancer imaging [17]. |
Comparative Performance Data and Applications
Case Study: Single-Cell Metabolic Tracing
A groundbreaking 2025 study directly compared the capabilities of MS and isotopic labeling at the single-cell level [20]. Researchers used d5-tryptamine and single-cell MS (scMS) to track the synthesis of monoterpene indole alkaloids in individual plant cell protoplasts. They successfully detected and temporally resolved the formation of deuterated intermediates like d4-strictosidine, d4-ajmalicine, and d4-catharanthine. This study highlights MS's superior sensitivity and spatial resolution, capable of detecting metabolites at estimated limits of quantification of 0.02–0.1 nM in single cells, thereby revealing cell-type-specific metabolic routing and transport that would be averaged out in bulk tissue analysis [20].
Case Study: In Vivo Metabolic Imaging
The development of hyperpolarized 13C technology showcases a unique strength of NMR. In preclinical models of prostate cancer, intravenous injection of hyperpolarized [1-13C]pyruvate enabled real-time monitoring of its conversion to lactate via 13C MRSI. This conversion, reflecting the upregulated glycolysis in cancer (the Warburg effect), was mapped with high spatial resolution (0.135 cm³) in 10 seconds. This application demonstrates NMR's unique capacity for non-invasive, dynamic monitoring of metabolic fluxes in living organisms, providing functional information that complements anatomical imaging [17].
Case Study: Food Authentication
A 2025 study in Food Chemistry provided a direct, ground-breaking comparison of a targeted isotopic method (MS-based) versus an untargeted chemical fingerprinting method (GC-MS-based) for authenticating virgin olive oil origin [23]. The MS-based method measured bulk δ13C, δ18O, and δ2H stable isotope ratios, achieving a 75% classification accuracy for Italian vs. non-Italian oils. In contrast, the untargeted sesquiterpene fingerprinting method significantly outperformed isotopic ratios, achieving over 90% accuracy and proving more sensitive to differences between closely located Italian regions [23]. This case illustrates how the choice of analytical method and data processing approach can dramatically impact the outcome of a study.
In the field of analytical chemistry, particularly in research involving isotopic labeling for metabolism, drug development, and systems biochemistry, two powerful techniques stand out: Mass Spectrometry (MS) and Nuclear Magnetic Resonance (NMR) spectroscopy. The data they produce—chromatograms from MS and resonance spectra from NMR—serve as fundamental windows into molecular identity, structure, and dynamics. For researchers investigating complex biological systems using stable isotope tracers, understanding the nature, strengths, and limitations of these data outputs is crucial for experimental design and data interpretation. This guide provides an objective comparison of these outputs, framed within the context of isotopic labeling measurement techniques.
Fundamental Data Outputs: A Direct Comparison
The core data outputs of MS and NMR are fundamentally different in nature and information content. The table below summarizes their key characteristics.
Table 1: Core Characteristics of Chromatograms (MS) and Resonance Spectra (NMR)
| Feature | Chromatograms (MS) | Resonance Spectra (NMR) |
|---|---|---|
| Primary Data Type | Ion abundance vs. retention time & mass-to-charge ratio (m/z) | Signal intensity vs. chemical shift (ppm) |
| Key Readouts | Retention time (Rt), m/z values, signal intensity | Chemical shift (δ), signal splitting (J-coupling), signal intensity |
| Information Provided | Molecular mass, fragment patterns, quantity | Molecular structure, atomic environment, dynamics, quantity |
| Isotope Detection | Distinguishes isotopologues (mass difference) | Identifies positional isotopomers (chemical shift) |
| Quantitation | Can require internal standards; linear range can be wide | inherently quantitative; signal area proportional to nucleus count [24] |
| Sensitivity | High (pico- to femtomolar) [25] [24] | Low (micromolar to millimolar) [25] [24] |
The following diagram illustrates the fundamental difference in how a simple molecule, like labeled ethanol, is traced and identified through each technique's data output.
Performance Comparison in Isotopic Labeling Studies
The choice between MS and NMR often hinges on the specific requirements of the isotopic labeling experiment. The two techniques offer complementary performance profiles.
Table 2: Performance Comparison for Isotopic Labeling Measurement [25] [26] [24]
| Parameter | Mass Spectrometry (MS) | NMR Spectroscopy |
|---|---|---|
| Sensitivity | High | Low |
| Reproducibility | Average | Very High |
| Number of Detectable Metabolites | 300 - 1000+ | 30 - 100 |
| Sample Preparation | Complex (extraction, derivatization) | Minimal |
| Isotope Detection Strength | Isotopologue detection and quantification (number of tracer atoms) | Positional Isotopomer identification (location of tracer atoms) |
| Throughput | Moderate to High (depends on chromatography) | Fast (single measurement, no separation) |
| Instrument Cost & Size | Lower cost, smaller footprint | More expensive, requires significant space |
A key application of both techniques is Stable Isotope-Resolved Metabolomics (SIRM), where a biological system is fed an isotopically enriched precursor (e.g., 13C-glucose), and its fate through metabolic pathways is tracked [26]. In this context:
- MS excels at providing high-sensitivity data on the number of labeled atoms in a pool of metabolites (isotopologue distribution) across hundreds of compounds.
- NMR is unparalleled in determining the exact position of the labeled atoms within the molecular structure (positional isotopomer) without the need for chemical degradation, offering a direct view into metabolic pathway fluxes [26] [27].
Experimental Protocols for Isotopic Labeling
MS-Based Protocol Using Liquid Chromatography-MS (LC-MS)
This protocol is typical for tracking isotopic incorporation in metabolomics studies [26] [28].
- Cell/Tissue Treatment: Incubate cells (e.g., cancer cell lines) or tissue samples in a medium containing a stable isotope tracer (e.g., [U-13C]-glucose or [U-13C,15N]-glutamine) for a defined period.
- Metabolite Extraction: Quench metabolism rapidly (e.g., using liquid nitrogen). Extract metabolites using a solvent system like cold methanol/acetonitrile/water.
- Sample Preparation: Centrifuge to remove protein debris. Dry the supernatant under a nitrogen stream and reconstitute in a solvent compatible with the LC mobile phase. Derivatization may be required for some metabolite classes (e.g., for GC-MS).
- LC-MS Analysis:
- Chromatographic Separation: Inject the sample onto a reverse-phase UHPLC column. Elute metabolites using a gradient of water and acetonitrile, often with modifiers like formic acid.
- Mass Spectrometry: The eluent is ionized (e.g., by Electrospray Ionization - ESI) and analyzed by a high-resolution mass spectrometer (e.g., Q-TOF or Orbitrap).
- Data Processing: Use software to align chromatograms, pick peaks, and identify metabolites based on retention time and accurate mass. Isotopologue distributions are calculated from the integrated peak areas for each m/z signal corresponding to the unlabeled and labeled forms of the metabolite.
NMR-Based Protocol for Metabolic Flux Analysis
This protocol describes a common workflow for using NMR in SIRM studies [29] [26].
- Isotope Labeling and Extraction: Treat biological samples with a stable isotope tracer as in the MS protocol. Perform metabolite extraction similarly, often without the need for derivatization.
- Sample Preparation for NMR: Reconstitute the dried extract in a deuterated buffer (e.g., D2O with a phosphate buffer). Transfer the solution to a standard NMR tube.
- NMR Spectroscopy Acquisition:
- Place the sample in a high-field NMR spectrometer (e.g., a 600 MHz Bruker Avance Neo, as used in a recent MS metabolomics study [29]).
- Acquire a 1D 1H NMR spectrum using a standard pulse sequence with water suppression.
- For detailed isotopic analysis, acquire 2D experiments such as 1H-13C Heteronuclear Single Quantum Coherence (HSQC) or Heteronuclear Multiple Bond Correlation (HMBC). These experiments correlate proton and carbon chemical shifts, helping to assign the 13C label to specific atomic positions.
- Data Processing and Analysis: Process the Free Induction Decay (FID) by applying Fourier transformation, phase, and baseline correction. Metabolites are identified and quantified by comparing their chemical shifts to reference databases. The 13C labeling pattern is determined by analyzing the multiplet structures in 1H-13C HSQC spectra or the presence of 13C-13C J-couplings in 1D 1H NMR spectra.
The workflow below visualizes the parallel and complementary nature of these protocols in a SIRM study.
The Scientist's Toolkit: Key Reagent Solutions
Successful isotopic labeling studies rely on specific, high-quality reagents and materials. The following table details essential items for such research.
Table 3: Essential Research Reagents and Materials for Isotopic Labeling Studies
| Item Name | Function/Brief Explanation |
|---|---|
| Stable Isotope-Labeled Precursors(e.g., [U-13C]-Glucose, [U-13C,15N]-Glutamine) | Core reagents for tracing metabolic fate. They are incorporated into downstream metabolites, allowing the mapping of biochemical pathways [26]. |
| Deuterated Solvents(e.g., D2O, CD3OD) | Essential for NMR spectroscopy to provide a lock signal for field frequency stabilization and to avoid overwhelming the solvent signal in 1H NMR [28]. |
| Metabolite Extraction Solvents(e.g., Methanol, Acetonitrile) | Used to rapidly quench metabolic activity and extract a broad range of polar and semi-polar metabolites from biological samples for both MS and NMR analysis [26] [28]. |
| LC-MS Grade Mobile Phase Additives(e.g., Formic Acid, Ammonium Acetate) | Enhance ionization efficiency in MS and help control chromatographic separation (e.g., by modulating pH) in reverse-phase LC, improving peak shape and detection [28]. |
| NMR Reference Standards(e.g., TMS, DSS) | Added to NMR samples to provide a known chemical shift reference point (0 ppm) for accurate metabolite identification and quantification [27]. |
| Chemical Shift and Metabolite Databases(e.g., HMDB, BMRB) | Computational tools containing reference 1H and 13C NMR chemical shifts and MS fragmentation patterns of known metabolites, crucial for compound identification [29] [28]. |
Chromatograms from MS and resonance spectra from NMR provide distinct yet highly complementary data for researchers using isotopic labeling techniques. MS offers superior sensitivity and the ability to profile hundreds of metabolites, providing excellent data on the amount of isotopic incorporation. NMR, with its lower sensitivity, provides unparalleled structural detail and direct information on the position of isotopic labels within molecules, without the need for extensive sample preparation or separation. The most robust SIRM studies, therefore, often leverage both techniques in a cross-validating and synergistic manner [26] [28]. The choice between them—or the decision to use both—depends on the specific research question, the required depth of isotopic information, and the available resources.
Strategic Applications: Choosing Between MS and NMR for Your Research Goal
Metabolic Flux Analysis (MFA) has long provided crucial insights into the dynamic functioning of biochemical networks by quantifying metabolite flow through pathways. However, traditional bulk MFA approaches mask critical cellular heterogeneity, a limitation particularly problematic in complex tissues and diseases like cancer where metabolic variation significantly impacts treatment outcomes [30] [31]. The emerging frontier of single-cell MFA represents a paradigm shift, enabling researchers to dissect metabolic heterogeneity and reveal previously obscured cellular behaviors. This comparison guide objectively evaluates the cutting-edge technologies redefining this field, focusing on their capabilities, limitations, and appropriate applications for researchers and drug development professionals.
Each method approaches the fundamental challenge of single-cell flux quantification differently: some employ sophisticated instrumentation to physically measure isotope incorporation in individual cells, while others leverage computational power to infer fluxes from genomic data. The choice between these approaches involves careful trade-offs between experimental directness, pathway coverage, technical accessibility, and biological resolution [32] [33] [30]. As we explore these technologies, we will examine their performance characteristics, data requirements, and validation standards to provide a comprehensive framework for selecting appropriate tools based on specific research objectives.
Technological Approaches for Single-Cell Flux Analysis
Experimental Measurement Techniques
Spatial Single-Cell Isotope Tracing technologies physically measure isotope incorporation in individual cells. The 13C-SpaceM method exemplifies this approach by extending spatially resolved mass spectrometry to detect 13C6-glucose-derived carbons in esterified fatty acids at single-cell resolution [30]. This technology integrates matrix-assisted laser desorption/ionization (MALDI) with all-ion fragmentation (AIF) and microscopy imaging, allowing correlation of metabolic activity with cellular phenotypes. In practice, cells or tissues are incubated with 13C-labeled nutrients (e.g., U-13C-glucose), followed by imaging MS and computational registration to assign metabolic data to individual cells. The method successfully revealed substantial heterogeneity in lipogenic acetyl-CoA pool labeling within tumors, demonstrating higher glucose-dependent synthesis of saturated fatty acids in cancer cells compared to healthy tissue [30].
FRET Nanosensors offer an alternative optical approach using genetically encoded biosensors. These sensors employ bacterial periplasmic binding proteins fused between cyan and yellow fluorescent proteins. Upon metabolite binding, conformational changes alter FRET efficiency, reporting metabolite concentration dynamics with subcellular resolution [32]. Although FRET sensors monitor only single compounds rather than comprehensive fluxes, they provide unparalleled temporal resolution for tracking rapid metabolic changes within living cells. The technical protocol involves transfection with sensor constructs, followed by live-cell fluorescence ratio imaging before and after environmental perturbations [32].
Computational Inference Methods
Machine Learning-Based Flux Prediction represents a complementary approach that bypasses experimental complexities. ML-Flux employs artificial neural networks trained on known isotope pattern-flux relationships to decipher complex labeling data and predict metabolic fluxes [33]. The framework uses variable-size isotope labeling patterns as input, imputes missing data via partial convolutional neural networks, and outputs mass-balanced fluxes. Validation shows ML-Flux computes fluxes more accurately and rapidly than traditional least-squares MFA software, with >90% accuracy in central carbon metabolism models [33]. Implementation requires feeding GC-MS or LC-MS isotopologue data into pre-trained models available through the metabolicflux.org platform.
Transcriptome-Based Flux Inference methods leverage gene expression data to estimate metabolic activity. scFEA (single-cell flux estimation analysis) utilizes a graph neural network model trained on human metabolic maps to infer cell-wise fluxomes from scRNA-seq data [31]. Similarly, METAFlux applies flux balance analysis to bulk and single-cell RNA sequencing data to characterize metabolic heterogeneity and interactions within the tumor microenvironment [34]. These approaches rest on the hypothesis that flux variations correlate nonlinearly with transcriptomic changes in catalyzing enzymes, minimizing total flux imbalance across all cells [31]. Experimental validation of scFEA using matched scRNA-seq and metabolomics data confirmed consistency between predicted fluxes and observed metabolite abundance variations [31].
Comparative Performance Analysis
Table 1: Technical Comparison of Single-Cell MFA Methods
| Method | Spatial Resolution | Pathway Coverage | Temporal Resolution | Sample Requirements | Key Limitations |
|---|---|---|---|---|---|
| 13C-SpaceM [30] | Single-cell (~μm) | Targeted (e.g., fatty acid synthesis) | End-point measurement | Fixed cells/tissues | Limited to metabolically stable fatty acids |
| FRET Nanosensors [32] | Subcellular | Single metabolites | Real-time (seconds) | Live cell culture | Monitors only one metabolite at a time |
| ML-Flux [33] | Bulk to single-cell* | Comprehensive (central carbon metabolism) | Steady-state | Isotope labeling data | Requires extensive training data |
| scFEA [31] | Single-cell | Genome-scale | Steady-state | scRNA-seq data | Indirect inference from transcriptomics |
Note: ML-Flux can incorporate single-cell data but is not inherently single-cell
Table 2: Application-Based Method Selection Guide
| Research Context | Recommended Method | Key Advantages | Experimental Workflow Complexity |
|---|---|---|---|
| Fatty Acid Metabolism Studies | 13C-SpaceM [30] | Direct measurement of lipid synthesis heterogeneity | High (requires specialized MS expertise) |
| Dynamic Metabolic Tracking | FRET Nanosensors [32] | Real-time subcellular monitoring | Medium (genetic encoding required) |
| High-Throughput Flux Screening | ML-Flux [33] | Rapid, accurate computation for central metabolism | Low (uses standard LC/GC-MS data) |
| Integration with Transcriptomics | scFEA/METAFlux [34] [31] | Correlates gene expression with metabolic activity | Low-medium (requires scRNA-seq data) |
Experimental Protocols for Key Methodologies
13C-SpaceM Protocol for Spatial Single-Cell Flux Analysis
The 13C-SpaceM method enables quantification of de novo fatty acid synthesis heterogeneity through the following detailed workflow [30]:
Cell Culture and Labeling:
- Culture cells in standard conditions, then introduce U-13C-glucose tracer for sufficient time to reach isotopic steady-state (typically 72 hours for fatty acids)
- For heterogeneous models, co-culture differentially treated cells (e.g., normoxic GFPneg with hypoxic GFPpos cells) in equal proportions
- Fix cells using appropriate preservation methods compatible with MS imaging
Sample Preparation and Imaging:
- Apply matrix for MALDI imaging to prepared samples
- Perform MALDI-AIF MS in negative ion mode with mass range 600-1000 m/z for lipids and 100-400 m/z for fatty acid fragments
- Acquire microscopy images (brightfield and fluorescence) for cell segmentation
- Register MS images with microscopy data using reference points
Data Processing and Analysis:
- Correct for natural isotope abundance using standard algorithms
- Assign MS pixels to individual cells based on segmentation
- Quantify isotopologue distributions (M+0, M+1, M+2, etc.) for fatty acids in each cell
- Calculate normalized M+0 intensity as indicator of glucose-derived synthesis
- Correlate metabolic heterogeneity with cellular phenotypes using GFP intensity or other markers
Validation studies achieved 87% classification accuracy in distinguishing hypoxic from normoxic cells based solely on palmitate isotopologue profiles, confirming the method's robustness [30].
ML-Flux Protocol for Computational Flux Estimation
ML-Flux provides a machine learning framework for flux quantification from isotope labeling patterns [33]:
Data Preparation:
- Acquire isotope labeling patterns through 13C-glucose, 2H-glucose, or 13C-glutamine tracing experiments
- Measure mass isotopomer distributions (MIDs) using GC-MS or LC-MS
- Format MIDs as input vectors, flagging missing values for imputation
Flux Prediction:
- Input MIDs into pre-trained neural network models specific to metabolic network (e.g., central carbon metabolism)
- Apply partial convolutional neural networks to impute missing isotope patterns
- Generate flux predictions through forward propagation in artificial neural networks
- Calculate remaining fluxes using null space basis of the metabolic model
Validation and Quality Control:
- Compare model-predicted MIDs with experimental measurements
- Assess flux prediction accuracy using reserved testing data
- Check statistical acceptability with reduced chi-squared test (R² values typically 0.9-1 for validated predictions)
- Report standard errors for individual flux predictions based on error distributions in test data
The ML-Flux online resource (metabolicflux.org) democratizes implementation, requiring only isotopologue data input without custom model building [33].
Research Reagent Solutions
Table 3: Essential Research Reagents for Single-Cell MFA
| Reagent Category | Specific Examples | Function & Application |
|---|---|---|
| Isotope Tracers | U-13C-glucose, 13C-glutamine, 13C15N-glutamine [35] | Metabolic pathway tracing with stable isotopes |
| FRET Nanosensors | FLIPglu, FLIPmal, FLIPrib [32] | Live-cell metabolite concentration monitoring |
| MS Matrix Compounds | α-cyano-4-hydroxycinnamic acid [30] | Enables MALDI ionization for spatial metabolomics |
| Computational Tools | SIMPEL R package [35] | Automated processing of HRMS isotopologue data |
| Cell Labeling Reagents | GFP constructs [30] | Cell identification in heterogeneous co-cultures |
Integrated Data Analysis Workflows
SIMPEL for HRMS Data Processing The Stable Isotope-assisted Metabolomics for Pathway ELucidation (SIMPEL) platform addresses critical bottlenecks in processing high-resolution mass spectrometry data from dual-isotope labeling experiments [35]. This R package automates post-processing of isotope-enriched metabolomics datasets by:
- Enumerating isotopologues for given chemical formulas through precise m/z tolerances
- Identifying isotopologues from libraries of chemical formulae and retention times
- Calculating isotopologue distributions and average labeling per compound
- Correcting for natural abundance using IsoCorrectoR
- Enabling global analyses (PCA, clustering) of compounds based on label enrichment
Application of SIMPEL to 13C15N-glutamine labeling in Arabidopsis roots demonstrated improved flux resolution and reduced confidence intervals for active metabolite pool estimates compared to single-isotope approaches [35].
Dual-Isotope Labeling Advantages Combining multiple heavy isotopes (e.g., 13C and 15N) in a single experiment provides several analytical advantages [35]:
- Enables distinction between active metabolite pools and inactive/unlabeled pools
- Provides additional constraints for flux estimation, improving precision
- Allows resolution of bifurcated pathways through element-specific tracing
- Reduces the number of separate experiments required for comprehensive network analysis
Decision Framework for Single-Cell MFA Method Selection
The evolving landscape of single-cell metabolic flux analysis offers researchers diverse technological paths for investigating metabolic heterogeneity. Experimental approaches like 13C-SpaceM provide direct spatial measurement capabilities but require specialized instrumentation, while computational methods like ML-Flux and scFEA offer accessibility and integration with multi-omics data at the cost of direct measurement [33] [30] [31]. The optimal choice depends critically on research priorities: spatial context, pathway coverage, temporal dynamics, and sample availability.
Future methodology development will likely focus on integrating experimental and computational approaches, enhancing spatial resolution, expanding pathway coverage, and improving temporal dynamics. Technologies like SIMPEL that leverage dual-isotope labeling with HRMS demonstrate how innovative data extraction can maximize information from single experiments [35]. As these tools mature, single-cell flux analysis will increasingly illuminate metabolic heterogeneity in cancer, developmental biology, and therapeutic development, providing unprecedented insights into cellular physiology and disease mechanisms.
In structural biology, determining the three-dimensional structures of proteins and their complex interactions is fundamental to understanding cellular mechanisms and advancing drug discovery. For many sophisticated techniques, particularly Nuclear Magnetic Resonance (NMR) spectroscopy and Mass Spectrometry (MS), this task requires the incorporation of stable isotopes into proteins. These non-radioactive isotopes, such as ²H (Deuterium), ¹³C, and ¹⁵N, serve as sensitive probes that provide atomic-level resolution data without altering the chemical or biological properties of the molecule [36] [37]. This guide objectively compares the two primary analytical platforms—NMR and MS—used to interpret data from isotopic labeling experiments, detailing their respective capabilities, optimal applications, and performance metrics to inform research and development strategies.
The selection between uniform and selective labeling strategies is a critical first step in experimental design. Uniform labeling, where all atoms of a specific element in a protein are replaced with an NMR-active isotope (e.g., uniform ¹³C, ¹⁵N), is the standard starting point for structural studies [12] [38]. Conversely, selective labeling incorporates isotopes only at specific sites or amino acid types, which dramatically simplifies NMR spectra for larger proteins or for studying specific functional regions, such as active sites or binding interfaces [14] [38]. Another powerful approach is segmental labeling, which allows for the isotopic labeling of a specific protein domain rather than the entire molecule. This is particularly valuable for analyzing multi-domain proteins or specific post-translational modifications [37]. The choice of strategy directly impacts the complexity of the data and the type of structural information that can be obtained.
Comparison of Measurement Techniques: MS vs. NMR
Isotopic labeling provides a bridge to atomic-level structural data, but the platform used to detect these labels defines the nature and scope of the information obtained. NMR spectroscopy and Mass Spectrometry offer complementary strengths, making them suitable for different research questions.
Nuclear Magnetic Resonance (NMR) Spectroscopy excels at providing detailed information on the local chemical environment, three-dimensional structure, and real-time dynamics of proteins in solution. A key advantage is its ability to distinguish between different isotopomers—molecules that are labeled with isotopes in identical positions [26] [39]. For instance, NMR can determine the specific carbon atom within a glutamate side chain that is ¹³C-labeled, providing direct evidence of the metabolic pathway that produced it. This makes it indispensable for tracking the fate of individual atoms from a labeled precursor through metabolic transformations, an approach known as Stable Isotope-Resolved Metabolomics (SIRM) [26] [39]. Furthermore, NMR's unique isotope-editing capabilities can filter complex mixtures to display only signals from atoms connected to an NMR-active nucleus like ¹³C or ³¹P, leading to significant spectral simplification [26] [39].
Mass Spectrometry (MS), in contrast, is unparalleled in its sensitivity for detecting mass changes and is highly effective at identifying and quantifying different isotopologues—molecules that differ in the total number of tracer atoms, regardless of their position [26] [40]. This capability is central to techniques like Stable Isotope Labeling by Amino acids in Cell culture (SILAC) for quantitative proteomics and Metabolic Flux Analysis (MFA) [11]. MS requires much smaller sample quantities than NMR and is easily integrated with separation techniques like liquid chromatography (LC), making it ideal for high-throughput profiling. However, while MS can determine that a metabolite has gained two ¹³C atoms, it typically cannot distinguish which specific carbons are labeled without additional fragmentation experiments (MS/MS) [26] [40].
Table 1: Core Technical Capabilities of NMR and MS
| Feature | Nuclear Magnetic Resonance (NMR) | Mass Spectrometry (MS) |
|---|---|---|
| Primary Information | 3D Structure, Atomic Environment, Dynamics, Isotopomers | Mass, Identity, Quantity, Isotopologues |
| Isotope Detection | Direct (¹³C, ¹⁵N) & indirect via ¹H | Mass shift (e.g., ¹³C vs. ¹²C) |
| Key Strength | Positional isotope analysis; Study of intact complexes | High sensitivity; High throughput |
| Sample Requirement | ~0.1-1 mg, high purity [39] | Nanogram to microgram, can be complex mixtures |
| Throughput | Lower (minutes to hours per sample) | High (minutes per sample with LC) |
Table 2: Performance in Key Structural Biology Applications
| Application | NMR Performance & Role | MS Performance & Role |
|---|---|---|
| Protein Structure Determination | High (for proteins < ~50 kDa); Provides atomic-resolution structures and dynamics in solution. | Low for 3D structure; High for identifying cross-linked peptides to constrain structural models. |
| Protein-Ligand Interaction Studies | High; Can pinpoint binding site and conformational changes via chemical shift perturbations. | Medium; Can detect binding via hydrogen-deuterium exchange (HDX) or native MS. |
| Metabolic Pathway Tracing (SIRM) | High; Uniquely identifies positional isotopomers for detailed pathway mapping. [26] [39] | High; Excellent for quantifying isotopologue abundances and flux modeling. [26] [40] |
| Analysis of Post-Translational Modifications (PTMs) | High with selective labeling; Can determine site-specific structural and dynamic effects of PTMs. [37] | High; Excellent for identifying and mapping PTM sites proteome-wide. |
The following workflow diagrams illustrate the typical experimental processes for structural studies using NMR and interaction studies using MS.
NMR Protein Structure Determination Workflow
MS-Based Protein Interaction Workflow
Experimental Protocols for Key Techniques
Site-Specific Isotopic Labeling in Mammalian Cells
Studying proteins that require mammalian expression systems for proper folding and post-translational modifications has been challenging due to the high cost of isotope-labeled amino acids. A recent protocol provides a cost-effective alternative by leveraging endogenous transaminase enzymes to convert labeled α-ketoacid precursors into the corresponding amino acids [14].
Detailed Protocol:
- Medium Preparation: Prepare a custom culture medium (e.g., based on DMEM) that excludes the specific amino acid targeted for labeling (e.g., tyrosine, phenylalanine, leucine) [14].
- Precursor Supplementation: Supplement the medium with the cognate α-ketoacid precursor (e.g., p-hydroxyphenylpyruvate for tyrosine) at a 1:2 molar ratio relative to the standard amino acid concentration. The precursor is synthesized with ¹³C at the desired positions [14].
- Cell Transfection and Expression: Transfect HEK293T cells with the plasmid encoding the target protein using polyethylenimine (PEI) as a transfection reagent. Culture the cells in the custom medium for 48 hours at 37°C with 5% CO₂ [14].
- Validation and Analysis: Harvest the cells and prepare NMR samples. As demonstrated for proteins like carbonic anhydrase II (CA II), this method yields sufficient protein for fast 2D ¹H,¹³C NMR spectra, enabling the study of conformational changes upon ligand binding in cell lysates or even in intact cells [14].
Stable Isotope-Resolved Metabolomics (SIRM) for Pathway Tracing
SIRM is a powerful approach to map the flow of atoms from labeled precursors through metabolic networks, which is crucial for understanding disease mechanisms like cancer [26] [39].
Detailed Protocol:
- Tracer Administration: Incubate cells, tissues, or model organisms with an isotope-enriched precursor. Common tracers include [U-¹³C]-glucose to track glycolysis and Krebs cycle activity, or [U-¹³C,¹⁵N]-glutamine to probe glutaminolysis [26].
- Sample Extraction: At designated time points, extract metabolites using a solvent system like methanol:acetonitrile:water (2:2:1 v/v) to quench metabolism and preserve the labeling patterns.
- Parallel Analysis by NMR and MS:
- NMR Analysis: Redissolve the extract in a buffered D₂O solution. Acquire ¹H-¹³C 2D TOCSY or HSQC spectra. The ¹³C satellite peaks in the TOCSY spectrum reveal the site-specific enrichment (isotopomers), allowing researchers to distinguish between different metabolic pathways [26] [39].
- MS Analysis: Analyze the same extract via LC-MS. Use high-resolution mass spectrometry to detect the mass shifts corresponding to the number of incorporated heavy atoms (isotopologues). Software tools are then used to quantify the relative abundance of each isotopologue for flux modeling [26] [40].
- Data Integration: Combine the positional information from NMR with the high-sensitivity quantification from MS to build a comprehensive, atom-resolved metabolic fate map [26].
Research Reagent Solutions
The following table details essential reagents and materials required for conducting isotopic labeling experiments in structural and chemical biology.
Table 3: Essential Research Reagents for Isotopic Labeling
| Reagent/Material | Function & Application |
|---|---|
| ¹³C-Glucose | A universally used labeled carbon source for metabolic flux analysis (MFA) and for producing uniformly ¹³C-labeled proteins in bacterial expression systems [26] [12]. |
| ¹⁵N-Ammonium Salts | A primary nitrogen source for achieving uniform ¹⁵N-labeling of proteins for backbone NMR assignment [12] [11]. |
| Deuterated Water (D₂O) | Used for solvent contrast variation in SAS studies, for buffering NMR samples to avoid strong water signals, and for in vivo labeling of lipids via ²H₂O ingestion [26] [37]. |
| Selective Labeling Kits (e.g., for Methyl groups) | Kits containing precursors like ¹³C-α-ketoisovalerate for specific labeling of Ile, Leu, Val methyl groups in a deuterated background, crucial for NMR studies of large proteins [12] [14]. |
| SILAC Kits (e.g., ¹³C₆-Arg, ¹³C₆-Lys) | Contain heavy isotope-labeled essential amino acids for quantitative proteomics using Stable Isotope Labeling by Amino acids in Cell culture (SILAC) in mammalian cells [11]. |
| Isotope-Labeled Amino Acids | Used for residue-specific labeling in proteins expressed in any host system, including mammalian cells, or for reverse labeling (unlabeling) to simplify NMR spectra [14] [38]. |
| α-Ketoacid Precursors | Cost-effective precursors for selective isotope labeling of specific amino acid side chains in mammalian expression systems, as an alternative to expensive labeled amino acids [14]. |
Concluding Synthesis
The choice between MS and NMR for analyzing isotopically labeled samples is not a matter of which technique is superior, but rather which is best suited to the specific biological question. The following diagram summarizes the decision-making logic for selecting the appropriate technique.
Technique Selection Logic
For research focused on determining the high-resolution 3D structure and internal dynamics of proteins under 50 kDa, or for characterizing protein-ligand interactions with atomic precision, NMR spectroscopy is the definitive tool, especially when combined with selective labeling strategies [37] [38]. Conversely, when the objective is system-wide profiling, such as mapping metabolic fluxes with high sensitivity or conducting quantitative proteomics on complex samples, Mass Spectrometry is the more powerful and efficient platform [26] [40] [11].
The most robust and informative structural biology studies often leverage the complementary strengths of both NMR and MS. An integrated approach, where MS provides high-throughput identification and quantification of interactions and modifications, and NMR validates these findings and provides detailed mechanistic insights into structure and dynamics, represents the gold standard. As labeling strategies continue to evolve, particularly for challenging targets like membrane proteins and multi-protein complexes, this synergistic use of NMR and MS will be paramount in driving discoveries in basic research and drug development.
In the field of quantitative proteomics, isotopic labeling techniques coupled with mass spectrometry (MS) have become indispensable tools for accurately measuring protein abundance and dynamics. Among the most prominent methods are Stable Isotope Labeling by Amino acids in Cell culture (SILAC), Tandem Mass Tags (TMT), and Isobaric Tags for Relative and Absolute Quantitation (iTRAQ). These techniques enable researchers to perform multiplexed relative and absolute quantification of proteins across different biological states, providing crucial insights into cellular signaling pathways, disease mechanisms, and drug responses. This guide provides a detailed, evidence-based comparison of these three foundational technologies, focusing on their performance characteristics, experimental protocols, and applications within modern proteomics research, particularly in comparison to other structural biology techniques like NMR spectroscopy.
Technical Comparison of SILAC, TMT, and iTRAQ
The following table provides a systematic comparison of the three major quantitative proteomics techniques, highlighting their key characteristics, performance metrics, and ideal use cases.
| Feature | SILAC | iTRAQ | TMT |
|---|---|---|---|
| Labeling Type | Metabolic incorporation [41] | Chemical (isobaric tags) [41] | Chemical (isobaric tags) [41] |
| Labeling Stage | In vivo, during cell culture [41] | In vitro, post-digestion [41] | In vitro, post-digestion [41] |
| Multiplexing Capacity | Typically 2-3 (up to 5 with newer labels) [41] | 4-8 plex [41] [42] | 6-16 plex [41] [42] |
| Quantification Basis | MS1 precursor intensity [41] [43] | MS2/MS3 reporter ions [41] [44] | MS2/MS3 reporter ions [41] [43] |
| Sample Compatibility | Limited to cell cultures and model organisms (SILAM) [41] [42] | Broad (cells, tissues, biofluids) [41] | Broad (cells, tissues, biofluids) [41] |
| Key Advantage | High accuracy; no chemical modification [41] [42] | Comprehensive proteome coverage; PTM analysis [41] | Highest multiplexing; robust quantification [41] |
| Key Limitation | Not suitable for tissue/fluid samples [42] | Ratio compression [41] [44] | Ratio compression; high cost [41] [42] |
| Best For | Dynamic processes in cell cultures (e.g., protein turnover) [41] | Large-scale studies & post-translational modifications [41] | High-throughput screening of multiple conditions [41] |
Experimental Protocols and Workflow
SILAC (Stable Isotope Labeling by Amino acids in Cell culture)
The SILAC methodology relies on the metabolic incorporation of stable isotope-labeled "heavy" amino acids (e.g., lysine and/or arginine) into the entire proteome of growing cells [41].
Detailed Protocol:
- Cell Culture: Two or more cell populations are cultured in parallel in media that are identical except for the form of specific essential amino acids. The "light" medium contains normal amino acids, while the "heavy" medium contains isotope-labeled analogs (e.g., (^{13}C6), (^{15}N4)) [41].
- Incorporation: Cells are passaged for several generations (typically 5-7) to ensure complete ((>)97%) incorporation of the labeled amino acids into all newly synthesized proteins [41].
- Sample Mixing: After treatment, cells from different conditions are harvested, and protein extracts are combined in equal ratios. This mixing at the beginning of sample processing minimizes technical variability [41].
- Standard Proteomics Processing: The mixed protein sample is digested with trypsin. The resulting peptides are then analyzed by LC-MS/MS [41].
- Data Analysis: Quantification is achieved by comparing the MS1 precursor ion intensities of the paired "light" and "heavy" peptides, which appear as distinct peaks in the mass spectrum separated by a predictable mass difference [41] [43].
iTRAQ/TMT (Isobaric Chemical Labeling)
iTRAQ and TMT share a nearly identical workflow, relying on isobaric chemical tags that covalently bind to peptide amines post-digestion [41] [44].
Detailed Protocol:
- Individual Sample Processing: Proteins from each experimental condition (e.g., control vs. treated tissues) are extracted and digested individually into peptides [41].
- Chemical Labeling: The peptides from each sample are labeled with a different isobaric tag from the iTRAQ (4-8 plex) or TMT (6-16 plex) reagent set. These tags have the same total mass, ensuring that a given peptide from any sample appears at the same m/z in MS1 scans [41] [44].
- Sample Pooling: All labeled peptide samples are combined into a single mixture for simultaneous analysis [41].
- LC-MS/MS Analysis: The pooled sample is analyzed by LC-MS/MS. During tandem MS (MS2), the isobaric tags fragment to produce low-mass reporter ions (e.g., 114-117 Da for iTRAQ 4-plex). The relative intensities of these reporter ions in the MS2 spectrum reflect the relative abundance of the peptide in each original sample [41] [44].
- Ratio Compression: A key challenge is "ratio compression," where the quantitative accuracy is reduced due to co-isolation and co-fragmentation of near-isobaric peptides in the precursor selection window. This can be mitigated with MS3 methods [41] [44].
Performance Benchmarking and Experimental Data
Independent large-scale benchmarking studies provide critical empirical data for comparing the performance of these techniques. A systematic study comparing SILAC, dimethyl labeling (similar to MS1-based quantification), and TMT revealed several key findings [43]:
- Depth of Coverage: All three methods (SILAC, dimethyl, TMT) reached a similar depth in the number of proteins identified when using a standard MS2-based shotgun approach [43].
- Quantification Accuracy: A major differentiator is quantification accuracy. TMT quantification using only MS2 was "heavily affected by co-isolation leading to compromised precision and accuracy" [43]. This ratio compression effect can dampen observed ratios toward unity, potentially underestimating true fold-changes [41] [44].
- MS3 Mitigation: The ratio compression issue with TMT can be partly resolved using an MS3-based acquisition method, but this comes at the cost of a "significant reduction in the number of proteins quantified" [43].
- SILAC vs. Chemical MS1 Quantification: The study noted that "SILAC and chemical labeling with MS-based quantification produce almost indistinguishable results," indicating that the choice between metabolic and chemical MS1-based methods may be less critical than the choice between MS1- and MS2/MS3-based quantification [43].
A direct comparison between iTRAQ and mTRAQ (a non-isobaric label) in the context of EGFR signaling in HeLa cells demonstrated that iTRAQ labeling "quantified nearly threefold more phosphopeptides (12,129 versus 4,448) and nearly twofold more proteins (2,699 versus 1,597) than mTRAQ labeling" [44]. This highlights a key advantage of isobaric tags: the additive effect on precursor intensities when samples are multiplexed increases sensitivity and depth. However, the same study confirmed that "accuracy of reporter ion quantification by iTRAQ is adversely affected by peptides that are co-fragmented," validating the ratio compression phenomenon [44].
The Scientist's Toolkit: Essential Research Reagents
Successful implementation of these quantitative proteomics techniques requires specific reagents and materials. The following table outlines the core components of a researcher's toolkit.
| Tool/Reagent | Function | Application Notes |
|---|---|---|
| SILAC Media Kits | Provides "light" and "heavy" amino acid-containing media for metabolic labeling. | Essential for SILAC; requires careful validation of complete incorporation [41]. |
| iTRAQ 4-plex/8-plex or TMT 10-plex/16-plex Kits | Chemical tagging reagents for multiplexed sample labeling. | Core of iTRAQ/TMT workflows; a major cost driver [41] [42]. |
| Trypsin/Lys-C | Protease for digesting proteins into peptides for MS analysis. | Critical for sample preparation in all bottom-up proteomics workflows [45]. |
| High-pH Reversed-Phase Chromatography | For peptide fractionation to reduce sample complexity. | Increases proteome coverage prior to LC-MS/MS [44]. |
| High-Resolution Mass Spectrometer | Instrument for peptide separation, identification, and quantification. | Orbitrap-based instruments are the current gold standard for high-resolution data [46]. |
| Proteomics Software Suite | For database searching, protein identification, and quantification. | Platforms like FragPipe, MaxQuant, and Spectronaut are widely used [45]. |
SILAC, iTRAQ, and TMT each offer distinct advantages for quantifying protein abundance. The choice of method is not a matter of which is universally superior, but which is most appropriate for the specific biological question, sample type, and available resources. SILAC excels in accuracy for cell culture studies and is free from chemical labeling artifacts. iTRAQ and TMT provide powerful multiplexing capabilities for complex sample types and large-scale studies, with TMT currently leading in multiplexing capacity. The pervasive challenge of ratio compression in isobaric tag methods remains a critical consideration for accurate quantification, though advanced MS3 methods and correction algorithms can help mitigate this issue. As the field advances, the integration of these quantitative data with structural techniques like NMR and cryo-EM, as well as AI-driven models, will continue to enhance our systems-level understanding of protein function in health and disease.
In the fields of analytical chemistry and systems biology, two fundamental research paradigms exist: hypothesis-driven (targeted) and discovery-based (untargeted) approaches. The distinction between these strategies is foundational to scientific inquiry, influencing experimental design, technology selection, and data interpretation. This guide objectively compares these methodologies within the context of isotopic labeling measurement techniques, specifically mass spectrometry (MS) and nuclear magnetic resonance (NMR) spectroscopy, providing researchers with a framework for selecting appropriate strategies for their scientific objectives.
The philosophical difference between these approaches can be illustrated by a scientific "murder mystery." In a discovery-based approach, akin to Sherlock Holmes collecting all possible clues at a crime scene, a researcher gathers comprehensive data without a predetermined theory. In contrast, a hypothesis-driven approach is similar to suspecting "Colonel Mustard in the dining room with the candlestick" and then seeking specific evidence to prove or disprove this specific theory [47]. Both approaches are valid and often integrated in modern research workflows.
Conceptual Foundations
Discovery-Based (Untargeted) Studies
Definition and Goal: Untargeted studies aim to comprehensively and agnostically profile all measurable analytes in a sample to discover novel patterns, biomarkers, or hypotheses without a priori assumptions [48] [49]. This approach is particularly valuable when exploring complex biological systems with incomplete existing knowledge.
Key Characteristics:
- Broad Scope: Seeks to capture the entire complement of metabolites, proteins, or other analytes.
- Hypothesis-Generating: The outcome is typically the identification of significant differences or patterns that form new research hypotheses.
- Data-Rich: Produces large, complex datasets requiring sophisticated multivariate statistical analysis.
Hypothesis-Driven (Targeted) Studies
Definition and Goal: Targeted studies focus on precise measurement of a predefined set of analytes to test a specific biological hypothesis [49]. This approach validates or refutes explicit mechanistic questions about system behavior.
Key Characteristics:
- Focused Scope: Measures specific compounds, pathways, or structural features based on prior knowledge.
- Hypothesis-Testing: Designed to provide definitive answers to specific research questions.
- Quantitative Rigor: Emphasizes precision, accuracy, and sensitivity for the target analytes.
The conceptual relationship and typical workflow for these approaches are fundamentally different, as illustrated below:
Comparative Analysis of Technical Approaches
Methodological Implementation in MS and NMR
The selection between MS and NMR platforms is crucial for both targeted and untargeted studies, as each offers complementary strengths and limitations [48].
Mass Spectrometry Platforms:
- Untargeted MS: Typically uses high-resolution instruments (Orbitrap, FT-ICR) coupled with chromatography (LC-MS, GC-MS) for broad metabolite detection. Common workflows include full-scan mode data acquisition with subsequent annotation using spectral libraries [50] [48].
- Targeted MS: Employs specific detection modes like Multiple Reaction Monitoring (MRM) on triple quadrupole instruments for precise quantification of predefined compounds with high sensitivity and dynamic range [51].
NMR Spectroscopy Platforms:
- Untargeted NMR: Utilizes standard 1D 1H NMR with presaturation for water suppression, providing reproducible metabolic fingerprints suitable for multivariate statistical analysis [48].
- Targeted NMR: Implements quantitative NMR (qNMR) with inverse-gated decoupling and longitudinal relaxation time (T1) measurements for absolute concentration determination of specific metabolites [52] [53].
Quantitative Comparison of MS and NMR Capabilities
Table 1: Technical Comparison of NMR and MS for Isotopic Analysis
| Parameter | NMR | Mass Spectrometry |
|---|---|---|
| Sensitivity | Low (μM-mM) | High (pM-nM) |
| Quantitation | Absolute without standards | Requires internal standards |
| Structural Information | Excellent (3D structure, stereochemistry) | Limited (molecular weight, fragments) |
| Reproducibility | High (<2% variation) | Moderate (5-20% variation) |
| Sample Throughput | Moderate (minutes-hours) | High (minutes) |
| Sample Destruction | Non-destructive | Destructive |
| Isotope Detection | Position-specific (PSIA) | Global (bulk) composition |
| Dynamic Range | Limited (~10³) | Extensive (~10⁵-10⁶) |
| Key Isotopic Applications | irm-2H NMR, irm-13C NMR, SNIF-NMR | SILAC, NeuCode, TMT, ICAT, 18O labeling |
Performance Metrics for Targeted and Untargeted Studies
Table 2: Performance Comparison of Targeted vs. Untargeted Approaches
| Performance Metric | Targeted Approach | Untargeted Approach |
|---|---|---|
| Number of Analytes | Limited (1-100) | Extensive (100-10,000+) |
| Quantitative Accuracy | High (often >90%) | Variable (70-90%) |
| Hypothesis Flexibility | Low (fixed targets) | High (data mining) |
| Statistical Power | High (multiple testing minimal) | Moderate (requires FDR correction) |
| Discovery Potential | Low | High |
| Standardization | Well-established | Evolving |
| Analysis Time | Shorter | Longer |
| Cost Per Sample | Generally lower | Generally higher |
| Technical Expertise Required | Specialized | Broad + bioinformatics |
Experimental Protocols and Workflows
Untargeted Metabolomics Workflow
Sample Preparation:
- Collection: Use sterile techniques with appropriate containers, collecting at consistent times to minimize variability [50].
- Quenching: Rapid metabolism quenching via flash freezing in liquid N2 or chilled methanol (-20°C to -80°C) [50].
- Extraction: Employ biphasic liquid-liquid extraction (e.g., methanol-chloroform-water) for comprehensive metabolite coverage [50].
- Internal Standards: Add stable isotope-labeled standards prior to extraction to monitor technical variability [50].
Data Acquisition:
- NMR Parameters: 1D 1H NMR with NOESYGPPR1D presaturation for water suppression [48]. Typical acquisition: 64 scans, 4s relaxation delay, 600-800 MHz instruments [48].
- MS Parameters: Full scan MS1 with data-dependent MS/MS acquisition on high-resolution instruments. Chromatographic separation with C18 columns (typically 1.7μm, 100mm length) using water-acetonitrile gradients [50].
Data Analysis:
- Preprocessing: Spectral alignment, normalization, and scaling [48].
- Multivariate Statistics: Principal Component Analysis (PCA) for exploratory analysis, Partial Least Squares-Discriminant Analysis (PLS-DA) for classification [48].
- Metabolite Identification: Database matching using HMDB, MassBank, NMR libraries with statistical FDR control [48].
Targeted Protein Interaction Analysis
Affinity Purification Mass Spectrometry (AP-MS) Protocol:
- Cell Lysis: Use mild, non-denaturing conditions (e.g., 0.5% NP-40, 150mM NaCl) to preserve protein complexes [49].
- Bait Capture: Incubate with antibody-conjugated beads specific for tagged or endogenous bait protein [49].
- Wash: Stringent washing (e.g., 3-5 washes with lysis buffer) to reduce non-specific binders [49].
- Elution: Low pH or competitive elution (e.g., FLAG peptide) [49].
- Digestion: In-solution or on-bead tryptic digestion (37°C, 12-16 hours) [49].
- MS Analysis: LC-MS/MS with targeted inclusion lists or data-independent acquisition [49].
Quantitative NMR for Isotopic Analysis (irm-NMR):
- Sample Preparation: Precise weighing (250mg for vanillin analysis) in deuterated solvent [53].
- Acquisition Parameters: Inverse-gated 1H decoupling to suppress NOE, sufficient relaxation delay (>5×T1) [53].
- Calibration: Use certified isotopic standards for quantitative calibration [53].
- Data Processing: Precise integration with baseline correction, referencing to internal standard [53].
The following diagram illustrates the integrated workflow combining both approaches:
The Scientist's Toolkit: Essential Research Reagents and Materials
Table 3: Key Research Reagent Solutions for Isotopic Labeling Studies
| Reagent/Material | Function | Application Context |
|---|---|---|
| SILAC Amino Acids (Lysine/Arginine) | Metabolic labeling for quantitative proteomics | MS-based protein quantification [51] |
| Deuterated Solvents (D₂O, CD₃OD) | NMR solvent with minimal background interference | All NMR-based analyses [53] |
| Isobaric Tags (TMT, iTRAQ) | Multiplexed sample labeling for MS | Quantitative proteomics [51] |
| Stable Isotope Standards (¹³C, ¹⁵N, ²H) | Internal standards for quantification | Both MS and NMR quantification [50] |
| Trypsin/Lys-C | Proteolytic digestion enzymes | Bottom-up MS proteomics [51] |
| Affinity Resins (Streptavidin, Antibody) | Target enrichment | AP-MS, pull-down assays [49] |
| Deuterated Tracers (d5-tryptamine) | Metabolic pathway tracing | Flux analysis [20] |
| qNMR Standards (DSS, TSP) | Chemical shift and quantitation reference | Quantitative NMR [53] |
| Chromatography Columns (C18, HILIC) | Compound separation | LC-MS analyses [50] |
| Cryoprobes | Sensitivity enhancement for NMR | Low-concentration metabolite detection [48] |
Integrated Applications in Pharmaceutical Research
Case Study: NMR Structure Elucidation in Drug Development
A mid-sized pharmaceutical company utilized a targeted approach to resolve stereochemical integrity issues with a novel antihypertensive small molecule. ResolveMass Laboratories employed 2D-NMR techniques (COSY, HSQC, HMBC) and chiral NMR to identify a stereochemical inversion at the 4th carbon. This hypothesis-driven investigation resulted in a 30% reduction in development time and successful IND application [52].
Case Study: Single-Cell MS for Metabolic Pathway Tracing
A discovery-based approach using single-cell mass spectrometry (scMS) tracked the incorporation of d5-tryptamine into monoterpene indole alkaloids in Catharanthus roseus at single-cell resolution. This untargeted screening revealed unexpected intercellular transport of strictosidine, with approximately 85% of analyzed cells containing the labeled compound despite only 30% containing its immediate precursor [20]. This discovery generated new hypotheses about metabolite transport in plant systems.
Data Fusion Strategies for Enhanced Metabolomics
Integrative approaches combining NMR and MS data are increasingly employed through data fusion strategies [54]:
- Low-Level Fusion: Direct concatenation of pre-processed NMR and MS data matrices
- Mid-Level Fusion: Integration of extracted features from both platforms after dimensionality reduction
- High-Level Fusion: Combination of model outputs from separate NMR and MS analyses
These integrated approaches leverage the complementary strengths of both platforms—NMR's quantitative reproducibility and structural elucidation capabilities with MS's high sensitivity and broad metabolite coverage [48] [54].
Targeted, hypothesis-driven and untargeted, discovery-based approaches represent complementary rather than competing research paradigms. The selection between these strategies depends on research goals, existing knowledge, and analytical resources. Hypothesis-driven approaches provide precise, quantitative answers to specific biological questions, while discovery-based approaches enable novel insights and hypothesis generation in exploratory research.
For isotopic labeling studies, MS offers superior sensitivity and throughput for global isotope detection, while NMR provides unparalleled position-specific isotopic analysis and structural information. The emerging trend of integrating both technological platforms through data fusion strategies represents a powerful approach for comprehensive metabolic understanding, particularly in pharmaceutical development and systems biology research.
Modern experimental design often benefits from an iterative approach, beginning with discovery-based profiling to identify significant patterns, followed by targeted validation to confirm mechanistic hypotheses. This integrated methodology maximizes both the breadth of investigative scope and the rigor of scientific conclusion.
Integral membrane proteins (IMPs) are fundamental to cellular life, governing crucial processes such as signal transduction, molecular transport, and intercellular communication [12]. Despite constituting an estimated 30% of all proteins in most organisms, their structural and functional characterization lags significantly behind that of soluble proteins, with only a small fraction of high-resolution structures determined [12]. This disparity stems from inherent challenges: IMPs require lipid environments for proper folding and function, are difficult to express and purify in large quantities, and often exhibit complex dynamics that complicate analysis [12] [55]. Specific labeling strategies have therefore become indispensable tools, enabling researchers to overcome these hurdles by providing a means to track, probe, and visualize IMPs within native-like contexts.
The core challenge in membrane protein labeling lies in achieving specific, efficient, and functional incorporation of labels without disrupting the protein's delicate structure or function. Traditional methods often involve harsh detergents that can strip away essential lipids, obscure labeling sites, or lead to protein denaturation [56] [55]. This review provides a comparative analysis of the two primary analytical techniques—Mass Spectrometry (MS) and Nuclear Magnetic Resonance (NMR) spectroscopy—used in conjunction with these labeling strategies, offering a guide for researchers to select the optimal approach for their specific study of membrane proteins.
Isotopic Labeling Strategies for MS and NMR
Isotopic labeling is a foundational technique for simplifying the complex spectra of membrane proteins and enabling detailed structural and dynamic studies. The main isotopes routinely used are ²H (deuterium), ¹³C, and ¹⁵N, which can be incorporated into proteins through various methods [12] [57].
Uniform vs. Selective Labeling
Isotopic labeling schemes are broadly categorized into two approaches:
- Uniform Labeling: The protein is produced with the isotope (e.g., ¹³C or ¹⁵N) incorporated at all positions of a specific element. This is ideal for comprehensive structural analysis, as it provides a full set of observable nuclei for NMR or a distinct mass shift for MS [12].
- Selective Labeling: The isotope is incorporated only at specific sites, such as particular amino acid types or even individual atoms within an amino acid. This strategy dramatically simplifies NMR spectra or MS readouts and is particularly useful for studying specific protein regions or dynamics [12].
Methods for Introducing Isotopic Labels
The method of isotopic incorporation is chosen based on the protein system, the desired labeling pattern, and the expression platform.
Table 1: Methods for Isotopic Labeling of Proteins
| Method | Description | Primary Applications | Key Advantages | Common Labels |
|---|---|---|---|---|
| Metabolic Labeling | Cells are cultured in media containing isotopically labeled nutrients (e.g., amino acids, ¹⁵N-ammonium salts) [51]. | SILAC (MS); Protein production for NMR [51]. | Labels at earliest stage; high consistency; suitable for living cells. | ¹³C, ¹⁵N, ²H |
| Chemical Labeling | Isotope-coded tags are chemically attached to specific functional groups on purified proteins or peptides (e.g., amines, thiols) [51]. | ICAT, TMT, DiMethyl labeling (MS) [51]. | Broad applicability to various samples (cells, tissues, fluids). | ¹³C, ¹⁵N, ²H |
| Enzymatic Labeling | Incorporation of isotopes using enzymes, such as proteolytic digestion in ¹⁸O-labeled water [51]. | ¹⁸O labeling for C-terminal carboxyl groups in peptides (MS) [51]. | High specificity for defined sites. | ¹⁸O |
For membrane proteins, the choice of expression system—including bacteria, yeasts, and insect cells—is critical, as each has varying capabilities for incorporating labeled amino acids and for correctly folding complex IMPs [12].
Comparative Analysis: Mass Spectrometry vs. NMR Spectroscopy
The choice between MS and NMR for analyzing labeled membrane proteins depends heavily on the research question, as each technique offers distinct strengths and faces unique limitations.
Technical Comparison
Table 2: Head-to-Head Comparison of MS and NMR for Labeled Membrane Protein Studies
| Feature | Mass Spectrometry (MS) | Nuclear Magnetic Resonance (NMR) |
|---|---|---|
| Detection Principle | Mass-to-charge ratio (m/z) of ions [51] [55]. | Nuclear spin transitions in a magnetic field [57]. |
| Primary Isotopes Detected | ¹³C, ¹⁵N, ¹⁸O, ²H (via mass shift) [51]. | ¹H, ¹³C, ¹⁵N, ³¹P (directly via spin) [12] [57]. |
| Key Strength | Extremely high sensitivity; identifies post-translational modifications (PTMs); measures large complexes directly [55]. | Probes atomic-level structure and real-time dynamics in solution; no ionization artifacts [12]. |
| Major Limitation | Requires ionization, which can disrupt non-covalent interactions; data can be complex to deconvolute for mixtures [51] [55]. | Inherently low sensitivity; requires large amounts of protein (~mg); upper size limit for solution-state [12]. |
| Sample Throughput | Relatively high, especially with modern multiplexed labeling (e.g., TMT) [51]. | Low to moderate; experiment time can be long. |
| Quantitation | Excellent, via precursor ion intensity or reporter ions in multiplexed designs [51]. | Good, based on signal intensity or volume, but can be affected by relaxation. |
| Membrane Mimetic Compatibility | Challenging; requires careful detergent selection for "native MS" [55]. | Broadly compatible with micelles, bicelles, nanodiscs, and liposomes [12]. |
Quantitative Analysis and Multiplexing
A significant area of advancement for MS has been in multiplex isotope labeling, which allows for the simultaneous comparison of multiple samples in a single experiment, enhancing accuracy and throughput [51].
- Precursor Ion-Based Quantification: This method uses a mass difference (typically >4 Da) introduced at the peptide precursor level to distinguish samples. Techniques include SILAC (metabolic), dimethyl labeling (chemical), and ¹⁸O labeling (enzymatic). Quantitation is achieved by comparing the peak areas of the light and heavy precursor ions in the MS1 spectrum [51].
- Reporter Ion-Based Quantification (Isobaric Tagging): In methods like TMT, peptides from different samples are labeled with isobaric tags that have the same total mass but fragment to produce unique, low-mass reporter ions in MS2 spectra. The relative intensities of these reporter ions provide quantitative data [51].
- Mass Defect-Based Quantification: A novel approach that uses tiny, resolvable mass differences (e.g., 6 mDa) introduced by strategic combination of isotopes (e.g., ¹³C vs. ²H). These are distinguishable only in high-resolution instruments but allow for multiplexing without increasing MS1 spectral complexity [51].
In contrast, NMR quantification often relies on measuring signal intensities or volumes in spectra of proteins that are uniformly or selectively labeled with ¹³C and/or ¹⁵N. It is particularly powerful for metabolic flux analysis, where the flow of labeled atoms through metabolic pathways can be traced by analyzing isotopomer distributions [57].
Experimental Protocols for Specific Labeling
Site-Specific Fluorescent Labeling via Nanodisc-Embedded Cysteines
Fluorescent labeling is crucial for studying membrane protein dynamics and interactions. A major hurdle is the inaccessibility of surface-exposed cysteine residues when proteins are solubilized in detergent micelles [56]. The following protocol, utilizing polymer-encapsulated nanodiscs, overcomes this limitation by preserving a native-like lipid environment.
Detailed Protocol [56]:
- Membrane Protein Extraction and Reconstitution: Extract the target membrane protein (e.g., KvAP potassium channel or HpUreI urea channel) from cell membranes using the non-aromatic copolymer Glyco-DIBMA. This polymer forms nanodiscs that encapsulate the protein within a native-like lipid bilayer, avoiding detergents entirely.
- Immobilization: Incubate the nanodisc solution with cobalt-based affinity beads. The His-tag on the protein binds to the beads, immobilizing the entire protein-nanodisc complex.
- Reduction and Labeling:
- Wash the column with a buffer containing a reducing agent like TCEP (200-500 µM) to ensure cysteine thiol groups are in a reduced state and accessible.
- Add the fluorescent dye (e.g., Alexa Fluor 647 maleimide) directly to the column. The maleimide group specifically reacts with the reduced cysteine thiol to form a stable thioether bond.
- Incubate at room temperature for 1 hour.
- Purification: Wash the column to remove excess, unreacted dye. Elute the specifically labeled membrane protein, still within its protective nanodisc, using an elution buffer containing imidazole.
This method successfully labeled proteins like KvAP and HpUreI, for which previous detergent-based labeling attempts had failed, demonstrating its efficacy for challenging targets [56].
Pan-Membrane Protein Labeling with NHS-Ester Dyes
For visualizing global membrane topology and dynamics in live cells, a rapid, non-specific labeling approach is beneficial.
Detailed Protocol [58]:
- Cell Preparation: Culture live mammalian cells (e.g., DC2.4 dendritic cells) in suspension.
- Labeling Reaction: Incubate the cells with N-hydroxysuccinimide (NHS)-ester-activated dyes (e.g., Alexa Fluor 488 or 647 NHS-ester) for 5 minutes. The NHS-ester group reacts efficiently with primary amines (ε-amino group of lysine residues and N-termini) on extracellular membrane proteins, forming stable amide bonds.
- Quenching and Washing: Remove excess dye by washing the cells with a suitable buffer. The covalent nature of the bond means the label remains stable for extended live-cell imaging.
- Imaging: The high-density labeling achieved allows for visualization of fine membrane structures, such as tunneling nanotubes, and dynamic processes like protein redistribution during cell-cell contacts using techniques like TIRF microscopy [58].
Essential Research Reagents and Solutions
Successful labeling and analysis of membrane proteins rely on a toolkit of specialized reagents designed to maintain protein stability and enable specific detection.
Table 3: Key Reagents for Membrane Protein Labeling and Analysis
| Reagent / Tool | Function | Application Context |
|---|---|---|
| Glyco-DIBMA Polymer | A detergent-free alternative for extracting membrane proteins directly into native nanodiscs, preserving lipid environment and label accessibility [56]. | Site-specific fluorescent labeling for biophysics and imaging. |
| NHS-Ester Dyes (e.g., Alexa Fluor 488/647) | Covalently label primary amines on membrane proteins for rapid, high-density staining of live cells [58]. | Pan-membrane labeling for live-cell imaging (e.g., TIRF, SIM). |
| Maleimide-Activated Dyes | Form stable thioether bonds with reduced cysteine residues for site-specific conjugation [56]. | Site-specific fluorescent labeling of purified proteins. |
| Isotope-Coded Affinity Tag (ICAT) | Chemical label with biotin and isotope tag; thiol-reactive for cysteine residues. Enriches and quantifies peptides [51]. | Quantitative proteomics by MS. |
| Tandem Mass Tag (TMT) | Isobaric chemical label for amine groups; fragments to yield sample-specific reporter ions for multiplexing [51]. | High-throughput quantitative proteomics by MS. |
| Amino Acids for SILAC | Stable isotope-labeled essential amino acids (e.g., ¹³C₆-Lysine) incorporated metabolically during cell culture [51]. | Metabolic labeling for quantitative MS. |
| Deuterated Detergents (e.g., d-DDM) | Solubilizes membrane proteins while minimizing background signals in ¹H-NMR spectra [12]. | Sample preparation for solution-state NMR. |
The intricate world of membrane proteins demands a diverse and sophisticated arsenal of labeling and analytical techniques. Both Mass Spectrometry and Nuclear Magnetic Resonance spectroscopy, when powered by strategic isotopic or fluorescent labeling, provide unparalleled insights into the structure, dynamics, and function of these vital cellular components. The choice between them is not a matter of superiority, but of strategic alignment with the research objective.
MS excels in sensitivity, high-throughput quantification, and the analysis of complex mixtures and post-translational modifications, especially when paired with multiplexed isotopic tags. NMR, conversely, offers a unique window into real-time, atomic-level dynamics and structural details within a native-like membrane environment. Overcoming the primary challenge of label accessibility is now being achieved through innovative methods like polymer-based nanodiscs, which preserve the native protein environment far better than traditional detergents. As these labeling strategies and analytical technologies continue to evolve in tandem, they promise to unravel the remaining mysteries of membrane proteins, accelerating fundamental discovery and drug development in the years to come.
Optimizing Workflows: Overcoming Technical Hurdles in MS and NMR
The accurate analysis of isotopic labeling relies fundamentally on two critical and sequential steps in sample preparation: the immediate quenching of cellular metabolism to capture a true metabolic snapshot, and the subsequent effective extraction of metabolites to ensure accurate measurement of label incorporation. Within the broader context of comparing Mass Spectrometry (MS) and Nuclear Magnetic Resonance (NMR) as measurement techniques, the choice of sample preparation protocol is paramount. MS often requires minimal sample handling and is exquisitely sensitive to mass shifts caused by isotope incorporation, whereas NMR, especially for position-specific isotope analysis, demands higher quantities of pure analyte and can be confounded by certain extraction solvents or impurities [53] [59]. This guide objectively compares the common methodologies for quenching and extraction, providing the experimental data and protocols necessary for researchers to select the optimal approach for their specific labeling studies, whether the final analysis is performed by MS or NMR.
Quenching Metabolism: A Critical Comparison
Quenching is the process of instantaneously halting all metabolic activity within cells at the precise moment of sampling. The ideal quenching method achieves this rapid inactivation without compromising cell membrane integrity, thereby preventing the leakage of intracellular metabolites and ensuring the analytical result reflects the in vivo state [60].
Comparison of Quenching Methods
The table below summarizes the performance of common quenching techniques based on key criteria for reliable metabolomic analysis.
Table 1: Performance Comparison of Common Cell Quenching Methods
| Quenching Method | Mechanism of Action | Effectiveness in Halting Metabolism | Cell Membrane Integrity | Risk of Metabolite Leakage | Best For |
|---|---|---|---|---|---|
| Cold Organic Solvent (e.g., 60% Methanol) | Rapid temperature drop and enzyme denaturation | High | Low; can damage membranes | High, especially with 100% methanol [60] | Bacterial cells; fast filtration protocols |
| Cold Isotonic Solution (e.g., 0.9% Saline) | Rapid temperature drop with osmotic stabilization | Moderate | High; maintains osmotic balance [60] | Low | Mammalian cells (suspension and adherent) [61] [60] |
| Liquid Nitrogen | Ultra-rapid freezing and vitrification | Very High | High when performed correctly | Low | All cell types; requires immediate processing |
Detailed Experimental Protocols
Protocol 1: Quenching of Adherent Mammalian Cells with Cold Isotonic Solution This method is recommended for its balance of effective metabolic arrest and preservation of membrane integrity [61] [60].
- Preparation: Pre-cool a quenching solution (e.g., 0.9% w/v sodium chloride in water) to below -20°C.
- Medium Removal: Aspirate and completely remove the culture medium from the adherent cells.
- Rinse: Rapidly rinse the cell layer with a small volume of ice-cold, isotonic saline (e.g., 0.9% NaCl) to remove extracellular metabolites that could contaminate the intracellular metabolome [60].
- Quenching: Immediately add the pre-cooled (-20°C) quenching solution to the cells.
- Harvesting: Scrape the cells using a sterile, pre-cooled spatula. Trypsinization is not recommended as it enhances membrane permeability and causes significant metabolite loss [60].
- Transfer: Transfer the cell suspension to a pre-cooled centrifuge tube for subsequent metabolite extraction.
Protocol 2: Quenching of Suspension Cultures with Cold Saline This method is effective for mammalian cells in suspension and involves a significant dilution of the extracellular medium [61].
- Sample Collection: Collect a known volume of cell suspension.
- Dilution & Quenching: Rapidly mix the sample with a large excess (e.g., 5-10 volumes) of ice-cold saline (0.9% NaCl). The large volume and cold temperature achieve rapid inactivation and dilution of extracellular metabolites.
- Centrifugation: Pellet the cells by centrifugation at low temperatures (4°C) for a short duration (e.g., 5 minutes). Note that cell recovery may be incomplete with short spins and should be determined reproducibly [61].
- Wash: Carefully remove the supernatant and wash the cell pellet with a fresh, cold washing solution to further reduce medium carryover.
The following workflow diagram illustrates the key decision points and steps for quenching different cell types.
Figure 1: A generalized workflow for quenching metabolism in adherent and suspension cell cultures.
Metabolite Extraction: Ensuring Complete Label Recovery
Following quenching, metabolites must be efficiently extracted from the cells. No single method extracts all metabolites equally, so the choice depends on the metabolite classes of interest and the downstream analytical technique [59] [60].
Comparison of Extraction Methods
The performance of common extraction solvents varies significantly, influencing the depth of metabolite coverage crucial for both MS and NMR analysis.
Table 2: Performance Comparison of Common Metabolite Extraction Methods
| Extraction Method | Mechanism | Metabolite Coverage | Compatibility with MS | Compatibility with NMR | Notes |
|---|---|---|---|---|---|
| Methanol/Water | Denaturation, polar dissolution | Broad range of polar metabolites | Excellent | Good (if volatile buffer is used) | Simple, widely used for polar metabolome |
| Acetonitrile/Water | Denaturation, less protein precipitation | Polar metabolites | Excellent | Good | Can yield cleaner extracts with less protein co-precipitation |
| Methanol/Chloroform/Water | Biphasic separation | Comprehensive (polar + lipids) [60] | Excellent | Requires solvent removal | Polar metabolites in upper aqueous phase, lipids in organic phase |
Detailed Extraction Protocol
Protocol: Comprehensive Metabolite Extraction Using Methanol/Chloroform/Water This biphasic method is recommended for its comprehensive coverage of both polar and non-polar metabolites [60].
- Lysis: Re-suspend the quenched cell pellet in a mixture of cold methanol and water (e.g., 5:3 ratio). The solution should be vigorously vortexed.
- Homogenization: Subject the suspension to mechanical homogenization or ultrasonic fragmentation to ensure maximum cell disruption. Repeated freeze-thaw cycles can also be used but may affect thermally labile metabolites [60].
- Solvent Addition: Add one volume of chloroform to the homogenate, vortex thoroughly, and then add one volume of water to induce phase separation.
- Centrifugation: Centrifuge the mixture to separate the phases. The upper aqueous phase will contain polar metabolites, the interphase will have proteins, and the lower organic phase will contain lipids.
- Collection: Carefully collect the aqueous and organic phases into separate tubes.
- Concentration: For MS or NMR analysis, the extracts can be concentrated using vacuum concentration or lyophilization (for the aqueous phase) to increase metabolite concentration for detection [60].
Verification of Label Incorporation: MS vs. NMR
The final step is verifying the success and pattern of isotopic label incorporation. Here, the fundamental differences between MS and NMR become highly relevant, influencing the entire experimental design from labeling strategy to sample preparation.
Technical Comparison for Isotope Analysis
Table 3: Comparison of MS and NMR for Analyzing Isotopic Labeling
| Feature | Mass Spectrometry (MS) | Nuclear Magnetic Resonance (NMR) |
|---|---|---|
| Principle | Measures mass-to-charge (m/z) ratio of ions [62] [57] | Detects nuclei with non-integer spin in a magnetic field [62] [57] |
| Primary Information | Global isotope composition (e.g., total ¹³C in a molecule); mass isotopomer distribution [53] [57] | Position-specific isotope composition (PSIA) [53] |
| Sensitivity | Very high (picomole to femtomole) | Low (milligrams of sample often required) [53] |
| Sample Preparation | Can analyze complex mixtures (with chromatography); minimal material needed. | Often requires pure compounds; solvents must be non-interfering. |
| Throughput | High | Relatively low |
| Key Application in Labeling | Metabolic Flux Analysis (MFA) via isotopomer quantification [57] [11] | Position-Specific Isotope Analysis (PSIA) to trace atom rearrangements [53] |
Underlying Mechanisms and Workflows
The diagram below contrasts the fundamental workflows for MS and NMR in isotopic label analysis, highlighting how the sample is processed to yield different types of isotopic information.
Figure 2: Core workflows for MS and NMR in isotopic analysis, showing the divergence in the type of isotopic information obtained.
NMR's unique capability for Position-Specific Isotope Analysis (PSIA) allows researchers to go beyond the bulk isotopic composition provided by MS. For example, irm-¹³C NMR can reveal counteractive normal and inverse isotope effects at different atomic positions within a molecule, even when the global isotope value (δ¹³Cg) shows no net change [53]. This is critical for elucidating detailed reaction mechanisms and metabolic pathways.
The Scientist's Toolkit: Essential Research Reagents
Successful experiments depend on the right tools. The table below lists key reagents and their functions in quenching, extraction, and label verification.
Table 4: Essential Reagents for Quenching, Extraction, and Isotope Verification
| Reagent/Solution | Function | Application Context |
|---|---|---|
| 60% Methanol (-40°C) | Quenching agent: rapidly cools and denatures enzymes. | Microorganism quenching [63]. |
| 0.9% Saline (-20°C) | Quenching agent: rapid cooling with osmotic stabilization. | Quenching mammalian cells while preserving membrane integrity [60]. |
| Methanol/Chloroform/Water | Biphasic extraction solvent. | Comprehensive extraction of polar (aqueous) and non-polar (lipids) metabolites [60]. |
| Deuterated Solvents (e.g., D₂O) | NMR solvent: provides a signal for field locking without adding ¹H background. | Essential for preparing samples for NMR analysis [53]. |
| ¹³C-labeled Glucose | Stable isotope tracer: introduces a detectable label into metabolic pathways. | Used in Metabolic Flux Analysis (MFA) to track carbon fate in central metabolism [57] [11]. |
| Fluorinated Aromatic Amino Acids (e.g., 4FF, 5FW) | Biosynthetic labels for proteins. | Incorporation into proteins for ¹⁹F NMR studies of structure, dynamics, and interactions [64]. |
| SILAC Media (e.g., with ¹³C₆-Arg) | Cell culture media containing stable isotope-labeled amino acids. | For quantitative proteomics by MS; allows mixing of samples from different conditions [11]. |
In the field of stable isotope-resolved metabolomics (SIRM), researchers rely heavily on two powerful analytical techniques: Nuclear Magnetic Resonance (NMR) spectroscopy and Mass Spectrometry (MS). These techniques are indispensable for tracing metabolic pathways, quantifying flux, and understanding system-wide biochemical transformations in biological systems. However, each method faces distinct spectral challenges that can compromise data quality, interpretation, and reproducibility if not properly addressed. NMR spectroscopy frequently encounters spectral congestion, where overlapping signals from complex mixtures complicate accurate metabolite identification and quantification. Meanwhile, MS-based approaches are plagued by ion suppression effects, where co-eluting matrix components interfere with analyte ionization, leading to reduced sensitivity and inaccurate quantification [26] [65].
Understanding these challenges is crucial for researchers, especially when selecting the appropriate technique for specific isotopic labeling experiments. This guide provides a comprehensive comparison of these fundamental analytical hurdles, presenting current methodologies for their detection, correction, and mitigation. By objectively examining the performance of NMR and MS in handling these issues, we aim to equip scientists with the knowledge to optimize their experimental designs, improve data quality, and make informed decisions about which technology best addresses their specific research needs in metabolic flux analysis and drug development.
Understanding NMR Spectral Congestion
Mechanisms and Impact on Data Interpretation
Spectral congestion in NMR spectroscopy refers to the overlapping resonance signals that occur when numerous metabolites in a complex mixture possess protons with similar chemical environments. This phenomenon is particularly problematic in biological samples such as cell extracts, biofluids, and tissue specimens, where thousands of compounds may coexist. The core issue stems from the limited chemical shift range of 1H NMR (typically 0-10 ppm), which must accommodate all hydrogen-containing compounds in the sample [66]. When multiple signals occupy the same spectral region, distinguishing individual metabolites becomes challenging, leading to potential misidentification, inaccurate quantification, and incomplete metabolic profiling.
The impact of spectral congestion extends beyond simple overlap. Complex multiplets arising from J-coupling can further complicate interpretation, while signal broadening in macromolecular systems can obscure detection of low-abundance metabolites. These limitations become particularly significant in stable isotope tracing experiments, where precise determination of positional isotopomer distributions is essential for mapping metabolic flux [26]. Without effective strategies to resolve congestion, researchers risk missing crucial metabolic information or drawing incorrect conclusions about pathway utilization.
Advanced NMR Techniques for Resolving Spectral Congestion
Contemporary NMR methodologies have evolved several powerful approaches to address spectral congestion, leveraging both hardware innovations and sophisticated pulse sequences:
Two-Dimensional NMR Techniques represent the gold standard for resolving overlapping signals. By spreading correlation information across a second frequency dimension, 2D NMR effectively disentangles complex mixtures that are inseparable in 1D spectra. Key 2D experiments include COSY (Correlation Spectroscopy) for detecting through-bond proton-proton couplings, HSQC (Heteronuclear Single Quantum Coherence) for establishing direct 1H-13C connectivity, and HMBC (Heteronuclear Multiple Bond Correlation) for revealing long-range 1H-13C correlations [52]. These techniques are particularly valuable in SIRM studies, where they enable precise tracking of stable isotope incorporation at specific atomic positions within metabolite structures.
Spectral Editing Methods provide targeted approaches for simplifying complex spectra. Recent innovations include relaxation editing using Long-Lived Coherences (LLC), which exploits differential relaxation properties to filter out unwanted signals [67]. The newly developed LLC-TOCSY (Total Correlation Spectroscopy) pulse sequence effectively suppresses high-intensity uncoupled peaks, thereby decluttering spectra and enhancing accuracy of peak assignments in complex mixtures [67]. Additionally, chemical-shift-difference selection techniques utilize chirp excitation to selectively record coupling correlation networks for protons with small frequency differences, proving particularly valuable for distinguishing diastereotopic methylene protons and resolving challenging structural motifs in furanose, pyranose, and benzene rings [66].
Computational Approaches offer complementary strategies for handling spectral complexity. Advanced algorithms now enable tree-based spectral representation that facilitates rapid similarity comparisons without requiring peak picking [68]. This method constructs hierarchical trees based on spectral mass centers, creating compact representations that scale linearly with peak numbers and allow efficient database searching despite variations in experimental conditions. Furthermore, NMR prediction software continues to evolve, with recent updates in commercial packages (e.g., NMR Predictors 2025) improving handling of exchangeable protons in deuterated solvents and enhancing display of 2D spectral projections [69].
Table 1: NMR Techniques for Addressing Spectral Congestion
| Technique Category | Specific Methods | Key Applications | Advantages |
|---|---|---|---|
| 2D NMR Experiments | HSQC, HMBC, COSY, TOCSY | Establishing connectivity networks, resolving overlapping peaks | High information content, unambiguous assignment |
| Spectral Editing | LLC-TOCSY, relaxation editing, chemical-shift-difference selection | Filtering specific signals, simplifying complex mixtures | Targeted analysis, reduced spectral complexity |
| Computational Approaches | Tree-based representation, peak deconvolution, database matching | Spectral comparison, metabolite identification | Rapid processing, handles large datasets |
NMR Spectral Congestion Resolution Pathways
Understanding MS Ion Suppression
Fundamental Mechanisms and Analytical Consequences
Ion suppression represents a critical matrix effect in mass spectrometry that directly impacts ionization efficiency and consequently, detector response for target analytes. This phenomenon occurs when co-eluting compounds interfere with the ionization process of analytes of interest in the MS source, leading to reduced signal intensity and compromised analytical performance [65] [70]. The fundamental mechanism differs between the two primary ionization techniques: Electrospray Ionization (ESI) and Atmospheric-Pressure Chemical Ionization (APCI).
In ESI, ion suppression primarily stems from competitive ionization processes. ESI operates with a limited amount of excess charge available on electrospray droplets. When high concentrations of matrix components with superior surface activity or gas-phase basicity are present, they effectively outcompete target analytes for this limited charge, suppressing ionization efficiency [65] [70]. Additional factors include increased droplet viscosity and surface tension from interfering compounds, which reduces solvent evaporation efficiency, and the presence of non-volatile materials that can co-precipitate with analytes or prevent droplets from reaching the critical radius required for ion emission [65].
In contrast, APCI typically experiences less severe ion suppression because neutral analytes are transferred to the gas phase through thermal vaporization before chemical ionization occurs. However, suppression can still occur through changes in colligative properties during evaporation or when non-volatile components form solids that incorporate analytes [65] [70]. The practical consequences of ion suppression are substantial, including diminished detection capability, reduced analytical precision and accuracy, potential for false negatives, and in extreme cases, complete analyte signal obliteration.
Detection and Correction Strategies for Ion Suppression
Robust detection and correction methodologies are essential for maintaining data quality in MS-based metabolomics:
Detection Protocols for identifying ion suppression include the post-column infusion experiment, where a constant flow of analyte is introduced downstream of the chromatography column while a blank matrix extract is injected [65] [70]. The resulting chromatogram reveals regions of ion suppression as dips in the otherwise constant baseline. Alternatively, the post-extraction spike-in approach compares analyte response in neat solvent versus matrix extracts spiked after preparation, directly quantifying suppression magnitude [70].
Correction Methodologies have evolved significantly, with recent innovations providing comprehensive solutions. The IROA TruQuant Workflow represents a breakthrough approach that uses a stable isotope-labeled internal standard (IROA-IS) library coupled with specialized algorithms to measure and correct for ion suppression across all detected metabolites [71]. This method leverages a unique isotopolog ladder pattern that distinguishes true metabolites from artifacts and enables mathematical correction of suppression effects based on the parallel behavior of 12C and 13C isotopologs experiencing identical suppression [71]. Traditional alternatives include chromatographic optimization to separate suppressing compounds from analytes, sample preparation techniques (SPE, LLE) to remove interfering matrix components, and internal standardization with stable isotope-labeled analogs to normalize for variability [65] [70].
Table 2: MS Approaches for Managing Ion Suppression
| Approach Category | Specific Methods | Mechanism of Action | Effectiveness |
|---|---|---|---|
| Sample Preparation | SPE, LLE, Protein Precipitation | Removal of interfering matrix components | Variable (matrix-dependent) |
| Chromatographic | Modified separation, altered selectivity | Prevention of co-elution with interferents | High when resolution achieved |
| Internal Standards | Stable isotope-labeled analogs | Normalization of ionization variability | Excellent for targeted analytes |
| Advanced Workflows | IROA TruQuant, Dual MSTUS | Comprehensive correction across all metabolites | High (emerging gold standard) |
MS Ion Suppression Correction Pathways
Comparative Experimental Data and Performance Metrics
Quantitative Comparison of NMR and MS Performance Characteristics
Direct comparison of NMR and MS performance in handling their respective spectral challenges reveals complementary strengths and limitations. The following table summarizes key performance metrics based on experimental data from the cited literature:
Table 3: NMR vs. MS Performance in Handling Spectral Challenges
| Performance Characteristic | NMR | Mass Spectrometry |
|---|---|---|
| Inherent Challenge | Spectral congestion from signal overlap | Ion suppression from matrix effects |
| Typical Impact on Sensitivity | Moderate (obscured detection) | Severe (signal reduction up to >90%) [71] |
| Impact on Quantification | Position-dependent (congestion-related errors) | Concentration-dependent (suppression increases with analyte/matrix ratio) [70] |
| Positional Isotopomer Analysis | Excellent (direct structural determination) | Limited (requires fragmentation or high-resolution) [26] |
| Isotopologue Quantification | Limited (lower sensitivity) | Excellent (high sensitivity, multiplexing capability) [26] |
| Technique-Specific Solutions | 2D NMR, spectral editing, computational approaches | IROA, sample cleanup, chromatographic optimization |
| Effectiveness of Solutions | High (resolves most congestion issues) | Variable (matrix-dependent, 1-20% CV typical) [71] |
Experimental Protocols for Challenge Mitigation
NMR Spectral Decongestion Protocol: For resolving complex metabolite mixtures, implement a multidimensional NMR approach beginning with 1H NMR followed by 2D experiments including 1H-1H COSY for through-bond connectivity, 1H-13C HSQC for direct heteronuclear correlations, and 1H-13C HMBC for long-range couplings [52]. For severely congested regions, apply specialized pulse sequences such as LLC-TOCSY to exploit differential relaxation properties and filter unwanted signals [67]. Process data using tree-based algorithms that represent spectra hierarchically to enable rapid database matching and similarity comparisons without manual peak picking [68].
MS Ion Suppression Correction Protocol: For comprehensive ion suppression management, employ the IROA TruQuant Workflow incorporating these key steps: (1) Spike samples with IROA internal standard (IROA-IS) featuring known 13C labeling patterns; (2) Analyze samples alongside IROA long-term reference standard (IROA-LTRS); (3) Use ClusterFinder software to identify metabolites based on characteristic IROA isotopolog ladders; (4) Apply suppression correction algorithm: AUC-12Ccorrected = AUC-12C × (AUC-13Cexpected / AUC-13Cmeasured); (5) Implement Dual MSTUS normalization for final data refinement [71]. For targeted analyses, use stable isotope internal standards and optimize chromatography to achieve baseline separation of analytes from suppressing compounds.
Research Reagent Solutions for Isotopic Labeling Studies
Selecting appropriate reagents is crucial for designing effective SIRM experiments that minimize analytical artifacts. The following essential materials represent current standards in the field:
Table 4: Essential Research Reagents for Isotopic Labeling Studies
| Reagent Category | Specific Examples | Research Applications | Functional Role |
|---|---|---|---|
| 13C-Labeled Tracers | [U-13C]-glucose, [13C-3,4]-glucose, [U-13C]-glutamine | Probing glycolysis, Krebs cycle, glutaminolysis | Carbon backbone tracing for metabolic flux analysis [26] |
| 15N-Labeled Tracers | 15N-amino acids, [U-13C,15N]-glutamine | Nitrogen metabolism, transamination studies | Nitrogen atom tracking in amino/nucleic acid metabolism [26] |
| Multiplexed Tracers | [U-13C,15N]-glutamine, 2H3-serine + 13C-glucose | Parallel pathway analysis (mSIRM) | Simultaneous tracing of multiple elements/pathways [26] |
| IROA Reagents | IROA-IS, IROA-LTRS | Ion suppression correction in untargeted MS | Internal standards for quantification normalization [71] |
| Deuterated Solvents | D2O, CD3OD, DMSO-d6 | NMR sample preparation | Field frequency locking, minimizing solvent signals |
| NMR Reference Standards | TMS, DSS, TSP | Chemical shift calibration | Providing internal chemical shift reference |
The comparative analysis of NMR and MS spectral challenges reveals a landscape of complementary capabilities rather than direct competition. NMR spectroscopy excels in providing unambiguous structural information and positional isotopomer data crucial for mapping metabolic pathways, with spectral congestion manageable through advanced 2D techniques and computational approaches [26] [52]. Conversely, mass spectrometry offers superior sensitivity and multiplexing capability for isotopologue quantification, though it requires sophisticated correction methods like IROA to overcome substantial ion suppression effects that can exceed 90% signal reduction in complex matrices [71].
For researchers designing isotopic labeling experiments, the optimal approach often involves strategic integration of both technologies. NMR provides the structural validation and positional labeling information essential for pathway confirmation, while MS delivers the sensitivity and throughput necessary for comprehensive isotopologue distribution analysis across multiple metabolic nodes. The choice between techniques should be guided by specific research questions: NMR for detailed structural and positional labeling studies where concentration is not limiting, and MS for trace analysis, high-throughput screening, and cases requiring maximal sensitivity. Emerging methodologies that combine both approaches in coordinated experimental workflows represent the future of robust, reproducible metabolomics research, leveraging the complementary strengths of each technology while mitigating their respective limitations through cross-validation and data integration.
For researchers in drug development and systems biology, accurately measuring low-abundance analytes is a recurring challenge, particularly in stable isotope-resolved metabolomics (SIRM) studies that track nutrient utilization in diseases like cancer. The choice of analytical technique profoundly impacts the sensitivity, resolution, and type of isotopic information that can be acquired. This guide objectively compares the performance of Mass Spectrometry (MS) and Nuclear Magnetic Resonance (NMR) spectroscopy, two pivotal technologies for isotopic labeling measurement.
Performance Comparison: MS vs. NMR for Isotopic Analysis
The selection between MS and NMR involves critical trade-offs between sensitivity, the type of isotopic information obtained, and sample requirements. The table below summarizes the core performance characteristics of each technique.
Table 1: Comparative Analysis of MS and NMR for Isotopic Measurement of Low-Abundance Analytes
| Feature | Mass Spectrometry (MS) | Nuclear Magnetic Resonance (NMR) Spectroscopy |
|---|---|---|
| Fundamental Data | Global isotope composition (e.g., δ13Cg); identifies isotopologues (molecules differing in total number of tracer atoms) [26] [53]. | Position-specific isotope composition (PSIA); identifies positional isotopomers (location of tracer atoms within the molecule) [26] [53]. |
| Typical Sensitivity | High (picomolar to femtomolar levels) [72]. | Lower than MS; requires more sample or higher analyte concentration [72] [53]. |
| Key Strength | Superior sensitivity for detecting low-abundance species; high throughput [26] [72]. | Provides atomic-level positional information without needing chemical degradation; non-destructive [26] [53]. |
| Critical Limitation | Cannot directly distinguish the intramolecular position of a label without fragmentation or advanced ultra-high-resolution systems [26] [53]. | Inherently lower sensitivity; can require milligram quantities of sample for natural abundance isotopic studies [53]. |
| Sample Throughput | High-throughput capable; can be automated [26]. | Generally lower throughput; acquisition times from minutes to hours [72]. |
| Complementarity | Best for determining the number of labeled atoms in a metabolite (isotopologue distribution) [26]. | Best for determining the position of labeled atoms in a metabolite (isotopomer distribution) [26]. |
Experimental Protocols for Cross-Validated Analysis
Leveraging the complementary strengths of MS and NMR through a combined Stable Isotope-Resolved Metabolomics (SIRM) workflow provides the most rigorous data for tracking metabolic pathways. The following protocol outlines this integrated approach.
Protocol: Combined MS/NMR SIRM Workflow for Pathway Mapping
1. Experimental Design and Tracer Selection:
- Select stable isotope-enriched precursors relevant to the biological question. Common tracers include [U-13C]-glucose to probe glycolysis and the Krebs cycle, or [U-13C,15N]-glutamine for glutaminolysis [26].
- Expose biological systems (cells, tissues, or model organisms) to the chosen tracer for a defined period.
2. Sample Preparation:
- Extraction: Use optimized extraction buffers, often methanol/water/organic solvent mixtures, to quench metabolism and extract a wide range of metabolites. The inclusion of broad-spectrum protease inhibitors can help preserve labile metabolites and proteins [73] [74].
- Prefractionation (Optional): For complex samples like plasma, reduce dynamic range using methods like centrifugal ultrafiltration or organic solvent precipitation (e.g., acetonitrile) to deplete high-abundance proteins that can mask low-abundance metabolites [75].
3. Data Acquisition:
- NMR Analysis:
- Quantitative 13C NMR: Use an inverse-gated decoupling pulse sequence with a long relaxation delay (e.g., 30 seconds) to obtain quantitative spectra where signal areas are proportional to the number of 13C nuclei. For higher precision in isotopic ratio measurement (irm-13C NMR), software like
rnmrfit 2.0can be employed, which uses semi-global peak fitting for high precision (as low as 0.16% for 13C) [6]. - Spectral Editing: Apply techniques like 1H-31P HSQC to selectively detect only phosphorylated compounds (e.g., nucleotides, phosphosugars), simplifying the spectrum and enabling tracking of low-abundance metabolites in this class [26].
- Quantitative 13C NMR: Use an inverse-gated decoupling pulse sequence with a long relaxation delay (e.g., 30 seconds) to obtain quantitative spectra where signal areas are proportional to the number of 13C nuclei. For higher precision in isotopic ratio measurement (irm-13C NMR), software like
- MS Analysis:
- Employ high-resolution mass spectrometry (HRMS), such as Fourier Transform Mass Spectrometry (FTMS), to resolve and accurately identify isotopologues based on their mass-to-charge ratio (m/z). Ultra-high-resolution (UHR-FTMS) is required to distinguish molecules labeled with multiple different stable isotopes (e.g., 13C vs. 15N) [26].
- Use Liquid Chromatography (LC)-MS to separate metabolites prior to mass analysis, reducing ion suppression and improving sensitivity for low-abundance species.
4. Data Integration and Cross-Validation:
- Integrate datasets by comparing the isotopologue distributions from MS with the positional isotopomer information from NMR. This cross-validation, based on different physical principles, provides a robust and detailed map of metabolic fluxes and network activities [26].
The logical workflow for this integrated protocol is summarized in the diagram below.
Advancing NMR Sensitivity for Low-Abundance Detection
While NMR is inherently less sensitive than MS, several strategic and technical advancements can significantly enhance its performance for detecting low-abundance analytes.
Table 2: Strategic and Technical Enhancements for NMR Sensitivity
| Strategy | Description | Impact on Low-Abundance Analytes |
|---|---|---|
| Spectral Simplification | Uses techniques like pure shift methods to eliminate J-coupling splitting, or singlet state filtering to selectively observe specific coupled spin systems [72]. | Reduces spectral crowding, resolving signals of low-abundance metabolites that would otherwise be obscured [72]. |
| Hyperpolarization | Employs methods like Dynamic Nuclear Polarization (DNP) to transiently boost NMR signal intensity by several orders of magnitude [26] [72]. | Dramatically enhances sensitivity, enabling real-time tracking of metabolic kinetics and low-abundance metabolic intermediates in living systems [26] [72]. |
| Advanced Software & Processing | Utilizes high-precision fitting algorithms like rnmrfit 2.0, which uses semi-global fitting and automated peak selection. Optimizes processing parameters (line broadening, zero filling) [6]. |
Improves precision and trueness of quantification for resonance peak areas, leading to more reliable data from complex spectra [6]. |
| Cryogenic Probes | Uses probe technology that cools the detection electronics to reduce thermal noise [53]. | Improves the signal-to-noise ratio, allowing for the analysis of smaller sample quantities or lower concentration analytes [53]. |
The application of high-precision software like rnmrfit 2.0 represents a significant advancement. Its performance against commercial software is quantified below.
Table 3: Performance Benchmark of rnmrfit 2.0 vs. Commercial NMR Software [6]
| Software | Key Feature | Achievable Precision | Key Advantage |
|---|---|---|---|
| rnmrfit 2.0 | Semi-global peak fitting with automated peak selection. | 0.26% for 2H; 0.16% for 13C. | Superior precision and trueness; open-source and scalable [6]. |
| TopSpin | Commercial NMR software suite for data processing. | Lower precision than rnmrfit. | Industry standard with a wide array of features [6]. |
| MestReNova | Commercial software for NMR and MS data analysis. | Lower precision than rnmrfit. | User-friendly interface and powerful processing tools [6]. |
The workflow for utilizing this software in isotopic analysis is detailed below.
The Scientist's Toolkit: Essential Reagent Solutions
Successful isotopic analysis, particularly for low-abundance targets, relies on a suite of specialized reagents and materials.
Table 4: Essential Research Reagent Solutions for Isotopic Analysis
| Item | Function | Application Notes |
|---|---|---|
| Stable Isotope Tracers(e.g., [U-13C]-Glucose, [U-13C,15N]-Glutamine) | To introduce a detectable label into metabolic pathways, enabling tracking of nutrient fate [26]. | Available from specialized suppliers (e.g., Cambridge Isotope Laboratories). Choice of tracer defines the metabolic pathways that can be probed [26]. |
| Proteinase/Phosphatase Inhibitor Cocktails | To prevent proteolytic and post-translational modification degradation during sample preparation, preserving the native state of low-abundance proteins and metabolites [74]. | Critical for preparing cell and tissue lysates where endogenous enzymes remain active. Should be added to lysis buffers immediately before use [74]. |
| Optimized Lysis & Extraction Buffers | To efficiently extract a wide range of metabolites or proteins while maintaining stability. RIPA buffer is common for proteins; methanol/chloroform/water for metabolites [74]. | Buffer choice should be tailored to the target analyte's location and properties (e.g., hydrophobic membrane proteins require stronger detergents) [73] [74]. |
| Cryoprobes | An NMR hardware solution that increases sensitivity by cooling the detector coils and electronics, reducing thermal noise [53]. | Enables the analysis of smaller sample quantities or lower concentration analytes, directly benefiting low-abundance studies [53]. |
| High-Sensitivity Chemiluminescent Substrates(e.g., SuperSignal West Atto) | For Western blotting, these substrates provide ultra-sensitive detection of horseradish peroxidase (HRP), enabling detection down to the attogram level [73]. | Essential for detecting low-abundance proteins via immunoassays. Offers over 3x more sensitivity than conventional ECL substrates [73]. |
In the analysis of low-abundance analytes, MS and NMR are not mutually exclusive but are powerfully complementary. MS delivers unparalleled sensitivity for detecting global isotopologue distributions, while NMR provides unique atomic-resolution insight into positional isotopomers, crucial for elucidating complex metabolic pathways. The strategic integration of both techniques, augmented by ongoing advancements in sensitivity through hyperpolarization, spectral simplification, and high-precision data processing, provides a comprehensive and robust framework for pushing the boundaries of detection in isotopic labeling research.
Isotopic labeling is an indispensable technique in modern biochemical and metabolic research, enabling scientists to trace metabolic pathways, determine protein structures, and investigate cellular processes. The choice of labeling strategy profoundly influences the type and quality of data obtained from analytical instruments such as Nuclear Magnetic Resonance (NMR) spectrometers and Mass Spectrometers (MS). Within the context of comparing MS and NMR measurement techniques, each instrument capitalizes on different properties of isotopic labels—MS detects mass differences from isotopic incorporation, while NMR exploits the magnetic properties of nuclei such as ¹³C and ¹⁵N to provide atomic-resolution structural and dynamic information [26] [53]. This guide objectively compares the three principal labeling methodologies—uniform, selective, and reverse labeling—by detailing their protocols, applications, and performance characteristics, with supporting experimental data.
The fundamental distinction between these strategies lies in the pattern of isotope incorporation. Uniform labeling involves introducing isotopic labels (e.g., ¹³C, ¹⁵N) uniformly across all carbon and nitrogen positions in a molecule or system, providing a comprehensive but complex labeling pattern. Selective labeling entails incorporating isotopes into specific, predetermined amino acids or metabolites against an otherwise unlabeled background, simplifying spectral analysis for specific targets. In contrast, reverse labeling (also termed selective unlabeling) involves incorporating specific amino acids in their natural, unlabeled form (¹²C, ¹⁴N) against a uniformly ¹³C/¹⁵N-labeled background, thereby simplifying spectra by suppressing signals from the chosen residues [76] [77]. The strategic selection among these protocols enables researchers to balance experimental cost, spectral complexity, and the specific biological questions being addressed.
Comparative Analysis of Labeling Strategies
Table 1: Comprehensive Comparison of Isotopic Labeling Strategies
| Feature | Uniform Labeling | Selective Labeling | Reverse Labeling/Selective Unlabeling |
|---|---|---|---|
| Basic Principle | Global incorporation of ¹³C/¹⁵N into all positions [76] | Specific incorporation of ¹³C/¹⁵N into target amino acids [77] | Specific incorporation of ¹²C/¹⁴N into target amino acids against a ¹³C/¹⁵N background [76] [77] |
| Typical Precursors | [U-¹³C]-glucose, ¹⁵NH₄Cl [76] [26] | ¹³C/¹⁵N-labeled specific amino acids [77] | Unlabeled (¹²C/¹⁴N) specific amino acids + [U-¹³C]-glucose/¹⁵NH₄Cl [76] |
| Relative Cost | Moderate | High (labeled amino acids are expensive) [77] | Low (unlabeled amino acids are inexpensive) [76] [77] |
| Spectral Complexity | High (full spectrum of signals) [77] | Low (only signals from labeled residues) [77] | Reduced (signals from unlabeled residues are absent) [76] [77] |
| Primary Application in NMR | De novo structure determination; backbone assignment [76] | Identification/assignment of specific amino acid types [77] | Spectral simplification; sequential assignment via linkage [76] [77] |
| Primary Application in MS | Untargeted metabolomics (SIRM); flux analysis [26] [78] | Tracking specific metabolic fates | Not commonly a primary technique for MS |
| Compatibility with Deuterated Samples | Yes | Challenging (loss of side-chain ¹H signals) [76] [77] | Yes [76] |
| Key Advantage | Maximum information content | Selective information with minimal overlap | Cost-effective spectral simplification and sequential assignment [76] [77] |
| Key Limitation | Spectral overlap/crowding in large proteins [77] | High cost; does not establish sequential links [76] | Potential for misincorporation of ¹⁴N [76] |
Experimental Protocols and Methodologies
Protocol for Reverse Labeling (Selective Unlabeling)
The method of reverse labeling is achieved by biosynthetically producing the target protein in a host microorganism (e.g., E. coli) grown in a minimal medium containing a uniform ¹³C carbon source (e.g., ¹³C-glucose) and a ¹⁵N nitrogen source (e.g., ¹⁵NH₄Cl), supplemented with the specific amino acid(s) intended for unlabeling in their unlabeled (¹²C, ¹⁴N) form [76] [77]. The unlabeled amino acid is taken up by the cell and incorporated into the newly synthesized protein, while all other amino acids are synthesized by the organism from the labeled precursors, resulting in their isotopic enrichment. The key to success lies in optimizing the concentration of the supplemented unlabeled amino acid to ensure efficient incorporation without hindering cell growth [77]. This protocol is applicable to both cell-based and cell-free protein expression systems, offering flexibility for challenging proteins.
A critical step in the experimental design is the selection of which amino acids to unlabel, either individually or in combination. This decision is guided by the amino acid's relative abundance in the protein and the distinct spectral regions of their ¹³Cα and ¹³Cβ chemical shifts, which allow for easy discrimination [76]. For instance, based on BioMagResBank (BMRB) statistics, amino acids can be grouped into distinct categories (e.g., Arg and Asn can be unlabeled together as their ¹³Cβ shifts resonate in different spectral regions). Gly, Ala, Ser, and Thr are typically not targeted for unlabeling as they can be directly identified from standard 3D NMR spectra, while Pro is omitted as it is not observed in standard HN-detected experiments [76].
Protocol for Sequential Assignment via Reverse Labeling
A powerful application of reverse labeling is its use in sequential resonance assignment. A novel NMR experiment, the 2D {¹²CO~i~–¹⁵N~i+1~}-filtered HSQC, was developed specifically for this purpose [76]. This experiment acts as a filter that selectively detects the ¹H/¹⁵N resonances of a residue (i+1) that is immediately C-terminal to a selectively unlabeled residue (i). The filter works by exploiting the fact that the carbonyl carbon (CO) of the unlabeled residue i is ¹²C, which has a different magnetic environment than ¹³C.
The process establishes a tri-peptide linkage from the knowledge of the amino acid types of residues i-1, i, and i+1. By identifying the missing peak of the unlabeled residue (i) in a standard HSQC and then using the filtered experiment to find its C-terminal neighbor (i+1), a sequential link is established. This approach, combined with conventional triple-resonance experiments, significantly speeds up the sequential assignment process and is robust to potential misincorporation of ¹⁴N at undesired sites [76].
Workflow for MS-Based Stable Isotope-Resolved Metabolomics (SIRM)
In contrast to the targeted protein NMR applications, MS-based Stable Isotope-Resolved Metabolomics (SIRM) employs uniform or selective labeling for untargeted tracking of metabolic fluxes. The standard workflow involves several key stages [26] [78]:
- Tracer Administration: A biological system (cells, tissue, organism) is administered a stable isotope-enriched precursor (e.g., [U-¹³C]-glucose, [U-¹³C,¹⁵N]-glutamine).
- Sample Preparation: After a defined incubation period, metabolites are extracted from the system. It is critical to prepare parallel control samples administered the same amount of unlabeled compound.
- LC/MS Analysis: The extracts are analyzed using Liquid Chromatography/Mass Spectrometry (LC/MS).
- Data Processing with Software like X13CMS: The raw LC/MS data is processed to identify "features" (compounds with unique retention time and m/z). Software then identifies isotopically labeled compounds by searching for pairs of features that co-elute and have an m/z difference corresponding to the incorporation of one or more tracer atoms (e.g., 1.00335 Da for ¹³C) [78].
- Pathway Mapping: The final output is a comprehensive list of labeled compounds, from which metabolic pathway connections and fluxes must be inferred.
Analytical Techniques: MS vs. NMR
The choice of analytical platform is crucial, as NMR and MS offer complementary strengths for analyzing isotopic labeling. Mass Spectrometry excels in sensitivity and can precisely determine the number of tracer atoms incorporated into a molecule, identifying different isotopologues (molecules differing in the number of tracer atoms, e.g., ¹³C₂ vs ¹³C₃) [26]. Ultra-high-resolution MS can even distinguish between different tracer elements (e.g., ¹³C vs ¹⁵N) within the same molecule [26]. However, traditional MS struggles to determine the exact position of the label within the molecule without additional fragmentation experiments.
In contrast, Nuclear Magnetic Resonance spectroscopy provides atomic-resolution information, making it uniquely powerful for identifying positional isotopomers (molecules with the same number of tracer atoms but in different positions) [26] [53]. This is because each nucleus in a molecule resonates at a distinct frequency (chemical shift) that is sensitive to its local chemical environment. Furthermore, NMR is non-destructive and can be used for in vivo studies to track metabolic kinetics in real time, especially with hyperpolarization techniques [26]. The combination of both techniques provides a cross-validating and comprehensive view of metabolic networks.
Table 2: Comparison of MS and NMR for Isotope Labeling Analysis
| Analytical Characteristic | Mass Spectrometry (MS) | Nuclear Magnetic Resonance (NMR) |
|---|---|---|
| Primary Isotope Information | Number of labels (Isotopologue distribution) [26] | Position of labels (Positional isotopomer distribution) [26] [53] |
| Sensitivity | High (femtomole to attomole) | Low (nanomole to micromole) [53] |
| Sample Throughput | Relatively High | Relatively Low |
| Quantification | Excellent for isotopologue abundances | Excellent for positional enrichment [26] |
| Structural Insight | Limited (requires MS/MS) | High (atomic resolution) |
| In vivo / Real-time Capability | Limited | Yes (e.g., with hyperpolarization) [26] |
| Key Application in Labeling | Global tracking of label flux (SIRM) [26] [78] | Pathway elucidation via positional labeling [26] [53] |
Successful execution of isotopic labeling studies requires access to specific, high-quality reagents and resources. The following table details essential components for the featured experiments.
Table 3: Essential Research Reagent Solutions for Isotopic Labeling
| Reagent / Resource | Function and Application |
|---|---|
| ¹⁵NH₄Cl | Provides a universal ¹⁵N source for uniform nitrogen labeling in cell growth media for both NMR and MS studies [76]. |
| [U-¹³C]-Glucose | Serves as the primary carbon source for uniform ¹³C labeling of proteins or metabolites. Essential for reverse labeling and SIRM protocols [76] [26]. |
| Unlabeled Amino Acids | Used in reverse labeling to specifically suppress signals from chosen amino acid types in an otherwise uniformly labeled protein, simplifying NMR spectra [76] [77]. |
| [U-¹³C,¹⁵N]-Glutamine | A doubly-labeled tracer used in multiplexed SIRM (mSIRM) experiments to simultaneously track carbon and nitrogen fate through metabolic pathways like glutaminolysis [26]. |
| National Stable Isotope Resource | Provides specialized synthesis of ²H, ¹³C, ¹⁵N, ¹⁸O-labeled compounds for bioenergy and health research, enabling advanced tracer studies [79]. |
| X13CMS Software Platform | A computational tool for the untargeted analysis of LC/MS data from isotopic tracer studies. It identifies labeled compounds and quantifies the extent of labeling across the entire metabolome [78]. |
Uniform, selective, and reverse labeling protocols each offer distinct advantages and limitations, making them suited for different experimental goals in conjunction with MS and NMR measurement techniques. Uniform labeling remains the gold standard for comprehensive structural studies and untargeted metabolomics, despite its inherent spectral complexity. Selective labeling provides a targeted approach for probing specific residues or pathways but at a higher cost. Reverse labeling emerges as a particularly powerful and cost-effective strategy for deconvoluting complex NMR spectra of challenging proteins, enabling both spectral simplification and sequential resonance assignments.
The choice of analytical platform is equally critical. MS offers superior sensitivity for tracking global label incorporation and flux, while NMR provides unmatched detail on the positional fate of isotopes within molecules. The most robust metabolic and structural studies often leverage the complementary strengths of both MS and NMR, using cross-validating data to build a more complete and accurate biochemical picture. By carefully matching the labeling strategy and analytical technique to the specific research question, scientists can effectively harness the power of isotopes to illuminate biological processes.
Isotopomer analysis, the process of determining the position-specific distribution of stable isotopes within molecules, has become a cornerstone technique for elucidating metabolic pathways and authenticating biological samples. Researchers primarily rely on two analytical platforms: Nuclear Magnetic Resonance (NMR) spectroscopy and Mass Spectrometry (MS). NMR provides unparalleled position-specific isotopic information, including 13C-13C coupling patterns, but suffers from lower sensitivity. In contrast, MS offers exceptional sensitivity for detecting low-abundance metabolites but typically lacks direct positional information unless metabolites are fragmented [2] [80]. This fundamental complementarity has driven the development of sophisticated computational tools capable of integrating data from both platforms, thereby providing a more comprehensive view of metabolic systems and enhancing the accuracy of source authentication in fields like food science and pharmaceutical development [81] [2].
The computational challenge lies in mathematically modeling the complex isotopomer distributions measured by these techniques to estimate metabolic fluxes or determine geographic origin. This guide provides an objective comparison of current software tools designed to navigate this data complexity, detailing their performance, experimental protocols, and applicability to specific research needs.
Comparative Analysis of Computational Tools
The following table summarizes the key features and performance metrics of major software packages used for isotopomer analysis.
Table 1: Comparison of Computational Tools for Isotopomer Analysis
| Software Tool | Primary Analytical Platform | Data Modeling Capabilities | Key Performance Metrics | Unique Advantages |
|---|---|---|---|---|
| INCA 2.0 [80] [82] | Integrated NMR & MS | Steady-state & dynamic labeling experiments | Integrated NMR/MS data improved hepatic flux precision by up to 50% [80]. | First publicly available tool for dynamic modeling of combined NMR and MS datasets [82]. |
| MetaboLabPy [83] | NMR (with GC-MS integration) | Spectral processing, isotopomer distribution from combined NMR/GC-MS | Enables automated phase correction and segmental alignment of 1D-NMR spectra [83]. | Open-source; user-friendly GUI; specialized for NMR-based metabolomics and metabolic tracing. |
| Mnova MSChrom [84] | LC/GC-MS | Molecule matching, isotope cluster prediction, peak purity | Predicts isotope clusters for elemental composition verification; automates molecule matching [84]. | Commercial software; seamless co-analysis of NMR and MS data in the same document. |
| tcaSIM, NMR2FLUX [80] [82] | Primarily NMR | Steady-state isotopomer modeling | INCA 2.0 simulations were consistent with tcaSIM, a established NMR tool [82]. | Specialized for NMR isotopomer simulation; used as a benchmark for validating new tools. |
Experimental Protocols and Workflows
Protocol 1: Integrated Flux Analysis with INCA 2.0
This protocol, adapted from Rahim et al., demonstrates how INCA 2.0 leverages combined datasets to improve flux resolution in hepatic tissue [80] [82].
- Step 1: Sample Preparation and Tracer Infusion: Surgically catheterize rat jugular veins and allow 4-day recovery. Prime 24-hour fasted rats with a [U-13C3]propionate solution for 10 minutes, followed by a constant infusion for 90 minutes.
- Step 2: Metabolite Extraction: Immediately freeze liver tissue in situ using a freeze-clamp. Powder the frozen tissue and perform a dual extraction. For GC-MS analysis, use a methanol/chloroform/water extraction. For NMR analysis, use perchloric acid (PCA) extraction, followed by neutralization and lyophilization to create salt-free samples.
- Step 3: Data Acquisition:
- GC-MS: Derivatize metabolites from the organic solvent extraction and analyze to obtain Mass Isotopomer Distributions (MIDs).
- NMR: Rehydrate the lyophilized PCA extract and acquire 13C NMR spectra to obtain position-specific 13C enrichment and 13C-13C coupling data.
- Step 4: Data Integration and Modeling in INCA 2.0: Construct a stoichiometric metabolic network of hepatic metabolism. Input the combined GC-MS MIDs and NMR isotopomer data into INCA 2.0. Use the software's algorithms to simulate labeling patterns and iteratively adjust metabolic fluxes until the simulated data best fits the experimental measurements.
Protocol 2: Food Authentication Using Sesquiterpene Fingerprinting
This protocol, based on a large-scale study of Virgin Olive Oil (VOO), highlights a direct comparison between targeted and untargeted analysis [23].
- Step 1: Sample Collection: Assemble a diverse set of nearly 400 VOO samples from multiple harvest years, cultivars, and producers.
- Step 2: Parallel Analysis:
- Targeted Stable Isotope Analysis: Determine bulk δ13C, δ18O, and δ2H ratios using Elemental Analysis-Isotope Ratio Mass Spectrometry (EA-IRMS).
- Untargeted Sesquiterpene Fingerprinting: Analyze the volatile fraction using Headspace-Solid Phase Microextraction-Gas Chromatography–Mass Spectrometry (HS-SPME-GC–MS) to profile sesquiterpene hydrocarbons (SH).
- Step 3: Chemometric Modeling: Develop Partial Least Squares Discriminant Analysis (PLS-DA) classification models for both datasets to differentiate between Italian and non-Italian VOOs, as well as VOOs from adjacent Italian regions.
- Step 4: Model Validation: Assess the classification accuracy, sensitivity, and specificity of both models using external validation sets. The study found SH fingerprinting achieved over 90% accuracy, outperforming isotopic models at 75% accuracy [23].
Visualizing Workflows and Data Integration
The following diagram illustrates the integrated workflow for combining MS and NMR data, as implemented in tools like INCA 2.0.
Figure 1: Integrated workflow for MS and NMR isotopomer analysis.
The logical relationship between the analytical question, the choice of technique, and the appropriate computational tool is summarized below.
Figure 2: Decision pathway for selecting analytical techniques and tools.
The Scientist's Toolkit: Essential Research Reagents and Materials
Table 2: Key Research Reagent Solutions for Isotopomer Analysis
| Reagent / Material | Function in Isotopomer Analysis | Example Application |
|---|---|---|
| [1,6-13C2]Glucose [80] [82] | 13C-labeled metabolic tracer | Tracing glycolytic and TCA cycle fluxes in perfused mouse hearts. |
| [U-13C3]Propionate [80] [82] | 13C-labeled metabolic tracer | Investigating hepatic metabolism via gluconeogenesis and TCA cycle in rats. |
| Perchloric Acid (PCA) [80] | Metabolite extraction | Precipitating proteins and extracting polar metabolites from tissue for NMR analysis. |
| Methanol/Chloroform/Water [80] | Metabolite extraction | Dual-phase extraction for comprehensive metabolite recovery for MS and NMR. |
| Divinylbenzene/Carboxen/PDMS (DVB/CAR/PDMS) Fiber [23] | Headspace Solid-Phase Microextraction (HS-SPME) | Extracting volatile sesquiterpene hydrocarbons from virgin olive oil for GC-MS fingerprinting. |
The field of isotopomer analysis is moving decisively toward data integration. As demonstrated, tools like INCA 2.0 that can synthesize information from complementary analytical platforms provide significantly more precise and biologically insightful results than those relying on a single data type. The experimental data shows clear quantitative benefits, with integrated NMR and MS datasets improving hepatic flux precision by up to 50% [80].
Future developments will likely focus on enhancing the usability and power of these integrated tools. Key areas include the creation of unified NMR and MS spectral databases for more accurate metabolite identification [81] [2], the refinement of algorithms for analyzing complex dynamic labeling experiments, and the continued push for open-source platforms like MetaboLabPy to make these advanced methodologies more accessible [83]. For researchers and drug development professionals, mastering these computational tools is no longer a niche skill but a central requirement for unlocking the full potential of isotopomer data to decipher metabolic complexity and ensure product authenticity.
Head-to-Head Comparison: Validating Results with MS and NMR
In the field of isotopic labeling research, particularly for applications in drug development and metabolic flux analysis, scientists primarily rely on two powerful analytical techniques: Nuclear Magnetic Resonance (NMR) spectroscopy and Mass Spectrometry (MS). Each method offers distinct advantages and suffers from specific limitations regarding sensitivity, structural elucidation, and quantitative accuracy. This guide provides an objective, data-driven comparison of these technologies to help researchers select the most appropriate tool for their specific isotopic measurement needs. Understanding the fundamental performance characteristics of NMR and MS is crucial for designing robust experiments in pharmaceutical research, metabolomics, and natural product discovery.
The core difference between NMR and MS lies in their fundamental detection principles, which directly translates to vastly different sensitivity levels and performance characteristics. Table 1 summarizes a direct comparison of their key technical specifications.
Table 1: Direct Performance Comparison of NMR and MS for Isotopic Analysis
| Performance Parameter | NMR Spectroscopy | Mass Spectrometry (LC-MS) |
|---|---|---|
| Typical Detection Limit | Micromolar (μM) to millimolar (mM) range [2] | Picogram (pg) to femtogram (fg) levels; nanomolar (nM) to picomolar (pM) range [85] |
| Quantitative Precision | High precision (e.g., 0.16% for 13C, 0.26% for 2H with rnmrfit 2.0) [6] | High accuracy, though may require internal standards for quantification [85] [86] |
| Key Strength | Unmatched structural elucidation, isotope position determination, non-destructive [2] [54] | Extremely high sensitivity, high throughput, ability to detect trace metabolites [85] [54] |
| Major Limitation | Inherently lower sensitivity [2] | Cannot distinguish structural isomers or isotopomers without fragmentation; destructive technique [2] [54] |
| Sample Throughput | Moderate | High |
| Technique | Non-destructive; sample can be recovered [52] [2] | Destructive; sample is consumed during analysis [54] |
MS is significantly more sensitive than NMR, capable of detecting metabolites and isotopes at concentrations that are often undetectable by standard NMR methods. This makes MS the preferred technique for identifying low-abundance metabolites or when sample quantity is limited [85] [54]. However, NMR provides superior structural information, including the ability to pinpoint the exact position of an isotope label within a molecule, which is a critical capability for elucidating metabolic pathways. NMR is also inherently quantitative and non-destructive, allowing for sample recovery [2].
Experimental Protocols for Isotopic Analysis
High-Precision Isotopic NMR with rnmrfit 2.0
The rnmrfit 2.0 software package is designed specifically for high-precision quantitative NMR, achieving exceptional precision for isotopic ratio analysis [6].
- Sample Preparation: Samples are prepared in deuterated solvents. For optimal performance with 13C analysis using rnmrfit, specific processing parameters are recommended.
- Data Acquisition: Standard 1D 1H or 13C NMR spectra are acquired. The software is compatible with data from major NMR platforms.
- Spectral Processing & Peak Fitting: The acquired data is processed within the rnmrfit environment. The software employs a semi-global peak fitting algorithm with automated peak region selection. It is crucial to optimize processing parameters, as line broadening (1–3 Hz) and zero filling (0.5–1.0) significantly impact fit precision, with these optimal settings differing from common recommendations for 13C spectra [6].
- Quantification & Validation: The software fits the spectral data to a defined model, directly calculating the areas under the resonance peaks for different isotopologues. The precision and trueness of the results can be validated against known standards, with rnmrfit demonstrating superior performance compared to commercial software like TopSpin and MestReNova [6].
The following diagram illustrates this high-precision NMR workflow:
Single-Cell Isotopic Labeling Analysis with Mass Spectrometry
A proof-of-concept study detailed a protocol for tracking isotope incorporation in plant metabolites at single-cell resolution [20].
- Labeling & Sample Preparation: Leaf protoplasts are incubated with a stable-isotope labelled precursor (e.g., d5-tryptamine). The concentration (1 mM used in the study) and incubation time (up to 24 hours) are optimized to maintain cell viability while ensuring sufficient label incorporation [20].
- Single-Cell Isolation: At defined time points, aliquots of protoplasts are collected and loaded onto a microfluidic chip (e.g., SieveWell) for individual cell isolation [20].
- MS Analysis & Quantification: Each isolated cell is subjected to LC-MS/MS analysis. The mass spectrometer is used to detect the mass shift corresponding to the incorporation of the deuterated label, identifying compounds like d4-strictosidine and d4-catharanthine. The limit of quantification for this specific scMS platform was estimated at 0.02–0.1 nM for the alkaloids measured [20].
- Data Interpretation: The presence and quantity of labelled metabolites are tracked over time to calculate enzymatic formation rates on a per-cell basis. Cell types can be identified based on specific molecular markers (e.g., secologanin for epidermal cells) [20].
The workflow for this single-cell MS analysis is as follows:
The Scientist's Toolkit: Key Research Reagents and Materials
Successful isotopic labeling experiments require specific reagents and materials tailored to the chosen analytical technique. Table 2 lists essential items and their functions.
Table 2: Essential Research Reagents and Materials for Isotopic Labeling Studies
| Item | Function / Application | Technique |
|---|---|---|
| Deuterated Solvents (e.g., D2O, CDCl3) | Provides a field frequency lock and minimizes interfering solvent signals in the spectrum. | NMR [52] |
| Stable Isotope-Labeled Precursors (e.g., 13C-glucose, d5-tryptamine) | Metabolic tracers fed to biological systems to track incorporation into pathways. | NMR & MS [20] [2] |
| Methyltransferase (MTase) Enzymes | Enzymes used to install site-specific 13C-methyl labels on DNA or proteins for TROSY-based NMR. | NMR [5] |
| ILV Methyl Labeling Schemes | Specific isotopic labeling of Isoleucine, Leucine, and Valine methyl groups in proteins for NMR studies of large complexes. | NMR [87] |
| Chemical Isotope Labelling (CIL) Kits | Derivatization of samples with isotopically distinct tags (e.g., dimethyl labeling) for accurate quantitative comparison by MS. | MS [85] [86] |
| 13C/15N-Labeled (d)NTPs | Substrates for in vitro transcription/synthesis to produce isotopically labeled nucleic acids for NMR. | NMR [5] |
The choice between NMR and MS for isotopic labeling analysis is not a matter of identifying a superior technology, but of selecting the right tool for the specific research question. Mass Spectrometry is the unequivocal champion of sensitivity, enabling the detection and quantification of isotopes at trace levels and in single cells. Its high throughput makes it ideal for screening and targeted metabolomics. Conversely, Nuclear Magnetic Resonance spectroscopy provides an unmatched level of structural detail and positional information about the isotopic label. Its quantitative nature, reproducibility, and non-destructive character make it ideal for definitive pathway elucidation and flux analysis.
For the most comprehensive insights, a synergistic approach is often the most powerful. As highlighted in recent literature, integrating NMR and MS data through data fusion strategies provides a more holistic view of biochemical processes, leveraging the strengths of both platforms to overcome their individual limitations [2] [54].
Absolute vs. Relative Quantification
In the field of isotopic labeling research, accurately determining the quantity of labeled compounds is fundamental to elucidating metabolic pathways, protein interactions, and cellular functions. The choice between absolute and relative quantification represents a critical methodological crossroads for researchers employing techniques such as mass spectrometry (MS) and nuclear magnetic resonance (NMR). Absolute quantification provides concrete concentration values (e.g., nmol/mg, μM) by comparing experimental data to a known standard curve or using digital counting methods, delivering results that are directly comparable across different laboratories and experimental conditions [88] [89]. In contrast, relative quantification measures changes in analyte abundance between samples (e.g., treated vs. control), expressing results as fold-changes or ratios without determining absolute concentrations, which is sufficient for many comparative studies [88] [89].
For researchers investigating isotopic labeling, this distinction carries significant implications for experimental design, data interpretation, and resource allocation. This guide objectively compares the performance of MS and NMR techniques for both quantification paradigms within isotopic labeling studies, providing supporting experimental data and detailed methodologies to inform selection criteria for diverse research applications.
Fundamental Principles and Definitions
Absolute Quantification
Absolute quantification determines the exact amount or concentration of a target analyte in a sample. In isotopic labeling studies, this typically involves using isotopically-labeled homologues (e.g., 13C, 2H, 15N) of the metabolites to be measured as internal standards [89]. These standards are spiked into samples prior to extraction or added to the final extract, allowing researchers to account for variations in sample preparation and analysis [89].
Key Methodologies:
Standard Curve Method: This approach requires creating a dilution series of standards with known concentrations. The absolute quantities of these standards must first be known by independent means, such as spectrophotometric measurement at A260 [88]. The experimental samples are compared to this standard curve, and quantities are extrapolated based on their position relative to the standards [88].
Digital PCR Method: Used primarily for nucleic acid quantification, this method partitions a sample into thousands of individual reactions and uses the ratio of positive to negative PCR reactions to count the absolute number of target molecules without reference to standards [88]. This method is highly tolerant to inhibitors and capable of analyzing complex mixtures [88].
Relative Quantification
Relative quantification analyzes changes in gene expression or metabolite abundance in a given sample relative to another reference sample, such as an untreated control [88]. This approach is useful for determining "up/down" changes between sample types when absolute concentration values are unnecessary for research goals [89].
Key Methodologies:
Standard Curve Method (Relative): For relative quantification, standard curves are prepared using any stock RNA or DNA containing the appropriate target, as the units used to express dilution are irrelevant [88]. The key requirement is that the relative dilutions of the standards are known.
Comparative CT Method (2-ΔΔCT): This approach compares the cycle threshold (CT) value of a target gene to an internal control or reference gene (e.g., a housekeeping gene) within a single sample [88]. This method eliminates the need for a standard curve, increasing throughput and reducing potential dilution errors [88].
Table 1: Fundamental Characteristics of Absolute vs. Relative Quantification
| Characteristic | Absolute Quantification | Relative Quantification |
|---|---|---|
| Output Units | nmol/mg, μM, copies/μl [89] | Fold-change, relative amount, peak area ratio [89] |
| Standard Requirements | Known concentrations of authentic standards [88] [89] | Relative dilutions sufficient; any stock with target [88] |
| Internal Controls | Isotopically-labeled homologues of target analytes [89] | Surrogate internal standards or housekeeping genes [88] [89] |
| Primary Applications | Determining exact concentrations; clinical diagnostics; metabolic flux analysis [89] [90] | Comparing expression changes; treatment effects; mutant vs. wildtype [88] [89] |
| Key Limitations | Requires pure, characterized standards; accurate pipetting critical [88] | Requires stable reference genes; results not comparable across labs [88] [91] |
Technical Comparison of MS and NMR Capabilities
Mass Spectrometry for Isotopic Quantification
Mass spectrometry has emerged as a powerful platform for both absolute and relative quantification in isotopic labeling studies due to its exceptional sensitivity, versatility, and compatibility with various separation techniques.
Absolute Quantification by MS: The application of tandem mass spectrometry (MS/MS) is emerging as a promising technique for measuring stable-isotope labeling with significant advantages over traditional MS and NMR-based methods [90]. Triple quadrupole tandem mass spectrometers coupled with gas or liquid chromatography provide multiple stages of mass separation with fragmentation in between, enabling specific monitoring of parent-daughter ion transitions [90]. This significantly improves measurement accuracy by 2-fold to 10-fold compared to conventional GC-MS or LC-MS [90]. For absolute quantification, isotopically-labeled internal standards are spiked into samples at known concentrations, allowing precise determination of target analyte concentrations based on the response ratio between the endogenous compound and its labeled counterpart [89].
Relative Quantification by MS: Relative quantification by MS often uses surrogate internal standards that are chemically similar to a class of compounds but may not be identical to the target analytes [89]. One or a few surrogate standards can account for many metabolites, making this approach practical for large-scale metabolomic studies where obtaining labeled standards for every analyte is impractical [89]. The high sensitivity of MS (capable of detecting metabolites in the femtomolar to attomolar range) and its wide dynamic range (∼10³-10⁴) make it particularly suitable for detecting low-abundance metabolites in complex biological mixtures [81].
Nuclear Magnetic Resonance for Isotopic Quantification
NMR spectroscopy provides unique capabilities for isotopic labeling studies, particularly for structural analysis and absolute quantification without the need for extensive sample preparation or derivative generation.
Absolute Quantification by NMR: NMR is easily quantitative and requires minimal sample handling without the need for chromatography or derivative generation [81]. The signal intensity in NMR spectra is directly proportional to the number of nuclei generating the signal, allowing straightforward absolute quantification when appropriate standards are used [81]. This is particularly valuable for metabolic flux analysis, where 13C NMR techniques provide detailed information about the distribution of isotopomers within molecules [57]. A labeled carbon atom produces different hyperfine splitting signals depending on the labeling state of its direct neighbors—singlet peaks emerge if neighboring carbons are not labeled, doublets if one neighbor is labeled, and doublet of doublets (potentially degenerating to triplets) if two neighbors are labeled [57].
Relative Quantification by NMR: While NMR can be used for relative quantification, it is less commonly applied for this purpose compared to MS. The relatively low sensitivity of NMR (limited to detecting the most abundant metabolites, typically ≥1 μM) restricts its utility for comprehensive metabolomic profiling where thousands of metabolites span a wide concentration range [81]. However, NMR provides excellent reproducibility and minimal sample preparation requirements, making it suitable for time-course studies where relative changes in abundant metabolites are of interest [25].
Table 2: Performance Comparison of MS and NMR for Isotopic Quantification
| Performance Characteristic | Mass Spectrometry | Nuclear Magnetic Resonance |
|---|---|---|
| Sensitivity | High (femtomolar to attomolar) [81] | Low (≥1 μM) [81] |
| Reproducibility | Average [25] | Very high [25] |
| Metabolite Coverage | 300-1000+ metabolites [25] | 30-100 metabolites [25] |
| Sample Preparation | Complex; may require extraction, derivation, chromatography [81] [25] | Minimal; tissues can be analyzed directly [25] |
| Quantitative Accuracy | Requires internal standards; subject to ion suppression [81] | Directly quantitative; minimal matrix effects [81] |
| Isotopomer Measurement | Mass isotopomer distributions via GC-MS/MS or LC-MS/MS [90] [57] | Positional isotopomer information via 13C NMR [57] |
| Throughput | Moderate to high (requires chromatography) [25] | High (no separation needed) [25] |
Experimental Protocols
Protocol for Absolute Quantification Using MS with Isotopic Standards
This protocol outlines the procedure for absolute quantification of amino acids using isotopic internal standards, adaptable to other metabolite classes with appropriate standards.
Materials and Reagents:
- Isotopically-labeled homologues of target analytes (e.g., 13C, 2H, or 15N-labeled compounds)
- Extraction solvent (typically methanol:water:chloroform mixture)
- Derivatization reagents (if using GC-MS)
- Mobile phase solvents (LC-MS grade)
- Internal standard solution with known concentrations
Procedure:
- Sample Preparation: Spike biological samples with isotopically-labeled internal standards at known concentrations prior to extraction to account for preparation losses [89].
- Extraction: Homogenize samples in appropriate extraction solvent. For intracellular metabolites, use quenching protocols to rapidly arrest metabolism.
- Preparation for Analysis: For GC-MS analysis, derivative samples to increase volatility. For LC-MS, samples may require dilution with mobile phase.
- Instrumental Analysis:
- GC-MS/MS: Use triple quadrupole tandem mass spectrometry with selected reaction monitoring (SRM) for specific parent-daughter ion transitions [90].
- LC-MS/MS: Employ reverse-phase or HILIC chromatography coupled to tandem MS with appropriate ionization mode (ESI+ or ESI-).
- Data Analysis: Calculate absolute concentrations using the response ratio between the endogenous compound and its isotopically-labeled standard, referenced against a calibration curve [89].
Validation Parameters:
- Determine limits of detection (LOD) and quantification (LOQ)
- Establish linearity of response across expected concentration range
- Evaluate precision and accuracy using quality control samples [89]
Protocol for Relative Quantification Using qPCR
This protocol details relative quantification of gene expression using quantitative real-time PCR (qPCR), applicable to studies investigating transcriptional responses to isotopic labeling.
Materials and Reagents:
- SYBR Green master mix or TaqMan probes
- Primers for target genes and reference genes
- RNA extraction kit
- Reverse transcription kit
- Nuclease-free water and plasticware
Procedure:
- RNA Extraction: Isolate total RNA from experimental and control samples using appropriate methods.
- Reverse Transcription: Convert RNA to cDNA using reverse transcriptase with random hexamers or oligo-dT primers.
- PCR Amplification: Set up reactions containing:
- cDNA template
- SYBR Green master mix or TaqMan probe master mix
- Forward and reverse primers for target and reference genes
- Thermal Cycling: Run qPCR with appropriate cycling conditions:
- Initial denaturation: 95°C for 10 min
- 40 cycles of: 95°C for 15 sec, 60°C for 1 min
- Melt curve analysis (for SYBR Green)
- Data Analysis: Use the comparative CT (2-ΔΔCT) method to calculate relative expression levels [88]. Validate that amplification efficiencies of target and reference genes are approximately equal.
Protocol for Metabolic Flux Analysis Using NMR
This protocol describes the use of NMR for metabolic flux analysis through stable isotope labeling, particularly useful for determining flux distributions in central carbon metabolism.
Materials and Reagents:
- 13C-labeled substrates (e.g., [U-13C6]-glucose, [1-13C]-glucose)
- Deuterated solvent for NMR (e.g., D2O)
- Buffer compounds for physiological conditions
- NMR reference compounds (e.g., TSP, DSS)
Procedure:
- Isotope Labeling: Incubate biological system (cells, tissues) with 13C-labeled substrate for sufficient time to achieve isotopic steady state or perform time-course sampling for instationary analysis [57].
- Sample Extraction: Rapidly extract metabolites using appropriate protocol (e.g., cold methanol extraction). Alternatively, analyze intact tissues directly if using high-resolution magic angle spinning (HR-MAS) NMR.
- NMR Analysis:
- Prepare sample in appropriate NMR tube with D2O for field frequency locking
- Acquire 1D 1H NMR spectra with water suppression
- Acquire 13C NMR or 1H-13C HSQC spectra for isotopomer analysis
- Data Processing:
- Fourier transformation with appropriate apodization functions
- Phase and baseline correction
- Chemical shift referencing to internal standard
- Isotopomer Analysis: Determine isotopomer distributions from 13C fine structure in 1H NMR spectra or directly from 13C NMR spectra [57]. Use specialized software (e.g., INCA, SIMPEL) for flux calculation [35].
Experimental Data and Performance Comparison
Quantitative Performance in Comparative Studies
A comparative study of qPCR (relative quantification) and droplet digital PCR (ddPCR, absolute quantification) for analyzing gene expression of vasoactive receptors under inflammatory conditions revealed both consistencies and divergences between the approaches [91]. The research demonstrated agreement in effect direction for 6 out of 8 target genes, with both methods indicating reduced expression for ADRA1B, ADRA1D, ACE1, ATIP1, and EDNRB following cytokine stimulation [91]. However, significant deviations in effect size were observed for genes with low abundance near the detection limits of the methodologies [91]. For example, ADRA1D expression was indicated to be reduced to 0.1 times control by qPCR versus 0.5 times by ddPCR, while ACE1 showed reduction to 0.1 times (qPCR) versus 0.04 times (ddPCR) [91]. These discrepancies highlight how methodological differences particularly impact quantification of low-abundance targets.
Advanced Applications in Metabolic Flux Analysis
The integration of both MS and NMR data represents an emerging paradigm for comprehensive coverage of the metabolome in isotopic labeling studies [81]. While MS provides superior sensitivity for detecting low-abundance metabolites, NMR offers direct quantitative capabilities and positional isotopomer information that are invaluable for metabolic flux analysis [81]. A tool called SIMPEL (Stable Isotope-assisted Metabolomics for Pathway Elucidation) has been developed to capitalize on high-resolution MS data from transient stable isotope labeling experiments, enabling automated processing of isotopologue distributions and natural abundance corrections [35]. When paired with isotopically nonstationary metabolic flux analysis (INST-MFA), this approach can resolve challenging fluxes that traditionally require data from multiple labeling experiments [35].
Table 3: Analytical Characteristics of Quantification Methods in Isotopic Labeling Studies
| Method | Precision | Information Content | Throughput | Resource Requirements |
|---|---|---|---|---|
| NMR | High for abundant metabolites [81] | Positional isotopomer information [57] | High for direct analysis [25] | High instrument cost; minimal consumables [25] |
| GC-MS | Moderate to high [90] | Mass isotopomer distributions with fragmentation patterns [57] | Moderate (requires derivation) [25] | Moderate instrument cost; low consumables [25] |
| LC-MS | Moderate (subject to ion suppression) [81] | Mass isotopomer distributions; wider metabolite coverage [81] | Moderate to high [25] | Moderate to high instrument cost; moderate consumables [25] |
| Tandem MS (MS/MS) | High (2-10× improvement over conventional MS) [90] | Complete positional isotopomer distribution from fragments [90] | Moderate | High instrument cost; moderate consumables |
Research Reagent Solutions
Table 4: Essential Research Reagents for Isotopic Quantification Studies
| Reagent Category | Specific Examples | Function in Research | Compatible Platforms |
|---|---|---|---|
| Stable Isotope-Labeled Standards | 13C615N2-glutamine; 13C6-glucose; deuterated amino acids [35] | Tracer for metabolic pathways; internal standards for absolute quantification [89] [35] | NMR, MS, MS/MS |
| Extraction Solvents | Methanol:water:chloroform (4:4:2); acetonitrile:water (1:1) | Metabolite extraction and quenching of metabolism | MS, NMR |
| Chromatography Columns | C18 reverse-phase; HILIC; GC capillary columns | Separation of complex mixtures prior to detection | GC-MS, LC-MS, LC-MS/MS |
| Derivatization Reagents | MSTFA (N-Methyl-N-(trimethylsilyl)trifluoroacetamide); Methoxyamine | Increase volatility for GC-MS; stabilize reactive functional groups | GC-MS |
| NMR Solvents & Standards | Deuterated water (D2O); DSS (4,4-dimethyl-4-silapentane-1-sulfonic acid); TSP (trimethylsilylpropanoic acid) | Field frequency locking; chemical shift referencing; quantification | NMR |
| PCR Reagents | SYBR Green; TaqMan probes; reverse transcriptase | Amplification and quantification of nucleic acids | qPCR, ddPCR |
| Ionization Reagents | Formic acid; ammonium acetate; ammonium formate | Enhance ionization efficiency in positive or negative mode | ESI-MS, ESI-MS/MS |
Workflow Visualization
Quantification Methodology Selection Workflow
This workflow diagram illustrates the decision process and methodological pathways for selecting between absolute and relative quantification approaches in isotopic labeling studies. The divergent paths highlight the different reagent requirements, procedural steps, and output formats characteristic of each quantification paradigm.
MS vs NMR Analytical Workflow Comparison
This diagram contrasts the fundamental workflows for NMR and MS-based quantification in isotopic labeling studies, highlighting their distinct sample preparation requirements, analytical approaches, and inherent methodological advantages and limitations that inform their application domains.
The selection between absolute and relative quantification approaches in isotopic labeling research represents a fundamental methodological decision with far-reaching implications for experimental design, resource allocation, and data interpretation. Absolute quantification provides concrete concentration values essential for clinical diagnostics, metabolic engineering, and biochemical modeling, but demands characterized standards and rigorous validation [88] [89]. Relative quantification offers a practical approach for comparative studies investigating expression changes or treatment effects, with simpler standardization requirements but limited cross-study comparability [88] [89].
Mass spectrometry and nuclear magnetic resonance offer complementary capabilities for both quantification paradigms. MS provides exceptional sensitivity and broad metabolite coverage, making it indispensable for comprehensive metabolomic profiling, particularly when coupled with tandem MS approaches that improve measurement accuracy 2-10 fold [81] [90]. NMR delivers unparalleled structural information, direct quantification without standards, and exceptional reproducibility, despite its limitations in sensitivity and metabolite coverage [81] [25].
For researchers designing isotopic labeling studies, the optimal approach frequently involves strategic integration of both MS and NMR methodologies, leveraging their complementary strengths to achieve comprehensive metabolic characterization. The emerging trend toward combined analytical platforms and computational tools like SIMPEL that facilitate data integration from multiple sources represents the future of robust, comprehensive quantification in isotopic labeling research [35].
In the field of isotopic labeling research, nuclear magnetic resonance (NMR) spectroscopy and mass spectrometry (MS) serve as two pivotal analytical techniques, each providing distinct and complementary information. NMR excels in delivering atomic-level structural insight, including specific isotopic positions and molecular conformation, while MS operates as a powerful tool for molecular fingerprinting, offering high sensitivity for detecting and quantifying isotopic patterns. The choice between these techniques is not a matter of superiority but of strategic application, guided by the specific research question at hand. The following comparison, supported by experimental data and protocols, provides a guide for researchers and drug development professionals in selecting the appropriate analytical tool.
Core Comparison: NMR vs. MS in Isotopic Analysis
The table below summarizes the fundamental performance characteristics of NMR and MS for isotopic labeling studies.
Table 1: Core Comparison of NMR and MS for Isotopic Analysis
| Feature | Nuclear Magnetic Resonance (NMR) | Mass Spectrometry (MS) |
|---|---|---|
| Primary Strength | Atomic-level structural and positional insight [81] [57] | High-sensitivity molecular fingerprinting and quantification [81] [25] |
| Typical Information Obtained | Specific atomic positions of labels, molecular structure, conformation, dynamics, and chemical environment [57] [5] | Molecular mass, isotopic distribution (e.g., mass isotopomers), and quantitative abundance [57] [92] |
| Sensitivity | Low to moderate; generally requires metabolites ≥ 1 μM [81] | Very high; can detect metabolites from femtomolar to attomolar ranges [81] |
| Reproducibility | Very High [25] | Average [25] |
| Quantitation | Highly quantitative with a single internal standard [81] [93] | Quantitative, but requires isotope-labeled standards or calibration curves for accuracy [81] [93] |
| Sample Preparation | Minimal; often requires no chromatography [81] [25] | More complex; typically requires separation (LC, GC) and careful handling to avoid ion suppression [81] [25] |
| Key Metric for Isotopes | Nuclear spin; detected via chemical shift and J-coupling [57] | Mass-to-charge ratio (m/z); detected via mass differences [57] |
Quantitative Performance Data in Analytical Applications
Recent advancements in software and methodology have further defined the performance limits of these techniques, particularly in high-precision quantitative applications.
Table 2: Experimental Quantitative Performance Data
| Technique / Application | Key Performance Metric | Experimental Context |
|---|---|---|
| NMR with rnmrfit 2.0 Software | Precision as low as 0.16% for 13C and 0.26% for 2H analysis [6]. | High-precision isotopic ratio measurement for authenticity studies [6]. |
| NMR-Guided MS Quantitation | Median CV of 3.2% for 30 serum metabolites [93]. | Using NMR-derived concentrations as references for MS, demonstrating strong correlation (R² > 0.99) [93]. |
| Stable Isotope Ratios (e.g., δ13C, δ2H) | ~75% classification accuracy for geographical origin [23]. | Targeted analysis for authenticating Virgin Olive Oil origin [23]. |
| Sesquiterpene Fingerprinting (MS) | ~90% classification accuracy for geographical origin [23]. | Untargeted analysis outperforming stable isotope ratios in a similar authentication task [23]. |
Experimental Protocols for Isotopic Analysis
Protocol 1: High-Precision Isotopic Ratio Analysis via qNMR
This protocol is adapted from studies utilizing the rnmrfit software for high-precision analysis [6].
- Sample Preparation: Prepare the analyte in an appropriate deuterated solvent. For complex mixtures like blood serum, protein precipitation is necessary. A standard method involves mixing serum with methanol in a 1:2 (v/v) ratio, vortexing, incubating at -20°C for 20 minutes, and centrifuging to pellet proteins. The supernatant is dried and reconstituted in a phosphate buffer in D₂O containing a reference standard like TSP (3-(trimethylsilyl)propionic acid-d₄ sodium salt) [93].
- NMR Data Acquisition: Perform ¹H NMR experiments on a high-field spectrometer (e.g., 800 MHz). The CPMG (Carr-Purcell-Meiboom-Gill) pulse sequence with presaturation for water suppression is often used. Acquire data with a sufficient number of transients (e.g., 128) and a long recycle delay (e.g., 15 s) to ensure accurate quantitative results [93].
- Spectral Processing and Peak Fitting: Process the free induction decay (FID) with Fourier transformation after zero-filling. Critical processing parameters like line broadening and zero filling significantly impact fit precision. For ¹³C spectra, optimal line broadening is 1–3 Hz and zero filling is 0.5–1.0 [6]. Use a dedicated fitting tool like
rnmrfit 2.0, which employs semi-global peak fitting with automated peak region selection, to precisely quantify resonance peak areas [6]. - Data Analysis: Calculate concentrations by referencing the fitted peak areas against the internal standard (TSP). The high precision of the fit allows for the determination of isotopic ratios with exceptional trueness [6] [93].
Protocol 2: NMR-Guided Absolute Quantitation via LC-MS/MS
This hybrid protocol leverages the quantitative strength of NMR to calibrate MS, overcoming the need for individual labeled internal standards for every metabolite [93].
- Sample Preparation and Splitting: Prepare a set of samples (e.g., human serum) using an optimized protein removal protocol, such as methanol precipitation as described in Protocol 1. Split the resulting supernatant from each sample into two parts [93].
- NMR Analysis of Reference Sample: Analyze one part of a single, representative sample (e.g., a commercial pooled serum) using quantitative NMR as detailed in Protocol 1. This yields absolute concentrations for a wide range of metabolites in this reference sample [93].
- LC-MS/MS Analysis of All Samples: Analyze the other part of all samples using targeted LC-MS/MS. The mobile phase is often composed of solvents compatible with electrospray ionization, such as ammonium acetate in water/acetonitrile with acetic acid. Use multiple reaction monitoring (MRM) for specific and sensitive detection [93].
- MS Quantitation Guided by NMR: Use the absolute concentrations obtained by NMR for the reference sample as calibration points for the MS data. The MS peak areas for all other samples are then scaled based on this reference, allowing for the absolute quantitation of metabolites across the entire sample set without requiring a full set of isotope-labeled internal standards [93].
Workflow Visualization: NMR vs. MS Pathways
The following diagram illustrates the distinct yet potentially complementary workflows for structural analysis using NMR and MS.
The Scientist's Toolkit: Essential Research Reagent Solutions
Successful isotopic labeling studies depend on high-quality, specialized reagents and materials. The table below lists key solutions for researchers in this field.
Table 3: Essential Research Reagents for Isotopic Labeling Studies
| Reagent / Material | Function in Research | Example Application |
|---|---|---|
| Stable Isotope-Labeled Growth Media | Uniformly or selectively incorporates isotopes (e.g., ¹³C, ¹⁵N, ²H) into proteins or nucleic acids during biosynthesis [12] [92]. | Production of ¹³C/¹⁵N-labeled membrane proteins for structural NMR studies [12]. |
| Stable Isotope-Labeled Amino Acids & Nucleotides | Enables selective labeling at specific sites in a biomolecule, simplifying complex NMR spectra [92] [94]. | Site-specific labeling for tracking metabolic flux or studying protein-protein interactions [57] [92]. |
| Deuterated Solvents (e.g., D₂O) | Provides a lock signal for the NMR spectrometer and minimizes background proton signals [93]. | Standard solvent for all NMR-based metabolomic and structural analyses [93]. |
| Internal Standards (e.g., TSP for NMR) | Serves as a quantitative reference for chemical shift and concentration calculation in NMR [93]. | Absolute quantitation of metabolites in serum samples [93]. |
| Isotope-Labeled Internal Standards (for MS) | Corrects for variability in sample preparation and ionization efficiency in MS, enabling accurate quantitation [81] [93]. | Targeted LC-MS/MS analysis of specific metabolite panels. |
| Methyltransferase Enzymes & Labeled Cofactors | Enables site-specific introduction of ¹³C-methyl labels into DNA and RNA for NMR studies of large complexes [5]. | Installing ¹³CH₃ groups into a 153-bp DNA for structural studies of the nucleosome core particle [5]. |
NMR and MS are both indispensable in the modern isotopic labeling toolkit. NMR provides unparalleled, direct atomic-level insight into molecular structure and the precise position of isotopic labels, making it ideal for detailed structural biology and dynamics studies. MS offers a powerful molecular fingerprinting approach, characterized by exceptional sensitivity and high throughput, which is optimal for metabolomics, flux analysis, and quantification. For the most comprehensive and robust biological insights, particularly in complex systems like drug development, the synergistic use of both techniques, as exemplified by the NMR-guided MS quantitation protocol, often provides the most complete and reliable picture.
Throughput, Cost, and Accessibility for Routine Analysis
In the fields of metabolomics, proteomics, and biomarker discovery, the choice of analytical technique is pivotal. Nuclear Magnetic Resonance (NMR) spectroscopy and Mass Spectrometry (MS) are two cornerstone technologies for analyzing isotopically labeled compounds, each with distinct advantages and limitations [81]. For researchers and drug development professionals, the decision to implement NMR or MS involves careful consideration of throughput, cost, and accessibility for routine analysis. This guide provides an objective comparison of these techniques, supported by experimental data, to inform strategic platform selection within a broader thesis on isotopic labeling measurement techniques.
Technical Comparison: NMR vs. MS for Isotopic Analysis
The fundamental differences between NMR and MS shape their applications in isotopic labeling studies. The table below summarizes their core technical characteristics.
Table 1: Technical comparison of NMR and MS for isotopic labeling analysis.
| Characteristic | Nuclear Magnetic Resonance (NMR) | Mass Spectrometry (MS) |
|---|---|---|
| Sensitivity [81] [25] | Low (typically ≥ 1 μM) | High (femtomolar to attomolar) |
| Reproducibility [25] | Very High | Average |
| Number of Detectable Metabolites [25] | 30 - 100 | 300 - 1000+ |
| Quantitative Capabilities [81] [95] | Inherently quantitative; minimal sample preparation | Requires labeling or standard curves; quantitation can be a challenge |
| Sample Preparation [25] | Minimal; often non-destructive | More complex; often requires extraction or chromatography |
| Key Strength in Isotopic Labeling [57] | Determines position of label in molecule (e.g., via 13C NMR) | Measures mass shift from label; identifies isotopomer distribution |
| Key Limitation | Limited sensitivity and spectral overlap | Ion suppression; cannot distinguish between isomers without separation |
NMR spectroscopy is a quantitative and robust technique that requires minimal sample preparation and is non-destructive [81]. It excels at determining the precise position of an isotopic label within a molecule, providing detailed information on metabolic pathways [57]. For instance, 13C NMR can distinguish between different isotopomers—molecules with the same number of labels but in different positions—by analyzing hyperfine splitting signals, where a singlet peak indicates a labeled carbon with unlabeled neighbors, and a doublet indicates one labeled neighbor [57]. However, NMR is limited by its relatively low sensitivity, typically detecting metabolites only at concentrations of 1 μM or higher, and can suffer from signal overlap in complex mixtures [81].
Conversely, MS boasts exceptional sensitivity, capable of detecting metabolites in the femtomolar to attomolar range, and can profile a much larger number of metabolites in a single run [81] [25]. It measures the mass-to-charge ratio (m/z) of ions, directly detecting the mass shift caused by isotopic labeling [57]. This makes it powerful for metabolic flux analysis, where the distribution of mass isotopomers (molecules with different numbers of heavy isotopes) is measured [57]. The primary limitations of MS include ion suppression, where the presence of one metabolite can inhibit the ionization of another, and its inability to distinguish structural isomers without coupling to a separation technique like liquid chromatography (LC) [81]. While MS is not inherently quantitative, the use of stable isotope labeling strategies has markedly enhanced its quantitative accuracy and precision [51].
Throughput and Cost Analysis for Routine Workflows
For routine analysis, practical considerations of throughput and cost are as critical as technical performance.
Analysis Throughput
The term "throughput" encompasses sample preparation, data acquisition, and data analysis.
- NMR Throughput: NMR offers high throughput from a sample preparation perspective, as it often requires minimal handling and no derivatization [25]. Tissues can even be analyzed directly without extraction [25]. Data acquisition is fast, as the entire sample can be measured in a single, rapid run [25]. However, the analysis of complex NMR spectra, especially for isotopic labeling studies, can be time-consuming and requires a skilled specialist [57].
- MS Throughput: MS-based analysis typically involves more complex sample preparation, including extraction and often a chromatographic separation step (e.g., LC or GC), which increases hands-on time and run duration [81] [25]. However, modern multiplex isotope labeling techniques, such as Tandem Mass Tags (TMT), which allow for simultaneous analysis of up to 18 samples, can significantly increase throughput and reduce instrument time [51] [96]. The subsequent data analysis, while complex, is highly automated.
Instrument and Operational Costs
The financial investment for these platforms varies significantly.
- Capital Costs: NMR spectrometer prices are generally higher than those for MS systems. Costs for a new NMR can range from approximately $80,000 for a low-field (60 MHz) benchtop instrument to over $5 million for a high-field (900 MHz) superconducting system [97]. In contrast, MS instruments are noted to be cheaper and occupy less space [25].
- Sample Costs: The cost per sample tells a different story. NMR requires low-cost consumables and minimal preparation, leading to a low cost per sample [25]. MS, with its requirements for solvents, columns, and specialized labeling kits, incurs a high cost per sample [25]. For example, a university facility may charge around $18 per hour for a 500 MHz NMR, while a full-service MS analysis can cost about $15 per sample [98].
Table 2: Throughput and cost comparison for routine analysis.
| Aspect | NMR | MS |
|---|---|---|
| Sample Preparation [25] | Minimal; fast | Complex; slower |
| Data Acquisition Time [25] | Fast (single measurement) | Longer (requires chromatography) |
| Multiplexing Capability | Limited | High (e.g., TMT permits 16-plex or 18-plex) [96] |
| Typical Cost per Sample [25] | Low | High |
| Instrument Cost [25] | More expensive | Cheaper |
| Example Academic Service Fee | ~$18/hour (500 MHz) [98] | ~$15/sample (full service) [98] |
Experimental Protocols and Data
Objective comparison is best supported by data from studies that directly utilize both techniques.
Protocol: Comparative Metabolite Quantification in Saliva
A study investigating salivary metabolites employed both NMR and LC-MS/MS to highlight their complementary nature [95].
- Sample Preparation: Saliva samples were ultrafiltered (3 kDa cutoff) for NMR analysis. For LC-MS/MS, samples were both filtered and unfiltered.
- NMR Protocol: Filtered samples were analyzed using a targeted NMR approach. The protocol was robust and reproducible, allowing for the absolute quantification of metabolites.
- LC-MS/MS Protocol: A targeted method was used to analyze bioactive lipids. The high sensitivity of MS was crucial for detecting low-abundance compounds.
- Results: The NMR analysis successfully identified and quantified 45 metabolites, providing a broad overview of the polar metabolome. The LC-MS/MS analysis quantified 24 bioactive lipids, including endocannabinoids and oxylipins, significantly expanding the metabolome coverage. The study concluded that the platforms are viable for clinical studies and revealed important differences between saliva collection methods [95].
Protocol: Novel NMR vs. Conventional CPMG for Plasma
A 2020 study established a new high-throughput NMR protocol for large plasma cohorts and compared it to the conventional CPMG method [99].
- Methods: The novel procedure used a diffusion-based NMR experiment (LED) with maleic acid (MA) as an internal standard and peak picking for spectral reduction. This was compared to the standard CPMG approach with TSP standard and spectral binning.
- Results: The LED method suppressed macromolecule signals more efficiently and detected more metabolites than CPMG. It yielded classification models with enhanced accuracy and more reliable important features. The quantitative capability of the LED-MA protocol showed good linearity, recovery, and agreement with established amino acid assays [99]. This demonstrates how protocol optimization within a single technique can drastically improve performance.
Essential Research Reagent Solutions
The following table details key reagents and materials central to experiments in this field.
Table 3: Key research reagents and materials for isotopic labeling studies.
| Reagent/Material | Function | Example Use Case |
|---|---|---|
| Stable Isotope-Labeled Amino Acids (e.g., Lys, Arg) [51] | Metabolic labeling (SILAC) for quantitative proteomics. | Culturing cells in "heavy" vs. "light" media to combine samples for accurate MS quantification. |
| Tandem Mass Tags (TMT) [96] | Chemical labeling for multiplexed proteomics. | Labeling peptides from different biological conditions (e.g., 6-plex or 16-plex) for simultaneous MS analysis. |
| Maleic Acid (MA) [99] | Internal quantification standard for NMR. | Used in novel plasma NMR protocols as a superior alternative to TSP, which binds to proteins. |
| Deuterated Solvents (e.g., D₂O) [99] [95] | Lock solvent for NMR spectroscopy. | Present in NMR buffer to provide a stable frequency lock for the spectrometer. |
| Ultrafiltration Devices (3 kDa cutoff) [95] | Removal of macromolecules from biofluids. | Preparing saliva or plasma samples for NMR analysis to reduce signal interference from proteins. |
| Isobaric Labeling Kits (e.g., iTRAQ, TMT) [51] [96] | Commercial kits for multiplexed quantitative proteomics. | Streamlining sample preparation for high-throughput MS experiments comparing multiple states. |
Workflow Visualization
The following diagram illustrates the typical workflows for NMR and MS in the context of isotopic labeling studies, highlighting the points of divergence in sample handling and data acquisition.
The choice between NMR and MS for isotopic labeling analysis is not a matter of identifying a superior technology, but of selecting the right tool for the specific research question and operational context.
- For studies prioritizing quantitative robustness, minimal sample preparation, and determining the exact position of isotopic labels, NMR is the compelling choice, despite its lower sensitivity [81] [57].
- For projects requiring high sensitivity, comprehensive metabolome/proteome coverage, and high-throughput multiplexing, MS is unequivocally more powerful [81] [51] [25].
Financially, NMR presents a higher barrier to entry in terms of capital investment, while MS can incur higher ongoing consumable costs [97] [25]. For a complete picture, the two techniques are highly complementary. The most robust metabolomic or proteomic studies will often integrate both NMR and MS, leveraging the strengths of each to achieve broader metabolome coverage and more confident metabolite identification, thereby maximizing the return on investment for isotopic labeling experiments [81] [95].
Metabolomics, the comprehensive analysis of low-molecular-weight metabolites in biological systems, relies heavily on two principal analytical techniques: mass spectrometry (MS) and nuclear magnetic resonance (NMR) spectroscopy [54] [100]. Despite their shared utility, a prevalent misconception persists that metabolomics is better served by exclusively utilizing MS, leading to a research landscape where only a small percentage of studies leverage both techniques [101]. This perspective is inherently limiting, as MS and NMR are fundamentally complementary technologies. Their distinct physical principles and operational strengths lead to the detection of different, yet often overlapping, sets of metabolites [101] [100]. Combining NMR and MS mitigates the limitations of each standalone method, resulting in greater coverage of the metabolome, enhanced confidence in metabolite identification, and a more robust biological interpretation [101] [54] [100]. This guide objectively compares the performance of MS and NMR, with a specific focus on their application in Stable Isotope-Resolved Metabolomics (SIRM), and provides supporting experimental data and protocols that underscore the power of their integration.
Fundamental Technical Comparison: MS vs. NMR
The strengths and weaknesses of MS and NMR arise from their underlying physical principles. The table below provides a systematic comparison of their core technical characteristics.
Table 1: Fundamental Technical Comparison of NMR and MS in Metabolomics
| Characteristic | Nuclear Magnetic Resonance (NMR) | Mass Spectrometry (MS) |
|---|---|---|
| Basis of Detection | Nuclear spin in a magnetic field | Mass-to-charge ratio (m/z) of ions |
| Sensitivity | Low (µM to mM) [101] [100] | High (fM to aM) [100] |
| Quantitation | Excellent; inherently quantitative [102] [100] | Challenging; affected by ion suppression [54] [100] |
| Structural Elucidation | Powerful; provides atomic connectivity and molecular structure [102] | Limited; infers structure from mass and fragments [54] |
| Sample Destruction | Non-destructive [54] [102] | Destructive [54] |
| Throughput | Relatively high; minimal sample prep [100] | Lower; often requires chromatography [100] |
| Key Strength | Reproducibility, quantitation, isotope positioning, in vivo capability [26] [102] | Sensitivity, high resolution, broad dynamic range [101] [100] |
| Primary Limitation | Limited sensitivity and spectral resolution [101] | Ion suppression, matrix effects, semi-quantitative nature [100] |
This complementarity is clearly evidenced in experimental data. In a study on Chlamydomonas reinhardtii, a combined approach identified 102 metabolites: 82 by GC-MS, 20 by NMR, and 22 by both techniques [101]. Critically, of the 47 metabolites that were significantly perturbed by treatment, 14 were uniquely identified by NMR and 16 were uniquely identified by GC-MS [101]. This demonstrates that relying on a single technique would have missed a substantial portion of the relevant biological information.
Stable Isotope-Resolved Metabolomics (SIRM): A Prime Application
Stable Isotope-Resolved Metabolomics (SIRM) is a powerful approach for delineating metabolic pathways and fluxes in living systems by tracking the incorporation of stable isotopes (e.g., ¹³C, ¹⁵N) into metabolites [26] [57]. It is particularly valuable in disease research, such as cancer metabolism, where understanding pathway rewiring is crucial [26] [90]. In SIRM, the complementary strengths of NMR and MS are not just beneficial but essential for obtaining a complete picture.
NMR excels at determining positional isotopomers—the specific atomic positions within a molecule that are enriched with a label. This is achieved by analyzing the hyperfine splitting of signals in ¹³C NMR spectra, where a labeled carbon atom will produce a singlet, doublet, or triplet based on the labeling state of its neighbors [26] [57]. This information is critical for mapping the precise path a tracer atom takes through a metabolic network. Conversely, MS is exceptionally powerful for measuring isotopologue distributions—the different mass variants of a molecule caused by the number of incorporated heavy isotopes, regardless of position [26]. The combination of both isotopomer and isotopologue data enables rigorous cross-validation and provides the most detailed view of metabolic flux [26].
Table 2: Complementary Role of NMR and MS in Stable Isotope Labeling Experiments
| Aspect | NMR Contribution | MS Contribution |
|---|---|---|
| Isotope Detection | Detects specific nuclei (¹³C, ¹⁵N); can distinguish multiple tracer atoms [26] | Detects mass differences; multiplexing requires UHR-FTMS [26] |
| Key Information | Positional Isotopomers: Labeling at specific atomic positions [26] [57] | Isotopologues: Number of labeled atoms per molecule [26] |
| Quantification | Direct from signal intensity; absolute quantitation possible [102] | Relative abundance; requires calibration and is susceptible to matrix effects [100] |
| Specialty Analyses | In vivo tracking (e.g., with hyperpolarization); spectral editing for specific compound classes (e.g., ¹H{³¹P} for phosphometabolites) [26] | Tandem MS (MS/MS) for improved selectivity and accurate isotopologue distribution of fragments [90] |
| Metabolite Identification | Unmatched for de novo structure elucidation of unknowns [102] | Molecular formula and fragment pattern analysis [54] |
Case Studies in Combined Workflows
Case Study 1: Unveiling Metabolic Perturbations in Algae
A seminal study treating Chlamydomonas reinhardtii with lipid accumulation modulators provides a clear example of the combined approach's power [101].
- Experimental Protocol: Cells were grown in ¹³C₂-acetate medium and treated with compounds WD30030 and WD10784. The aqueous metabolites were extracted and analyzed in parallel.
- NMR Analysis: ¹D ¹H and 2D ¹H-¹³C HSQC NMR spectra were acquired on a spectrometer. Data were processed with NMRpipe and analyzed with NMRviewJ, with metabolite assignments made using the Biological Magnetic Resonance Bank (BMRB) database [101].
- GC-MS Analysis: Samples were derivatized and analyzed by GC-MS. The eRah package was used for peak picking, retention time alignment, and metabolite identification via the GOLM database [101].
- Data Integration: The datasets were fused using Multiblock Principal Component Analysis (MB-PCA), which created a single statistical model from both analytical blocks, allowing for the identification of key metabolite differences irrespective of the source method [101].
- Key Finding: The combined approach informed on the activity of central carbon metabolism pathways (oxidative pentose phosphate pathway, Calvin cycle, TCA cycle), leading to fatty acid synthesis. NMR identified key metabolites like acetate and malate that were missed by MS, while GC-MS detected others like fructose-6-phosphate and fumarate [101].
Case Study 2: Diagnosing Human Disease with Salivary Metabolomics
Research into non-cancerous human diseases, such as periodontal disease, diabetes, and viral infections like pharyngitis, has benefited from NMR-based salivary metabolomics [103]. The protocol highlights considerations for a robust workflow that can be coupled with MS.
- Experimental Protocol:
- Sample Collection: Whole mouth saliva (WMS) is collected after a recommended abstention period of 2-4 hours (or longer) from oral activities to avoid dietary interferents [103].
- Sample Processing: WMS is centrifuged to obtain a cell-free supernatant (WMSS). The use of microbicidal agents is recommended to sustain metabolite integrity [103].
- NMR Analysis: ¹H NMR with water suppression pulse sequences is standard. 2D NMR experiments are used for confident resonance assignment. Special attention is given to factors like the acute-phase protein region and distinguishing host vs. oral microbiome metabolite origins [103].
- Pathway to Integration: This well-characterized NMR workflow provides a foundation for complementary MS analysis. A sequential analysis protocol has been demonstrated for blood serum, where a single aliquot is prepared for NMR analysis first, and the same sample can subsequently be analyzed by multiple LC-MS platforms, maximizing information from minimal sample volume [104].
Case Study 3: Identifying Bioactives in Natural Products via Biochemometrics
A study on Buddleja officinalis Maxim. used a combined "biochemometrics" approach to identify constituents active against dry eye disease pathology [105].
- Experimental Protocol:
- NMR-based Biochemometrics: ¹H NMR spectra were analyzed using Heterocovariance Analysis (HetCA) as part of the ELINA approach to correlate spectral features with bioactivity [105].
- MS-based Biochemometrics: A molecular network was generated from MS data to achieve the same goal.
- Data Integration: The results from both parallel analyses were combined, increasing the power to unambiguously identify the bioactive constituents.
- Key Finding: The combined workflow confirmed phenylethanoid glycosides and triterpene saponins as the main contributors to the plant extract's antioxidant and cytotoxic effects, with increased confidence [105].
Data Fusion Strategies for Integrated NMR and MS Data
Simply acquiring NMR and MS data in parallel is a first step; true integration is achieved through data fusion (DF) strategies, which can be categorized into three levels [54].
Data Fusion Workflow
This diagram illustrates the three primary strategies for fusing NMR and MS data.
- Low-Level Data Fusion (LLDF): The most straightforward approach, it involves the direct concatenation of raw or pre-processed data matrices from NMR and MS into a single, large matrix [54]. This method requires careful intra- and inter-block scaling (e.g., Pareto scaling) to ensure one technique does not dominate the model due to higher variance [54]. Analysis then proceeds using multiblock algorithms like MB-PCA [101] [54].
- Mid-Level Data Fusion (MLDF): This strategy first reduces the dimensionality of each dataset independently using methods like Principal Component Analysis (PCA). The extracted features (e.g., PCA scores) are then concatenated into a new, smaller matrix for final analysis [54]. This effectively handles the "large variables, small samples" problem common in metabolomics.
- High-Level Data Fusion (HLDF): The most complex strategy, HLDF involves building separate classification or regression models for the NMR and MS data. The predictions or decisions from these individual models are then combined using rules (e.g., weighted voting, Bayesian integration) to produce a final, consensus result [54].
The Scientist's Toolkit: Essential Reagents and Materials
Successful combined MS/NMR metabolomics, especially SIRM, relies on a suite of specialized reagents and materials.
Table 3: Key Research Reagent Solutions for Combined MS/NMR Studies
| Item | Function/Description | Example Application |
|---|---|---|
| Stable Isotope Tracers | Commercially available ¹³C-, ¹⁵N-, or ²H-labeled precursors to track metabolic fate. | [U-¹³C]-Glucose for glycolysis/TCA cycle; [U-¹³C,¹⁵N]-Glutamine for glutaminolysis [26]. |
| Deuterated NMR Solvents | Solvents like D₂O containing deuterium for NMR field-frequency locking without significant ¹H interference. | Preparing samples for NMR analysis in a non-protonated solvent [104]. |
| Internal Standards | Compounds added in known quantities for quantification and spectral calibration. | DSS or TSP for NMR quantitation; stable isotope-labeled internal standards for MS [103]. |
| Metabolite Databases | Reference libraries of NMR and MS spectra for metabolite identification. | BMRB for NMR reference spectra; GOLM, HMDB for MS data [101] [100]. |
| Protein Removal Kits | Molecular weight cut-off (MWCO) filters or solvent precipitation kits. | Essential sample preparation step for LC-MS and often for NMR to simplify spectra and prevent spoiling [104]. |
| Derivatization Reagents | Chemicals that alter metabolite properties for improved chromatography/volatility. | Used for GC-MS analysis of non-volatile metabolites (e.g., silylation) [101]. |
The evidence from foundational principles, technical comparisons, and concrete case studies overwhelmingly supports the combined use of MS and NMR for a comprehensive and rigorous metabolomic analysis. While MS offers unparalleled sensitivity, and NMR provides unmatched quantitative and structural capabilities, their true potential is realized when they are used together. The emerging methodologies for data fusion, coupled with standardized protocols for sequential sample analysis, are paving the way for this integrated approach to become the new gold standard. For researchers in drug development and systems biology, adopting a combined MS/NMR strategy is not merely an option but a necessity to fully illuminate the complexity of biological systems and disease mechanisms.
Conclusion
The choice between MS and NMR for isotopic labeling is not a matter of superiority but of strategic application. MS offers unparalleled sensitivity for high-throughput quantification and flux analysis in complex metabolomic and proteomic studies, often at single-cell resolution. NMR provides unmatched atomic-level structural information and is inherently quantitative, making it ideal for detailed biomolecular interaction and structural studies. The most powerful approach often involves leveraging both techniques complementarily, using MS for broad screening and quantification, followed by NMR for detailed structural validation. Future directions point towards increased integration of these platforms, development of more sophisticated multiplexed labeling reagents, and computational advances for handling complex, multi-dimensional data, promising even deeper insights into biological systems and accelerating drug discovery pipelines.
References
- 1. Combining Mass Spectrometry (MS) and Nuclear Magnetic ... [https://pmc.ncbi.nlm.nih.gov/articles/PMC6601463/]
- 2. The Future of NMR-Based Metabolomics - PMC [https://pmc.ncbi.nlm.nih.gov/articles/PMC5305426/]
- 3. The strengths and weaknesses of NMR spectroscopy ... [https://pure.kfupm.edu.sa/en/publications/the-strengths-and-weaknesses-of-nmr-spectroscopy-and-mass-spectro/]
- 4. On the part that NMR should play in mass spectrometry ... [https://www.frontiersin.org/journals/natural-products/articles/10.3389/fntpr.2024.1359151/full]
- 5. Advances in Isotope Labeling for Solution Nucleic Acid ... [https://pmc.ncbi.nlm.nih.gov/articles/PMC12261052/]
- 6. Advancing quantitative NMR for high-precision isotopic ... [https://www.sciencedirect.com/science/article/abs/pii/S1090780725001636]
- 7. High-Accuracy Quantitative Nuclear Magnetic Resonance ... [https://pmc.ncbi.nlm.nih.gov/articles/PMC12509184/]
- 8. Quantitative 1H-NMR spectroscopy identifies metabolites ... [https://www.nature.com/articles/s41598-025-12305-y]
- 9. Specific isotopic labelling and reverse labelling for protein ... [https://pmc.ncbi.nlm.nih.gov/articles/PMC9788560/]
- 10. Unlocking the Potential of Isotopic Labeling in ... [https://www.musechem.com/blog/unlocking-the-potential-of-isotopic-labeling-in-pharmaceutical-research/?srsltid=AfmBOopOxjU2UkP5qqqCESm3td-iqCoGZ9EChsYGdCSqStHMeTAOnXF1]
- 11. Isotope Labeling Techniques: A Comprehensive Guide ... [https://www.metwarebio.com/isotope-labeling-guide-applications/]
- 12. Isotope Labeling for Solution and Solid-State NMR ... [https://pmc.ncbi.nlm.nih.gov/articles/PMC3555569/]
- 13. Recent applications of isotopic labeling for protein NMR in ... [https://pubmed.ncbi.nlm.nih.gov/23480844/]
- 14. Towards cost-effective side-chain isotope labelling of ... [https://link.springer.com/article/10.1007/s10858-024-00447-6]
- 15. High-Throughput Indirect Quantitation of 13C Enriched ... [https://pmc.ncbi.nlm.nih.gov/articles/PMC5148664/]
- 16. A Chemoselective 15N Tag for Sensitive and High ... [https://pmc.ncbi.nlm.nih.gov/articles/PMC2861042/]
- 17. Current and Potential Applications of Clinical 13C MR ... [https://jnm.snmjournals.org/content/49/3/341]
- 18. Applications of high-field nuclear magnetic resonance ... [https://www.sciencedirect.com/science/article/pii/S2666441025000159]
- 19. Applications of quantitative 13C NMR in pharmaceutical ... [https://www.sciencedirect.com/science/article/pii/S2095177925001637]
- 20. Isotopic labelling analysis using single cell mass spectrometry [https://pubs.rsc.org/en/content/articlehtml/2025/an/d5an00657k]
- 21. 15 N optimal control pulses: an efficient approach to ... [https://www.sciencedirect.com/science/article/pii/S1090780725001442]
- 22. Comparison of Low-Rank Denoising Methods for Dynamic ... [https://pubmed.ncbi.nlm.nih.gov/40887895/]
- 23. Ground-breaking comparison of target stable isotope ratios ... [https://www.sciencedirect.com/science/article/pii/S0308814625009069]
- 24. The strengths and weaknesses of NMR spectroscopy ... [https://pubmed.ncbi.nlm.nih.gov/25677154/]
- 25. Comparison of NMR and MS | Metabolomics [https://www.ebi.ac.uk/training/online/courses/metabolomics-introduction/designing-a-metabolomics-study/comparison-of-nmr-and-ms/]
- 26. NMR and MS-based Stable Isotope-Resolved Metabolomics ... [https://pmc.ncbi.nlm.nih.gov/articles/PMC7286614/]
- 27. Comparison of IRMS and NMR spectrometry for the ... [https://www.sciencedirect.com/science/article/abs/pii/S0039914012004031]
- 28. Nuclear magnetic resonance and liquid chromatography ... [https://www.sciencedirect.com/science/article/abs/pii/S0003267008018795]
- 29. A Targeted 1H-NMR Comparison of OCB Type 1 and ... [https://pubmed.ncbi.nlm.nih.gov/40954342/]
- 30. Spatial single-cell isotope tracing reveals heterogeneity of ... [https://www.nature.com/articles/s42255-024-01118-4]
- 31. A graph neural network model to estimate cell-wise metabolic ... [https://pmc.ncbi.nlm.nih.gov/articles/PMC8494226/]
- 32. Comparison of Quantitative Metabolite Imaging Tools and ... [https://pmc.ncbi.nlm.nih.gov/articles/PMC3000467/]
- 33. Accurate and rapid determination of metabolic flux by deep ... [https://pmc.ncbi.nlm.nih.gov/articles/PMC10659294/]
- 34. Inferring Metabolic Flux from Gene Expression Data Using ... [https://pubmed.ncbi.nlm.nih.gov/40779111/]
- 35. SIMPEL: using stable isotopes to elucidate dynamics of ... [https://www.nature.com/articles/s42003-024-05844-z]
- 36. Isotope Labeling [https://cernobioscience.com/isotope-labeling/]
- 37. Segmental and site-specific isotope labelling strategies for ... [https://pubs.rsc.org/en/content/articlehtml/2021/cb/d1cb00045d]
- 38. Specific isotopic labelling and reverse labelling for protein ... [https://pubmed.ncbi.nlm.nih.gov/36382942/]
- 39. NMR-based Isotope Editing, Chemoselection and Isotopomer ... [https://pmc.ncbi.nlm.nih.gov/articles/PMC9539636/]
- 40. Metabolite Annotation through Stable Isotope Labeling [https://www.sciencedirect.com/science/article/abs/pii/S016599362400520X]
- 41. , Comparing and iTRAQ | Silantes TMT SILAC [https://silantes.com/itraq-tmt-silac/]
- 42. Advantages and Disadvantages of iTRAQ, TMT, and SILAC ... [https://www.mtoz-biolabs.com/advantages-and-disadvantages-of-itraq-tmt-and-silac-in-protein-quantification.html]
- 43. Benchmarking stable isotope labeling based quantitative proteomics [https://pubmed.ncbi.nlm.nih.gov/23085607/]
- 44. iTRAQ Labeling is Superior to mTRAQ for Quantitative Global ... [https://pmc.ncbi.nlm.nih.gov/articles/PMC3433912/]
- 45. State-of-the-Art and Future Directions in Structural Proteomics [https://pmc.ncbi.nlm.nih.gov/articles/PMC12546877/]
- 46. 2025 Proteomics Breakthroughs [https://www.genengnews.com/topics/drug-discovery/2025-proteomics-breakthroughs/]
- 47. Discovery Research vs Hypothesis Testing: Sherlock Holmes ... [https://mountsinaiexposomics.org/murder-mystery-part-one/]
- 48. NMR-based metabolomics: Where are we now and where ... [https://www.sciencedirect.com/science/article/abs/pii/S0079656525000081]
- 49. Discovery–Versus Hypothesis–Driven Detection of Protein ... [https://pmc.ncbi.nlm.nih.gov/articles/PMC8123138/]
- 50. Mass-spectrometry based metabolomics - PubMed Central - NIH [https://pmc.ncbi.nlm.nih.gov/articles/PMC12105183/]
- 51. A Tutorial Review of Labeling Methods in Mass ... [https://pmc.ncbi.nlm.nih.gov/articles/PMC11342459/]
- 52. 2025 Pharma Trends: Structure elucidation services by NMR [https://resolvemass.ca/structure-elucidation-services-by-nmr/]
- 53. NMR-based isotopic and isotopomic analysis [https://www.sciencedirect.com/science/article/abs/pii/S0079656520300224]
- 54. Integrating NMR and MS for Improved Metabolomic Analysis [https://www.mdpi.com/1420-3049/30/12/2624]
- 55. Advances and challenges in preparing membrane proteins ... [https://www.sciencedirect.com/science/article/abs/pii/S0734975024001770]
- 56. Enhanced Site-Specific Fluorescent Labeling of Membrane ... [https://pmc.ncbi.nlm.nih.gov/articles/PMC11852578/]
- 57. Isotopic labeling [https://en.wikipedia.org/wiki/Isotopic_labeling]
- 58. Unveiling cellular communications through rapid pan- ... [https://www.nature.com/articles/s41467-025-58779-2]
- 59. Sample preparation in global metabolomics of biological ... [https://www.sciencedirect.com/science/article/abs/pii/B9780128186077000049]
- 60. Cell Sample Collection & Metabolite Extraction in ... [https://metabolomics.creative-proteomics.com/resource/cell-sample-collection-quenching-and-metabolite-extraction-in-metabolomics.htm]
- 61. Quenching methods for the analysis of intracellular ... [https://pubmed.ncbi.nlm.nih.gov/24297418/]
- 62. How NMR and MS Are Used in Custom Radiolabeling [https://www.moravek.com/how-nmr-and-ms-are-used-in-custom-radiolabeling/]
- 63. Critical assessment of quenching and extraction/sample ... [https://pubmed.ncbi.nlm.nih.gov/40082321/]
- 64. 19F NMR study of proteins with parallel incorporation ... [https://www.sciencedirect.com/science/article/pii/S277251622500018X]
- 65. Ion Suppression: A Major Concern in Mass Spectrometry [https://www.chromatographyonline.com/view/ion-suppression-major-concern-mass-spectrometry]
- 66. High-resolution NMR spectroscopy for measuring complex ... [https://pubs.rsc.org/en/content/articlelanding/2023/cp/d2cp04279g]
- 67. Relaxation Editing in NMR Using a New Two-Dimensional ... [https://pubmed.ncbi.nlm.nih.gov/38727639/]
- 68. Fast and shift-insensitive similarity comparisons of NMR ... [https://www.sciencedirect.com/science/article/abs/pii/S0169743913001032]
- 69. New Features and Updates | NMR Predictors Version 2025 [https://www.acdlabs.com/technical-support/current-software-versions/nmr-predictors/]
- 70. Ion suppression in liquid chromatography–mass ... [https://en.wikipedia.org/wiki/Ion_suppression_in_liquid_chromatography%E2%80%93mass_spectrometry]
- 71. Ion suppression correction and normalization for non- ... [https://www.nature.com/articles/s41467-025-56646-8]
- 72. NMR Based Methods for Metabolites Analysis - PMC [https://pmc.ncbi.nlm.nih.gov/articles/PMC11923949/]
- 73. Detecting Low Abundance Proteins in Western Blotting [https://www.thermofisher.com/us/en/home/life-science/protein-biology/protein-biology-learning-center/protein-biology-resource-library/pierce-protein-methods/detecting-low-abundance-proteins-in-western-blotting.html]
- 74. Western blot protocol for low abundance proteins [https://www.abcam.com/en-us/technical-resources/protocols/western-blot-protocol-for-low-abundance-proteins]
- 75. Strategies for Characterization of Low-Abundant Intact ... - PMC [https://pmc.ncbi.nlm.nih.gov/articles/PMC7102702/]
- 76. Amino acid selective unlabeling for sequence specific ... [https://pmc.ncbi.nlm.nih.gov/articles/PMC3020294/]
- 77. Amino Acid Selective Unlabeling in Protein NMR ... [https://www.sciencedirect.com/science/article/abs/pii/S0076687915003067]
- 78. Systems-Level Analysis of Isotopic Labeling in Untargeted ... [https://pmc.ncbi.nlm.nih.gov/articles/PMC7323898/]
- 79. Isotopic Labeling | Chemical Catalysis for Bioenergy ... [https://www.chemcatbio.org/capabilities/characterization/isotopic-labeling]
- 80. INCA 2.0: a tool for integrated, dynamic modeling of NMR- and ... [https://pmc.ncbi.nlm.nih.gov/articles/PMC8789327/]
- 81. Beyond the Paradigm: Combining Mass Spectrometry and ... [https://pmc.ncbi.nlm.nih.gov/articles/PMC5448308/]
- 82. INCA 2.0: A tool for integrated, dynamic modeling of NMR [https://www.sciencedirect.com/science/article/abs/pii/S1096717621001956]
- 83. MetaboLabPy—An Open-Source Software Package for ... [https://www.mdpi.com/2218-1989/15/1/48]
- 84. Mnova MSChrom [https://mestrelab.com/main-product/mschrom]
- 85. Recent Advances in Liquid Chromatography–Mass ... [https://pmc.ncbi.nlm.nih.gov/articles/PMC12204688/]
- 86. Stable isotope dimethyl labeling [https://www.selectscience.net/resource/stable-isotope-dimethyl-labeling]
- 87. Specific isotopic labeling of methyl groups has extended ... [https://www.selectscience.net/article/specific-isotopic-labeling-of-methyl-groups-has-extended-the-molecular-weight-limits-for-nmr-studies]
- 88. Absolute vs. Relative Quantification for qPCR [https://www.thermofisher.com/us/en/home/life-science/pcr/real-time-pcr/real-time-pcr-learning-center/real-time-pcr-basics/absolute-vs-relative-quantification-real-time-pcr.html]
- 89. Absolute & Relative Quant. [https://www.utmb.edu/msf/small-molecules/absolute-relative-quant]
- 90. Tandem mass spectrometry for measuring stable-isotope ... [https://www.sciencedirect.com/science/article/abs/pii/S0958166912001668]
- 91. Relative versus absolute RNA quantification [https://pmc.ncbi.nlm.nih.gov/articles/PMC7883443/]
- 92. Isotope Labeling - an overview [https://www.sciencedirect.com/topics/immunology-and-microbiology/isotope-labeling]
- 93. NMR-Guided Mass Spectrometry for Absolute Quantitation ... [https://pmc.ncbi.nlm.nih.gov/articles/PMC6260976/]
- 94. The Advantages of Stable Isotope-Labeld Nucleic Acids [https://silantes.com/advantages-stable-isotope-labeled-nucleic-acids/]
- 95. Metabolite quantification by NMR and LC-MS/MS reveals ... [https://www.sciencedirect.com/science/article/abs/pii/S0731708516313085]
- 96. Stable Isotope Labeling Strategies [https://proteomicsresource.washington.edu/protocols03/isotopic_labeling.php]
- 97. How much does an NMR cost | 2021 guide [https://www.aiinmr.com/nmr-spectroscopy-q-a-blog/How-much-does-an-Eft-NMR-Cost/]
- 98. Rates - NMR and Chemistry MS Facilities - Cornell University [https://nmr.chem.cornell.edu/facility-info/rates/]
- 99. A comparison of high-throughput plasma NMR protocols ... [https://pmc.ncbi.nlm.nih.gov/articles/PMC7196944/]
- 100. Combining mass spectrometry and nuclear magnetic ... [https://www.sciencedirect.com/science/article/abs/pii/S0079656516300656]
- 101. Combining Mass Spectrometry and NMR Improves Metabolite ... [https://pmc.ncbi.nlm.nih.gov/articles/PMC6668615/]
- 102. The future of NMR-based metabolomics [https://www.sciencedirect.com/science/article/pii/S0958166916301768]
- 103. Updates and Original Case Studies Focused on the NMR ... [https://pmc.ncbi.nlm.nih.gov/articles/PMC9864626/]
- 104. Integrating NMR and multi-LC-MS-based untargeted ... [https://www.sciencedirect.com/science/article/pii/S0003267025003733]
- 105. A Case Study on Buddleja officinalis [https://pubmed.ncbi.nlm.nih.gov/39503999/]