Overcoming NADPH Limitation: Engineered Pathways for Advanced Bioproduction and Therapeutics
This article provides a comprehensive analysis of cutting-edge strategies to overcome NADPH limitation, a critical bottleneck in metabolic engineering and therapeutic development.
Overcoming NADPH Limitation: Engineered Pathways for Advanced Bioproduction and Therapeutics
Abstract
This article provides a comprehensive analysis of cutting-edge strategies to overcome NADPH limitation, a critical bottleneck in metabolic engineering and therapeutic development. Tailored for researchers, scientists, and drug development professionals, it explores the foundational role of NADPH in redox balance and biosynthesis. The scope spans from static and dynamic metabolic engineering methodologies to advanced troubleshooting techniques like CRISPRi screening and computational pathway design. It further validates these approaches through comparative analysis of their applications in producing value-added chemicals, enhancing photosynthetic efficiency, and inducing novel cell death mechanisms in cancer, synthesizing key insights to guide future research and clinical translation.
The Critical Role of NADPH: Understanding Redox Balance and Biosynthetic Limits
Troubleshooting Common NADPH Limitation Issues in Engineered Pathways
FAQ 1: My microbial cell factory shows poor yield of my target compound, suspected to be due to insufficient NADPH supply. What are the primary metabolic engineering strategies I can employ to enhance NADPH regeneration?
Insufficient NADPH availability is a common bottleneck in biotransformation processes. You can employ both static and dynamic regulation strategies to enhance NADPH regeneration [1]:
Static Regulation Strategies:
- Modulate the Pentose Phosphate Pathway (PPP): Overexpress key PPP enzymes like glucose-6-phosphate dehydrogenase (
G6PD/zwf) and 6-phosphogluconate dehydrogenase (6PGD/gnd) to direct carbon flux toward NADPH generation [1] [2]. - Heterologous Enzyme Expression: Introduce NADP-dependent enzymes from other species, such as NADP-dependent glyceraldehyde-3-phosphate dehydrogenase (
GAPDH) from Clostridium acetobutylicum or isocitrate dehydrogenases (IDH) from Corynebacterium glutamicum [2] [3]. - Overexpress Transhydrogenases: Amplify the membrane-bound (
pntAB) or soluble (udhA) transhydrogenases to facilitate the transfer of reducing equivalents from NADH to NADP+ [2]. - Express NADH Kinase: Use NADH kinases (e.g., from Saccharomyces cerevisiae) to directly phosphorylate NADH to NADPH, creating a direct route for NADPH synthesis [2].
- Modulate the Pentose Phosphate Pathway (PPP): Overexpress key PPP enzymes like glucose-6-phosphate dehydrogenase (
Dynamic Regulation Strategies:
- Employ Biosensors: Utilize genetically encoded biosensors (e.g., based on the transcription factor SoxR or the roGFP2-based NERNST sensor) to monitor the intracellular NADPH/NADP+ ratio in real-time and dynamically regulate pathway expression [1].
- Leverage Native Pathway Dynamics: In some bacteria like Pseudomonas putida, the natural cyclicity of the Entner-Doudoroff (ED) pathway can be harnessed to dynamically adjust NADPH supply between growth and production phases [1].
FAQ 2: I have engineered a pathway for NADPH regeneration, but my cells are experiencing growth defects or redox imbalance. How can I diagnose and resolve this?
An imbalance in the NADPH/NADP+ ratio often causes growth defects. This can occur if NADPH is over-produced without sufficient consumption, leading to reductive stress, or if consumption outstrips regeneration [1] [4].
Diagnosis:
- Use Biosensors: Implement the NERNST biosensor to directly monitor the NADPH/NADP+ redox status in your cells [1].
- Measure By-product Secretion: Analyze the extracellular medium for secretion of metabolites like acetate or other overflow metabolites, which can indicate an imbalance in cofactor ratios [2].
Resolution:
- Fine-tune Gene Expression: Avoid strong, constitutive promoters. Use promoter and RBS engineering to precisely modulate the expression levels of NADPH-regenerating enzymes to match the demand of your biosynthetic pathway [1].
- Couple Regeneration with Consumption: Ensure your product pathway has sufficient flux to consume the NADPH being generated. You may need to optimize the expression of pathway enzymes to create a balanced system [5].
- Consider Alternative Pathways: If one NADPH-generation route causes imbalance, explore others. For example, a synthetically engineered Entner–Doudoroff pathway was shown to increase NADPH regeneration by 25-fold and improve terpenoid titer by 97% without causing significant growth defects [5].
FAQ 3: The productivity of my NADPH-dependent pathway declines significantly during scaled-up fermentation. What factors should I investigate?
Scale-up issues often relate to inhomogeneous conditions and changing metabolic states.
- Investigate Nutrient Gradients: In large-scale bioreactors, gradients of glucose and oxygen can form. High, fluctuating glucose levels can repress the PPP, while oxygen limitation can affect NADPH oxidases and other oxygen-dependent processes [6] [3].
- Solution: Implement controlled feeding strategies to avoid glucose repression and maintain a steady, low concentration of the carbon source to favor the PPP.
- Monitor Oxidative Stress: The target product or pathway intermediates might be inducing oxidative stress at high cell densities, diverting NADPH toward antioxidant defense and away from production [7].
- Check for Genetic Instability: The engineered pathway may impose a metabolic burden, leading to plasmid loss or mutation accumulation over long fermentation times.
- Solution: Use genome integration instead of plasmid-based expression and conduct serial passage experiments to test the genetic stability of your production strain.
Quantitative Comparison of NADPH-Generating Systems
The table below summarizes the key NADPH-generating pathways and their characteristics to aid in selecting the most appropriate strategy for your application.
Table 1: Key NADPH-Generating Pathways and Enzymes in Prokaryotes and Eukaryotes
| Pathway/Enzyme | Reaction Catalyzed | Localization | Relative Contribution/Notes | Engineering Example |
|---|---|---|---|---|
| Oxidative Pentose Phosphate Pathway (PPP) [7] [3] | Glucose-6-P → 6-P-Gluconolactone + NADPH6-P-Gluconate → Ribulose-5-P + CO₂ + NADPH | Cytosol | Major source in cytosol. Provides pentose sugars and NADPH. | Overexpression of zwf (G6PDH) and gnd (6PGD) enhanced PHB and lycopene production [2]. |
| Malic Enzyme (ME1) [7] | Malate → Pyruvate + CO₂ + NADPH | Cytosol | Significant source, links TCA cycle with NADPH production. | Cytosolic ME1 is a key contributor in some cancer cells and can be engineered for fatty acid synthesis [7]. |
| Isocitrate Dehydrogenase (IDH1/IDH2) [7] [3] | Isocitrate → α-Ketoglutarate + CO₂ + NADPH | Cytosol (IDH1)Mitochondria (IDH2) | Major source in mitochondria and cytosol. | Heterologous expression of C. glutamicum IDH in E. coli improved NADPH supply [2]. |
| Ferredoxin-NADP+ Reductase [8] | Ferredoxin({red}) + NADP+ → Ferredoxin({ox}) + NADPH | Chloroplasts (plants), Cyanobacteria | Primary source in photosynthetic organisms. | Not typically used in non-photosynthetic cell factories. |
| Membrane-bound Transhydrogenase (PntAB) [2] [3] | NADH + NADP+ + H(^+)({in}) → NAD+ + NADPH + H(^+)({out}) | Membrane (prokaryotes)Inner Mitochondrial Membrane (eukaryotes) | Proton-gradient driven; converts NADH to NADPH. | Overexpression of pntAB in E. coli improved lycopene and PHB production [2]. |
| NAD+ Kinase (NADK) [7] | NAD+ + ATP → NADP+ + ADP | Cytosol, Mitochondria | Synthesizes NADP+, the precursor for NADPH. | An NADK mutant (I90F) found in cancer cells has higher activity, increasing NADPH levels [7]. Overexpression enhances NADPH supply [2]. |
Experimental Protocols for Analyzing NADPH Metabolism
Protocol 1: Quantifying Intracellular NADPH/NADP+ Pools Using Enzymatic Cycling Assays
This protocol provides a method for determining the absolute levels of NADPH and NADP+ in cell extracts, allowing for the calculation of the NADPH/NADP+ ratio, a key indicator of the cellular redox state [4].
Principle: NADPH is used to reduce a specific substrate in a reaction catalyzed by a dehydrogenase enzyme. The reaction product then cycles with a tetrazolium dye to form a formazan product, which can be measured spectrophotometrically. The assay is performed with and without a pre-treatment step that selectively destroys NADP+, allowing for the separate quantification of NADPH and total NADP(H).
Materials:
- NADP/NADPH Quantification Kit: Commercial kits are available (e.g., from Sigma-Aldrich or BioAssay Systems).
- Lysis Buffer: Typically provided in the kit, often containing a detergent to disrupt cells and a base (for NADP+ extraction) or acid (for NADPH extraction).
- Stop Solution: Neutralizes the extraction buffer.
- Enzyme Mix: Contains glucose-6-phosphate dehydrogenase (G6PDH) and diaphorase.
- Development Buffer: Contains glucose-6-phosphate, tetrazolium dye, and other necessary cofactors.
- Microplate Reader: Capable of measuring absorbance at 450 nm or 565 nm.
Procedure:
- Cell Harvesting and Extraction:
- Rapidly quench metabolism by quickly cooling the culture and centrifuging at 4°C.
- For NADPH extraction: Resuspend the cell pellet in ice-cold Acidic Lysis Buffer (e.g., 0.1 M HCl). This destroys NADP+ while preserving NADPH.
- For Total NADP(H) extraction: Resuspend a separate pellet in Basic Lysis Buffer (e.g., 0.1 M NaOH). This destroys NADPH while preserving NADP+.
- Incubate on ice for 10-15 minutes, then neutralize with the respective Stop Solution.
- Centrifuge at high speed to remove cell debris and collect the supernatant for assay.
Enzymatic Reaction:
- Prepare the reaction mix according to the kit instructions. It will typically contain the development buffer and enzyme mix.
- Add your extracted samples (for NADPH and total NADP(H)) to the reaction mix in a 96-well plate.
- Incubate at room temperature for 10-60 minutes, protected from light, until the color develops.
Measurement and Calculation:
- Measure the absorbance of the formazan product at the recommended wavelength (e.g., 450 nm).
- Generate a standard curve using known concentrations of NADPH provided in the kit.
- Calculate NADPH concentration from the acidic extract.
- Calculate total NADP(H) concentration from the basic extract.
- Determine NADP+ concentration by subtracting the NADPH value from the total NADP(H) value.
- Calculate the NADPH/NADP+ ratio.
Protocol 2: Real-Time Monitoring of NADPH/NADP+ Ratio Using Genetically Encoded Biosensors
This protocol describes the use of the NERNST biosensor for real-time, non-invasive monitoring of the NADPH/NADP+ redox status in live cells [1].
Principle: The NERNST biosensor is a ratiometric biosensor constructed from a redox-sensitive green fluorescent protein (roGFP2) coupled to the Escherichia coli NADPH-thioredoxin reductase C (TrxR C) module. Changes in the NADPH/NADP+ pool alter the redox state of roGFP2, causing a shift in its excitation spectrum. Ratiometric measurement (excitation at 400 nm / 480 nm, emission at 510 nm) provides a readout that is independent of sensor concentration and laser intensity.
Materials:
- Plasmid Vector: Expressing the NERNST biosensor (e.g., pNERNST for your host organism).
- Host Strain: Your engineered production strain (e.g., E. coli, yeast).
- Microplate Reader or Fluorescence Spectrometer: With dual-excitation capabilities.
- Culture Media: Appropriate for your host strain.
Procedure:
- Strain Transformation:
- Introduce the pNERNST plasmid into your host production strain using standard transformation protocols (e.g., heat shock for E. coli, lithium acetate for yeast).
Cultivation and Measurement:
- Inoculate transformed cells into culture media in a transparent 96-well plate or quartz cuvette.
- Place the culture in the pre-warmed (e.g., 37°C for E. coli) microplate reader or spectrometer.
- Program the instrument to take periodic measurements: excite at 400 nm and 480 nm, and record the emission at 510 nm for each excitation.
- The ratio of fluorescence (Ex400/Ex480) is directly proportional to the NADPH/NADP+ redox status.
Data Analysis:
- Plot the ratio (Ex400/Ex480) over time to observe dynamic changes in NADPH levels during growth and production phases.
- The biosensor can be used to compare the redox status of different engineered strains or to monitor the impact of process perturbations (e.g., nutrient feeding, induction) in real-time.
Visualization of NADPH Metabolism and Engineering Strategies
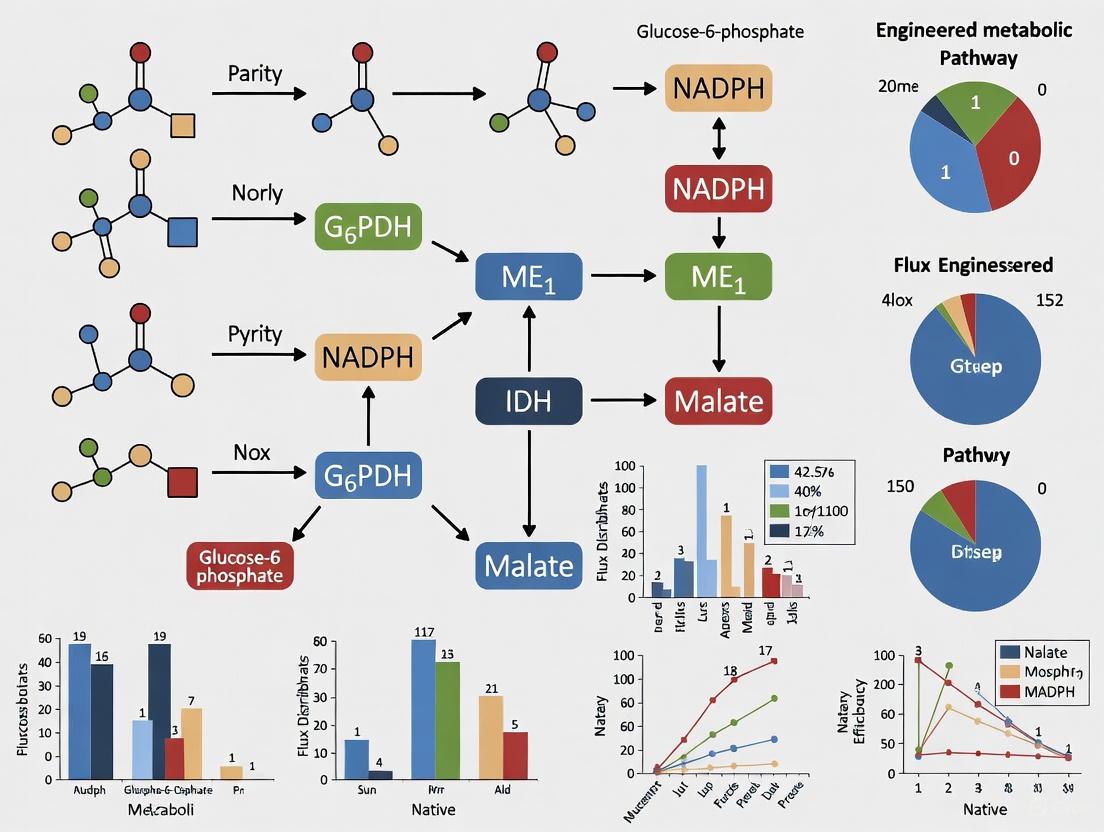
Diagram 1: Central Metabolic Pathways for NADPH Generation and Consumption
This diagram illustrates the primary pathways responsible for NADPH generation and its major consumption routes in a prokaryotic cell, highlighting key engineering targets.
Diagram 2: Strategic Framework for Engineering NADPH Regeneration
This workflow diagram outlines a logical, step-by-step approach for diagnosing and overcoming NADPH limitations in engineered pathways.
Research Reagent Solutions for NADPH Engineering
This table lists essential reagents, enzymes, and genetic tools used in the experiments and strategies discussed in this guide.
Table 2: Key Research Reagents and Tools for NADPH Pathway Engineering
| Reagent/Tool | Specific Example / Catalog Number | Function in NADPH Research | Key Application / Note |
|---|---|---|---|
| NADP/NADPH Quantification Kit | Sigma-Aldrich, MAK038; BioAssay Systems, E2ND-100 | Measures absolute concentrations of NADP+ and NADPH in cell extracts. | Essential for initial diagnosis of NADPH limitation and validating engineering strategies. Acid/Base extraction is critical. |
| Genetically Encoded Biosensor | NERNST Plasmid (Addgene, #140975); SoxR-based biosensor | Real-time, ratiometric monitoring of NADPH/NADP+ redox status in live cells. | Enables dynamic monitoring during fermentation and high-throughput screening of engineered strains [1]. |
| Glucose-6-Phosphate Dehydrogenase (G6PD) | Recombinant enzyme from S. cerevisiae (e.g., Sigma G7877) | Key enzyme in the oxidative PPP; catalyzes first NADPH-generating step. | Used in enzymatic assays and for in vitro validation. Its gene (zwf) is a primary metabolic engineering target [7] [2]. |
| Plasmid for Heterologous Expression | pET, pBAD, or other expression vectors with tunable promoters. | Overexpression of NADPH-regenerating enzymes (e.g., pntAB, udhA, gapC, IDH). |
Crucial for implementing static regulation strategies. Use of inducible/tunable promoters is recommended to avoid imbalance [1] [2]. |
| CRISPR/dCas9 Toolkits | dCas9-based transcriptional repression/activation systems | For fine-tuning the expression of native genes (e.g., pgi to flux carbon into PPP). |
Enables precise modulation of central carbon metabolism without gene knock-outs, minimizing growth defects. |
| MAGE Oligo Pools | Custom-designed oligonucleotide libraries | For multiplexed automated genome engineering (MAGE) to optimize multi-gene pathways. | Used to explore a multi-dimensional expression space, as demonstrated in the optimization of a synthetic ED pathway [5]. |
Frequently Asked Questions (FAQs)
Q1: What are the primary consequences of NADPH/NADP+ impairment in a engineered cell factory? NADPH/NADP+ impairment disrupts redox homeostasis, leading to a cascade of critical failures:
- Redox Collapse: The primary role of NADPH is to provide reducing power for antioxidant defense. Its depletion compromises the glutathione and thioredoxin systems, leading to an accumulation of reactive oxygen species (ROS) and oxidative damage [1] [9].
- Halting Biosynthesis: NADPH is an essential electron donor for anabolic reactions. Impairment directly disrupts the biosynthesis of key cellular components like fatty acids, amino acids, and nucleotides, thereby arresting growth [9].
- Induction of Novel Cell Death Pathways: In certain contexts, such as cancer cells with high cystine uptake, NADPH depletion can trigger a specific form of cell death known as disulfidptosis. This is characterized by aberrant disulfide bond formation in actin cytoskeletal proteins, leading to cytoskeletal collapse [10].
- Reduced Product Titer: For any bioproduction process that relies on NADPH-dependent enzymes (e.g., for steroid biosynthesis), a cofactor imbalance becomes a direct metabolic bottleneck, limiting the yield of the target compound [11].
Q2: How can I experimentally confirm that my observed growth defect is due to an NADPH/NADP+ imbalance? You should employ a combination of analytical methods to diagnose the imbalance:
- Monitor Growth and Metabolites: Track cell growth (OD600) and the accumulation of unexpected metabolic byproducts, which can indicate redirection of carbon flux as the cell attempts to compensate [12].
- Quantify Cofactor Pools: Use HPLC-based methods on cell extracts to measure the absolute levels of NADPH and NADP+ and calculate their ratio [12]. A significantly lowered ratio indicates reductive stress and impairment.
- Use Genetically Encoded Biosensors: Implement sensors like iNap1 (for NADPH) or SoNar (for NADH/NAD+) in your host organism. These allow for real-time, compartment-specific (e.g., cytosolic vs. mitochondrial) monitoring of the redox cofactor status in live cells, providing dynamic insights [13].
- Measure Key Metabolites and Stress Markers: Assess the levels of reduced glutathione (GSH), the GSH/GSSG ratio, and markers of oxidative stress to confirm downstream consequences of NADPH depletion [14] [9].
Q3: What compensatory mechanisms might my microbial host employ, and how can I detect them? Cells often attempt to rewire their metabolism to counteract NADPH limitation:
- Metabolic Flux Rerouting: The host may increase flux through native NADPH-generating pathways, primarily the oxidative pentose phosphate pathway (oxPPP) [12] [9]. This can be detected using ¹³C-flux analysis, which tracks how carbon from a labeled source (e.g., 2-¹³C glycerol) is redistributed through the metabolic network [12].
- Regulatory Changes: The cell may upregulate the expression of genes encoding for NADPH-generating enzymes, such as glucose-6-phosphate dehydrogenase (ZWF1) or aldehyde dehydrogenase (ALD6). This can be identified via transcriptomic analysis (qPCR, RNA-Seq) or by measuring the activity of the corresponding enzymes [9].
Q4: Which cellular processes or engineered pathways are most vulnerable to NADPH/NADP+ impairment? Pathways with high NADPH demand are particularly vulnerable. These include:
- Lipid and Steroid Biosynthesis: The synthesis of fatty acids and steroids like cholesterol and pregnenolone involves multiple NADPH-dependent enzymatic steps (e.g., catalyzed by reductases and cytochrome P450s). These processes are highly sensitive to NADPH availability [11].
- Antioxidant Defense Systems: The continuous regeneration of reduced glutathione (GSH) from its oxidized form (GSSG) by glutathione reductase is entirely dependent on NADPH. Its impairment makes cells exquisitely sensitive to oxidative stress [14] [9].
- High-Cell-Density Fermentations: In bioprocesses, nutrient limitation strategies (e.g., nitrogen limitation) are often used to decouple growth from production. This can trigger major metabolic reprogramming where maintaining NADPH/NADP+ balance becomes mandatory for survival, directly linking it to product formation [12].
Q5: What are the most promising strategic solutions to overcome NADPH limitation in engineered pathways? Solutions can be categorized into static and dynamic regulation strategies:
- Static Regulation (Pathway Engineering):
- Overexpress NADPH-Generating Enzymes: Enhance the flux of the oxPPP by overexpressing genes like zwf (G6PDH) and gnd (6PGD) [1] [13].
- Heterologous Enzyme Expression: Introduce alternative, highly active NADPH-generating enzymes, such as specific isocitrate dehydrogenases (IDHs) from other species [1].
- Modify Cofactor Preference: Use protein engineering to change the cofactor specificity of key pathway enzymes from NADPH to the more abundant NADH [1].
- Dynamic Regulation (Advanced Control):
- Employ Biosensors: Implement genetically encoded biosensors (e.g., based on transcription factor SoxR or the NERNST sensor) to monitor the NADPH/NADP+ ratio in real-time. These sensors can be linked to regulatory circuits that dynamically adjust the expression of NADPH-regenerating genes in response to the cofactor status [1].
- Promoter and RBS Engineering: Fine-tune the expression of NADPH-consuming and generating enzymes using libraries of promoters and ribosome binding sites to optimize balance without causing metabolic burden [1].
Troubleshooting Guide: NADPH/NADP+ Impairment
The following table outlines common symptoms, diagnostic experiments, and potential solutions for NADPH/NADP+ impairment.
| Observed Symptom | Recommended Diagnostic Experiments | Potential Solutions & Strategic Interventions |
|---|---|---|
| Reduced Cell Growth & Viability | - Measure NADPH/NADP+ ratio via HPLC [12].- Assess ROS levels and GSH/GSSG ratio [14] [9].- Perform transcriptomics on oxidative stress genes. | - Supplement media with antioxidants (e.g., Trolox, N-acetylcysteine) [14].- Overexpress glutathione reductase (GLR1) or thioredoxin system components [9]. |
| Low Titer of Target Product (e.g., Steroids, Lipids) | - Conduct in vitro enzyme assays for key NADPH-dependent pathway enzymes with varying NADPH levels.- Use ¹³C-flux analysis to map carbon flux [12]. | - Overexpress oxPPP genes (zwf, gnd) [1] [13].- Engineer electron transfer residues in target enzymes (e.g., DHCR7) to improve efficiency [11].- Introduce heterologous NADP+-dependent enzymes (e.g., IDH) [1]. |
| Metabolic Byproduct Accumulation | - Analyze extracellular metabolites to identify secreted intermediates.- Use ¹³C-flux analysis during production phase [12]. | - Knock out competing pathways that drain NADPH or your carbon source.- Dynamically regulate pathway expression to separate growth and production phases. |
| Successful In Vitro Activity, Failed In Vivo Activity | - Measure intracellular NADPH/NADP+ ratio during production [13] [12].- Use a biosensor (e.g., iNap, SoNar) to confirm cofactor delivery in vivo [13]. | - Implement a dynamic regulation system using an NADPH biosensor to control pathway expression [1].- Co-express a dedicated NADPH regeneration module alongside your pathway. |
Experimental Protocols for Key Analyses
Protocol 1: Quantifying Intracellular NADPH and NADP+ Pools using HPLC
- Principle: This method separates and quantifies oxidized and reduced cofactors from cell extracts using reverse-phase HPLC [12].
- Procedure:
- Quenching and Extraction: Rapidly sample cell broth (e.g., 4 mL) and mix immediately with a pre-chilled quenching agent like perchloric acid to halt metabolism.
- Neutralization: Centrifuge the sample and carefully neutralize the acidic supernatant with K₂HPO₄ and KOH. Keep samples on ice to prevent degradation.
- HPLC Analysis: Inject the neutralized extract onto a C18 column. Use a gradient of two buffers: (A) 0.1 M phosphate buffer with tetrabutylammonium hydrogen sulfate and methanol, and (B) a higher-concentration phosphate buffer with methanol.
- Detection & Quantification: Detect NADP+ and NADPH via UV absorbance. Quantify concentrations by comparing peak areas to standard curves of authentic compounds.
- Note: This protocol stabilizes the oxidized forms. For total NADP(H), an additional enzymatic cycling step can be incorporated [14].
Protocol 2: Real-Time Monitoring of Compartment-Specific NADPH using iNap1 Biosensor
- Principle: The genetically encoded sensor iNap1 exhibits a fluorescence ratio change upon NADPH binding, allowing live-cell quantification [13].
- Procedure:
- Strain Engineering: Transform your host with plasmids expressing iNap1 targeted to the cytosol (cyto-iNap1) or mitochondria (mito-iNap3). Include a non-responsive control (iNapc).
- Cell Preparation and Imaging: Culture the sensor-equipped cells and image using confocal microscopy. Collect fluorescence upon excitation at 405/420 nm and 488/485 nm.
- Calibration: For in situ calibration, permeabilize the plasma or mitochondrial membrane with digitonin and expose cells to a range of known NADPH concentrations to create a standard curve.
- Data Analysis: The ratio of fluorescence (405/488 nm or 420/485 nm) is proportional to the free NADPH concentration in that compartment.
- Application: This protocol is ideal for observing dynamic changes in NADPH levels during different growth phases or in response to stress [13].
The Scientist's Toolkit: Key Research Reagent Solutions
| Reagent / Tool | Function / Application | Key Details & Examples |
|---|---|---|
| iNap / SoNar Biosensors | Live-cell, compartment-specific monitoring of NADPH and NADH/NAD+ ratios. | iNap1 is specific for NADPH; SoNar reports NADH/NAD+ ratio. Used for real-time metabolic phenotyping and high-throughput drug screening [13]. |
| 6-Aminonicotinamide (6AN) | NADPH antimetabolite; inhibits G6PDH and 6PGD. | Experimental tool to induce NADPH depletion and study its pathological consequences in vitro and in vivo [14]. |
| Chemical Inhibitors & Activators | Probe specific pathways. G6PD inhibitors (e.g., DHEA at high doses); NOX inhibitors. | Used to dissect the contribution of specific NADPH sources or consumers to a phenotype. Specificity must be validated [14] [15]. |
| Genetically Encoded Circuits | Dynamic regulation of metabolism. NADPH biosensors (e.g., SoxR, NERNST) linked to gene expression. | Allows for feedback-controlled expression of rescue pathways or production enzymes in response to NADPH status, optimizing balance [1]. |
| HPLC-UV System | Absolute quantification of NADP+, NADPH, and other cofactors from cell extracts. | Provides precise, snapshot measurements of pool sizes. Crucial for validating biosensor data and absolute flux calculations [12]. |
NADPH/NADP+ Balance and Cellular Consequences
The diagram below illustrates the core mechanisms of NADPH/NADP+ balance, the consequences of its impairment, and the cellular compensatory strategies.
Experimental Workflow for Diagnosis and Engineering
This workflow outlines a systematic approach to identify and overcome NADPH-related bottlenecks.
A central challenge in metabolic engineering is overcoming NADPH limitation in engineered pathways. The imbalance between cofactor generation and consumption can cripple production yields, making the development of strategies to maintain redox balance a critical research area. This case study explores a novel solution developed for an engineered E. coli strain, where acetol biosynthesis was designed not merely as a production route but as an essential mechanism for cellular redox homeostasis. By examining this system, we provide a framework for researchers addressing similar NADPH regeneration challenges in microbial cell factories.
Experimental Background and System Design
Research Context and Rationale
The research was initiated to valorize waste glycerol, a major byproduct of biodiesel production, into value-added chemicals while addressing a fundamental metabolic constraint [16] [12]. The engineered system needed to function under nitrogen-limited, non-growing production conditions commonly used in bioprocesses to maximize carbon flux toward target molecules rather than biomass [16]. Previous metabolic engineering approaches for acetol and its derivatives had achieved modest titers (e.g., 2.8 g L⁻¹ acetol from 10 g L⁻¹ glycerol), but were limited by cofactor availability and pathway regulation [12].
Strain Engineering and Genetic Modifications
The base strain E. coli BW25113 was systematically engineered through λ red recombineering and P1 transduction to create the production strain E. coli B4 [12]. The following key modifications were implemented:
- Deletion of byproduct pathways: Removal of ldhA (lactate dehydrogenase), poxB (pyruvate dehydrogenase), and the pta-ackA operon (phosphate acyltransferase, acetate kinase) to minimize carbon diversion [12].
- Precursor enhancement: Replacement of gloA (lactoylglutathione lyase) and the fnr regulon (fumarate and nitrate reductase) with antibiotic resistance cassettes to enhance methylglyoxal availability, the immediate precursor to acetol [12].
- Laboratory evolution: The engineered strain underwent adaptive laboratory evolution (ALE) to significantly increase glycerol uptake rate, addressing a common bottleneck in glycerol-based bioprocesses [12].
- Production pathway insertion: Introduction of a plasmid (pTrcHis2B backbone) bearing two key genes - methylglyoxal synthase (mgsA) and NADPH-dependent aldehyde oxidoreductase (yqhD) - to complete the acetol biosynthesis pathway from central metabolism [12].
Table: Key Genetic Modifications in E. coli B4 Strain
| Genetic Element | Modification Type | Functional Impact |
|---|---|---|
| ldhA, poxB, pta-ackA | Deletion | Reduced byproduct formation |
| gloA | Replacement with resistance cassette | Enhanced methylglyoxal availability |
| fnr regulon | Replacement with resistance cassette | Altered redox metabolism |
| mgsA (MGS) | Plasmid insertion | Methylglyoxal production from DHAP |
| yqhD (AOR) | Plasmid insertion | NADPH-dependent acetol production |
Detailed Experimental Protocols
Cultivation Conditions and Nitrogen Limitation Setup
Medium Composition (per liter) [12]:
- Carbon Source: 160 mmol glycerol (naturally labeled or 2-13C labeled for flux studies)
- Nitrogen Sources: 2.68 g (NH₄)₂SO₄, 1 g NH₄Cl
- Salts: 2 g Na₂SO₄·10H₂O, 1.46 g K₂HPO₄, 0.4 g NaH₂PO₄·2H₂O, 0.25 g MgSO₄·7H₂O, 22 mg CaCl₂·2H₂O
- Trace Elements: 0.27 mg ZnSO₄·7H₂O, 0.15 mg MnSO₄·H₂O, 30.2 mg Na-EDTA, 0.24 mg CuSO₄·5H₂O, 24.1 mg FeCl₃·6H₂O, 0.27 mg CoCl₂·6H₂O
- Antibiotics: Kanamycin (50 mg L⁻¹), ampicillin (100 mg L⁻¹), chloramphenicol (12 mg L⁻¹)
- Final pH: 7.1
Bioreactor Operation Parameters [12]:
- Working Volume: 1.25 L modified M9 medium
- Temperature: 30°C
- pH: 6.8 ± 0.1 (controlled with 5 M NaOH)
- Agitation: 500 rpm
- Aeration: 1 vvm (volume per volume per minute)
- Dissolved Oxygen: Maintained at ≥40% via cascaded agitation
- Inoculation: Optical density at 600 nm (OD₆₀₀) of 0.1
Nitrogen Limitation Trigger: Acetol production is initiated upon depletion of ammonium salts, transitioning the culture from nitrogen-excess growth phase to nitrogen-limited production phase [12].
13C Metabolic Flux Analysis (13C-MFA) Protocol
Labeling Experiment Design [16] [12]:
- Tracer Selection: 2-13C glycerol as sole carbon source
- Sampling Timepoints: During exponential growth (nitrogen excess) and nitrogen starvation
- Metabolite Extraction: Rapid sampling into quenching solution
Analytical Procedures:
- Mass Spectrometry Analysis:
- Measurement of labeling patterns in intracellular metabolites
- Determination of 13C incorporation into proteinogenic amino acids
- Flux Calculation:
- Computational simulation of metabolic network
- Flux estimation using isotopomer balancing
- Statistical validation of flux distribution
Key Measured Parameters:
- Glycerol uptake rates
- Biomass formation rates
- Acetol production rates
- Intracellular flux distributions in central carbon metabolism
Cofactor Quantification Methodology
Sample Processing [12]:
- Rapid sampling of 4 mL culture broth into 1 mL perchloric acid
- Thorough mixing in overhead shaker for 15 minutes at 4°C
- Sample neutralization using 1 M K₂HPO₄ and 5 M KOH in ice water
- Centrifugation at 4,696 × g for 10 minutes at 4°C
- Storage of supernatant at -20°C until analysis
HPLC-UV Analysis [12]:
- System: Beckman System Gold
- Column: LiChrospher RP-18 (25 cm length, 4.6 mm diameter)
- Mobile Phase:
- Buffer A: 0.1 M KH₂PO₄/K₂HPO₄ (pH 6) with 4 mM tetrabutylammonium hydrogen sulfate (TBAHS) and 0.5% (v/v) methanol
- Buffer B: (Composition not fully detailed in available resources)
- Gradient elution with UV detection for NADP+, NADPH quantification
Metabolic Pathway Visualization
Figure 1: Acetol Biosynthesis Pathway for NADPH Recycling. The pathway shows conversion of glycerol to acetol via key enzymes glycerol kinase (GlpK), glycerol-3-phosphate dehydrogenase (GlpD), methylglyoxal synthase (MGS), and aldehyde oxidoreductase (AOR). The AOR reaction consumes NADPH, making acetol production essential for cofactor balance [16] [12].
Key Experimental Results and Data Presentation
Quantitative Physiological Data
Table: Physiological Parameters During Nitrogen Limitation Transition
| Parameter | Exponential Growth (N-replete) | Nitrogen Starvation (N-limited) | Change (%) |
|---|---|---|---|
| Glycerol Uptake Rate | High | Decreased | ~40% reduction |
| Biomass Formation Rate | Active | Ceased | ~100% reduction |
| Acetol Production | Minimal | Significant | >90% increase |
| Metabolic Flux Through Central Carbon Metabolism | High | Reduced | ~50% reduction |
| NADPH/NADP+ Ratio | Balanced | Maintained via acetol pathway | Stable |
13C Flux Analysis Findings
The 13C metabolic flux analysis revealed profound redistribution of carbon flux during the transition to nitrogen limitation [16] [12]:
- Flux Re-routing: Significant diversion of carbon from gluconeogenesis and TCA cycle toward acetol biosynthesis
- Metabolically Active Non-Growing State: Continued high metabolic activity despite cessation of growth
- Pathway Activation: 2-3 fold increase in flux through the methylglyoxal-acetol bypass
- Cofactor Coupling: Direct correlation between acetol flux and NADPH regeneration capacity
Technical Support Center
Troubleshooting Guides
Problem: Low Acetol Yields Under Nitrogen Limitation
Symptoms: Minimal acetol accumulation despite nitrogen depletion; continued glycerol consumption without product formation.
Potential Causes and Solutions:
- Insufficient Pathway Induction
- Verify: Check plasmid retention and promoter induction
- Solution: Ensure proper antibiotic selection and inducer concentration
Inadequate Nitrogen Limitation
- Verify: Measure residual ammonium in culture
- Solution: Adjust initial ammonium concentration or use nitrogen-free feeding strategy
Reduced Glycerol Uptake
- Verify: Monitor glycerol concentration in medium
- Solution: Consider additional ALE for enhanced glycerol utilization
Problem: Unstable NADPH Balance
Symptoms: Culture crash upon nitrogen limitation; accumulation of metabolic intermediates.
Potential Causes and Solutions:
- Inefficient Flux Through Acetol Pathway
- Verify: Measure methylglyoxal accumulation
- Solution: Optimize MGS and AOR expression balance
Competing NADPH Sinks
- Verify: Analyze byproduct formation
- Solution: Reinforce knockout of competing pathways
Oxidative Stress
- Verify: Measure reactive oxygen species
- Solution: Adjust aeration or add antioxidants
Frequently Asked Questions (FAQs)
Q1: Why is nitrogen limitation specifically effective for triggering acetol production in this system?
A1: Nitrogen limitation creates a unique metabolic state where growth ceases but carbon metabolism continues. This forces redirection of carbon flux from biomass formation to alternative sinks. In this engineered strain, the acetol pathway becomes essential for maintaining NADPH/NADP+ balance when biosynthetic demands for this cofactor decrease due to halted growth [16] [12].
Q2: How does the acetol pathway specifically contribute to NADPH balance?
A2: The aldehyde oxidoreductase (AOR) enzyme encoded by yqhD utilizes NADPH as a cofactor to reduce methylglyoxal to acetol. This consumption of NADPH is critical for regenerating NADP+, which serves as an electron acceptor for continued operation of central metabolic pathways that generate reducing equivalents. Without this sink, NADPH would accumulate and inhibit key enzymatic reactions [16] [12].
Q3: What advantages does glycerol offer over glucose as a carbon source for this application?
A3: Glycerol has a higher degree of reduction than glucose, potentially providing more reducing equivalents for NADPH generation. Additionally, as a major byproduct of biodiesel production, it represents a low-cost, renewable feedstock. The glycerol metabolism pathway in E. coli also naturally interfaces well with the acetol biosynthesis route via dihydroxyacetone phosphate (DHAP) [12].
Q4: How can the performance of this system be further improved?
A4: Potential strategies include: (1) Fine-tuning expression of MGS and AOR enzymes to optimize flux balance, (2) Engineering NADPH generation capacity by modifying pentose phosphate pathway flux, (3) Further adaptation via ALE to improve glycerol utilization and product tolerance, and (4) Integration with continuous or fed-batch processes to extend production phase [16] [12].
The Scientist's Toolkit: Research Reagent Solutions
Table: Essential Research Materials for Acetol-NADPH Balance Studies
| Reagent/Resource | Specifications | Application/Function |
|---|---|---|
| E. coli B4 Strain | ΔldhA, ΔpoxB, Δpta-ackA, ΔgloA, Δfnr with pTrcHis2B-mgsA-yqhD | Engineered whole-cell biocatalyst for acetol production |
| 2-13C Glycerol | ≥99% isotopic purity, 160 mmol/L in M9 medium | Tracer for 13C metabolic flux analysis |
| Modified M9 Medium | Specific ammonium sulfate/chloride composition, defined trace elements | Controlled cultivation with precise nitrogen limitation |
| HPLC-UV System | Beckman System Gold with LiChrospher RP-18 column | Quantification of NADPH/NADP+ ratios and extracellular metabolites |
| Antibiotic Cocktail | Kanamycin (50 mg/L), ampicillin (100 mg/L), chloramphenicol (12 mg/L) | Selective pressure for plasmid and genotype maintenance |
| Quenching Solution | Perchloric acid-based, ice-cold | Immediate metabolic arrest for cofactor quantification |
This case study demonstrates the successful implementation of a mandatory product formation strategy, where acetol synthesis is coupled to NADPH regeneration, creating an essential metabolic valve for redox balance [16] [12]. The integration of strain engineering, process design (nitrogen limitation), and advanced analytics (13C-MFA) provides a blueprint for addressing similar cofactor limitation challenges in metabolic engineering.
The principles illustrated here—redirecting flux under nutrient limitation, coupling product formation to essential cofactor balance, and utilizing waste carbon streams—have broad applicability across microbial chemical production platforms. Future research should focus on extending this approach to other cofactor-dependent pathways and implementing dynamic regulation systems for enhanced robustness and productivity.
Disulfidptosis is a novel form of regulated cell death triggered by disulfide stress, a discovery that has created new frontiers in cancer biology and therapeutic development [17]. This process is characterized by abnormal accumulation of intracellular disulfides, which leads to aberrant disulfide bonding in actin cytoskeleton proteins, subsequent collapse of the F-actin network, and ultimately cell death [18] [19]. Unlike other forms of programmed cell death such as apoptosis, ferroptosis, and necroptosis, disulfidptosis occurs under specific metabolic conditions: high expression of the cystine transporter SLC7A11 combined with glucose starvation [20] [21]. This unique mechanism highlights the crucial role of NADPH homeostasis in cellular survival and presents innovative opportunities for targeting cancer metabolism.
The discovery of disulfidptosis emerged from investigating the paradoxical role of SLC7A11 in cancer cells. While SLC7A11 typically promotes cell survival by facilitating cystine uptake for glutathione synthesis, under glucose starvation conditions, it becomes a liability that triggers cell death through disulfide stress [19] [17]. This metabolic vulnerability represents a promising avenue for therapeutic intervention, particularly against tumors with high SLC7A11 expression. This technical support center provides comprehensive guidance for researchers exploring this emerging field, with practical troubleshooting advice and methodological frameworks for investigating disulfidptosis in experimental models.
Frequently Asked Questions: Disulfidptosis Fundamentals
What are the essential molecular prerequisites for inducing disulfidptosis?
Disulfidptosis requires three fundamental conditions: (1) high expression of the cystine transporter SLC7A11, leading to excessive cystine uptake; (2) glucose starvation or inhibition of glucose transport, which blocks NADPH generation via the pentose phosphate pathway; and (3) subsequent abnormal disulfide bond formation between actin cytoskeleton proteins [20] [17] [21]. When these conditions are met, NADPH becomes rapidly depleted due to both reduced synthesis and increased consumption for cystine reduction, causing irreversible disulfide stress that collapses the actin network [18] [19].
How can I distinguish disulfidptosis from other forms of cell death like ferroptosis?
Disulfidptosis exhibits distinct morphological and biochemical features that differentiate it from other cell death pathways. The table below summarizes key characteristics for comparison:
Table 1: Comparative Analysis of Disulfidptosis Versus Other Cell Death Pathways
| Cell Death Type | Key Morphological Features | Primary Biochemical Triggers | Sensitivity to Inhibitors |
|---|---|---|---|
| Disulfidptosis | Lamellipodial protrusions, F-actin collapse and detachment from membrane | NADPH depletion, disulfide accumulation in cytoskeletal proteins | Inhibited by thiol-reducing agents (DTT, 2-ME); not affected by ferroptosis or apoptosis inhibitors [18] [21] |
| Ferroptosis | Increased mitochondrial membrane density, reduced cristae | Lipid peroxidation, glutathione depletion | Inhibited by ferroptosis inhibitors (Ferrostatin-1); promoted by GPX4 inhibition [18] [19] |
| Apoptosis | Cell membrane blebbing, chromatin condensation, nuclear fragmentation | Caspase activation, cytochrome c release | Inhibited by caspase inhibitors (Z-VAD-fmk) [18] [17] |
| Cuproptosis | Mitochondrial shrinkage, cell membrane rupture | Copper-induced aggregation of lipoylated proteins | Linked to mitochondrial metabolism [18] |
Which cancer types show particular susceptibility to disulfidptosis?
Cancers with naturally high expression of SLC7A11 are particularly vulnerable to disulfidptosis induction. Current evidence suggests significant relevance in lung adenocarcinoma (LUAD), bladder cancer (BCa), renal cell carcinoma (RCC), hepatocellular carcinoma (HCC), and colon adenocarcinoma (COAD) [18]. Research indicates that breast cancer, especially triple-negative subtypes, may also demonstrate susceptibility through unique redox vulnerabilities [22].
What is the relationship between NADPH homeostasis and disulfidptosis?
NADPH serves as the primary reducing equivalent that converts disulfides to thiols, maintaining redox balance [7]. Under glucose starvation, NADPH synthesis through the pentose phosphate pathway is severely impaired, while SLC7A11-mediated cystine transport and reduction consumes substantial NADPH reserves [18] [20]. This dual impact creates a severe NADPH deficit, rendering cells incapable of reducing accumulated disulfides and leading to the disulfide stress that triggers disulfidptosis [19] [21].
Technical Troubleshooting Guide: Experimental Challenges
Challenge 1: Failure to Induce Disulfidptosis in SLC7A11-High Cell Lines
Potential Causes and Solutions:
- Insufficient glucose deprivation: Verify glucose concentration in media using biochemical assays. Ensure complete glucose removal or use specific GLUT inhibitors (e.g., BAY-876) at effective concentrations [20] [17].
- Inadequate SLC7A11 expression validation: Confirm SLC7A11 expression at both mRNA and protein levels across cell passages. Consider using inducible overexpression systems for consistent results [19] [21].
- Compensatory metabolic pathways: Inhibit alternative NADPH sources including malic enzyme or IDH1 pathways to ensure complete NADPH depletion [7].
- Oxidative preconditioning: Ensure cells haven't been pre-adapted to oxidative stress, which may upregulate compensatory antioxidant mechanisms [23].
Validation Experiments:
- Monitor NADPH/NADP+ ratio using commercial kits before and during induction.
- Use live-cell imaging to track actin cytoskeleton dynamics with GFP-actin reporters.
- Verify specificity with thiol-reducing agents (DTT, 2-ME) which should rescue cell death [17] [21].
Challenge 2: Differentiating Disulfidptosis from Ferroptosis
Discrimination Strategy:
- Pharmacological profiling: Include specific inhibitors for both pathways - Ferrostatin-1/Liproxstatin-1 for ferroptosis and thiol-reducing agents for disulfidptosis [18] [19].
- Metabolic mapping: Measure distinct metabolic markers - glutathione depletion and lipid peroxidation for ferroptosis versus cystine accumulation and NADPH depletion for disulfidptosis [19] [20].
- Morphological analysis: Use transmission electron microscopy to identify pathognomonic features - F-actin collapse for disulfidptosis versus shrunken mitochondria with condensed membranes for ferroptosis [18].
- Genetic validation: Knockdown of key regulatory genes - SLC7A11 ablation should prevent disulfidptosis but promote ferroptosis, while GPX4 knockdown promotes ferroptosis but doesn't affect disulfidptosis [19].
Challenge 3: Translating In Vitro Findings to In Vivo Models
Optimization Approaches:
- Glucose deprivation strategies: Implement dietary glucose restriction in animal models or use GLUT inhibitors with confirmed blood-brain barrier penetration where relevant [20] [17].
- Tumor microenvironment considerations: Account for hypoxia-induced metabolic adaptations that may alter disulfidptosis susceptibility [23] [22].
- Pharmacodynamic monitoring: Develop biomarkers including NADPH/NADP+ imaging and cystine accumulation assays for in vivo validation [7].
- Combination therapy rationales: Pair disulfidptosis inducers with metabolic inhibitors that block compensatory pathways [20] [22].
The Scientist's Toolkit: Essential Research Reagents
Table 2: Key Reagents for Disulfidptosis Research
| Reagent Category | Specific Examples | Research Application | Mechanistic Role |
|---|---|---|---|
| SLC7A11 Inhibitors | HG106, Sulfasalazine, Erastin | Inhibit cystine transport to validate SLC7A11 dependence [20] | Block cystine uptake, preventing disulfide accumulation [19] [21] |
| GLUT Inhibitors | BAY-876, Cytochalasin B, 2-Deoxy-D-glucose (2-DG) | Induce glucose starvation to trigger disulfidptosis [20] [17] | Block glucose uptake, depleting NADPH via PPP inhibition [18] [19] |
| Thiol-Reducing Agents | Dithiothreitol (DTT), 2-Mercaptoethanol (2-ME), TCEP | Rescue experiments to confirm disulfidptosis specificity [18] [17] | Reduce aberrant disulfide bonds in cytoskeletal proteins [21] |
| NADPH Modulators | G6PD inhibitors, NADK mutants, OXPHOS uncouplers | Modulate NADPH homeostasis to establish threshold effects [7] | Directly manipulate NADPH production/consumption balance [18] [7] |
| Cytoskeletal Markers | Phalloidin conjugates, Live-actin GFP reporters, WRC complex antibodies | Visualize actin network collapse during disulfidptosis [19] [17] | Detect morphological hallmarks of disulfidptosis execution [18] |
Experimental Protocols: Core Methodologies
Protocol 1: Induction and Quantification of Disulfidptosis in 2D Cell Culture
Materials:
- SLC7A11-high cell lines (e.g., UMUC3, NCI-H226)
- Glucose-free media supplemented with dialyzed FBS
- GLUT inhibitors (BAY-876, 10μM) or thiol-reducing agents (DTT, 2mM) as controls
- Phalloidin-fluorophore conjugates for F-actin staining
- NADPH/NADP+ quantification kit
- IncuCyte or similar live-cell imaging system
Procedure:
- Seed cells in complete media and allow to adhere for 24 hours.
- Replace media with glucose-free media containing designated treatments.
- Monitor cell viability in real-time using IncuCyte system with appropriate dyes.
- At designated timepoints (0, 4, 8, 12, 24h), harvest cells for:
- NADPH/NADP+ ratio measurement per kit instructions
- Intracellular cystine quantification via LC-MS
- F-actin staining and confocal microscopy
- Perform immunoblotting for SLC7A11, actin, and disulfide-bonded protein complexes under non-reducing conditions.
- Validate disulfidptosis specificity using rescue experiments with thiol-reducing agents.
Troubleshooting Notes:
- Optimize cell density to prevent nutrient depletion artifacts.
- Include SLC7A11-low cells as negative controls.
- Validate glucose concentration in media using glucose assay kits.
- Use CRISPRi knockdown of NCKAP1 as additional specificity control [19] [21].
Protocol 2: In Vivo Assessment of Disulfidptosis Induction
Materials:
- Immunocompromised mice (NSG or similar)
- SLC7A11-high patient-derived xenografts or cell line-derived xenografts
- GLUT inhibitors with confirmed in vivo activity (e.g., BAY-876)
- PET tracers for glucose uptake monitoring (optional)
- Materials for tissue processing and immunohistochemistry
Procedure:
- Establish tumors of ~100mm³ volume before randomization.
- Administer GLUT inhibitors via appropriate route (oral gavage or IP injection).
- Monitor tumor growth kinetics and animal weight daily.
- Harvest tumors at predetermined endpoints for:
- Immunohistochemistry staining for F-actin (phalloidin) and disulfide bonds
- Metabolite profiling for NADPH/NADP+ and cystine levels
- Western blot analysis under non-reducing conditions
- Correlate disulfidptosis markers with treatment response.
Technical Considerations:
- Implement dietary glucose restriction to enhance disulfidptosis induction.
- Include appropriate control groups receiving vehicle and/or thiol-reducing agents.
- Optimize dosing schedule to balance efficacy and toxicity [20] [17].
Pathway Visualization: Molecular Mechanisms of Disulfidptosis
Diagram 1: Molecular Pathway of Disulfidptosis Induction
This schematic illustrates the sequential molecular events in disulfidptosis, beginning with the two prerequisite conditions (high SLC7A11 expression and glucose starvation) and progressing through metabolic dysregulation to the final execution phase characterized by cytoskeletal collapse.
Diagram 2: NADPH-Disulfide Balance in Cellular Redox Homeostasis
This diagram contrasts normal NADPH-disulfide balance with the pathological imbalance occurring during disulfidptosis, highlighting the central role of NADPH in maintaining redox homeostasis and the consequences of its depletion under glucose starvation conditions.
The discovery of disulfidptosis represents a significant advancement in understanding the intersection between cellular metabolism and death pathways. This NADPH-driven process reveals inherent vulnerabilities in cancer cells, particularly those with high SLC7A11 expression [20] [21]. The experimental frameworks and troubleshooting guides provided here equip researchers with essential methodologies to investigate this novel cell death pathway and develop targeted therapeutic strategies.
Future research directions should focus on elucidating the complete regulatory network controlling disulfidptosis, identifying biomarkers for patient stratification, and optimizing combination therapies that leverage this metabolic vulnerability [20] [22]. As our understanding of disulfidptosis matures, it holds promise for developing innovative cancer treatments that exploit the unique metabolic dependencies of tumor cells, potentially overcoming limitations of conventional therapies.
Static and Dynamic Engineering Strategies for Enhanced NADPH Supply and Utilization
Frequently Asked Questions (FAQs)
Q1: Why is overcoming NADPH limitation critical in engineered metabolic pathways? NADPH is an essential cofactor for reductive biosynthesis and antioxidant defense. In engineered pathways, high demand for products like fatty acids, isoprenoids, or amino acids can deplete NADPH pools, creating a bottleneck that limits yield and can cause cellular stress. Statically regulating NADPH-generating enzymes aims to increase the total supply of this cofactor to overcome this limitation [1] [24] [25].
Q2: What are the primary endogenous enzymes targeted for static regulation to enhance NADPH supply? The two most common endogenous enzyme families targeted are:
- Glucose-6-phosphate dehydrogenase (G6PDH/Zwf): This enzyme catalyzes the first and rate-limiting step of the oxidative pentose phosphate pathway (PPP), a major source of cytosolic NADPH [1] [24].
- NADP+-dependent Isocitrate Dehydrogenase (IDH): Located in both the cytosol and mitochondria, IDH generates NADPH within the TCA cycle, making it a key contributor to the mitochondrial and cytosolic NADPH pool [26] [24].
Q3: What is a major drawback of static overexpression of these enzymes? A significant drawback is the potential to create a metabolic imbalance in the NADPH/NADP+ ratio [1]. Unlike dynamic regulation strategies, static overexpression cannot adjust to the cell's real-time needs. This can lead to metabolic burdens, disrupted growth, and the accumulation of undesirable intermediates, ultimately reducing the productivity of the desired pathway [1].
Q4: When is heterologous expression of an NADPH-generating enzyme preferred over endogenous overexpression? Heterologous expression is beneficial when the native enzyme has poor kinetics, is subject to strong allosteric inhibition, or when you want to introduce a pathway from an organism that naturally has a higher NADPH output. For example, isocitrate dehydrogenases from Corynebacterium glutamicum or Azotobacter vinelandii have been expressed in E. coli to enhance NADPH regeneration [1].
Troubleshooting Guide
Problem 1: Poor Cell Growth or Metabolic Burden After Enzyme Overexpression
- Potential Cause: The constitutive overexpression of NADPH-generating enzymes (like G6PDH or IDH) consumes excessive central carbon metabolites (e.g., glucose-6-phosphate, isocitrate), diverting them away from growth-critical pathways like glycolysis and the TCA cycle.
- Solution:
- Use a Tunable Promoter: Replace constitutive promoters with inducible (e.g., Trc/lac) or tunable promoters to precisely control the expression level of the NADPH-generating enzyme and reduce burden during the growth phase [12].
- Promoter Engineering: Weaken the native promoter of competing pathways or use a weaker promoter for the NADPH enzyme to balance flux [1].
- Supplement Media: Ensure the media has sufficient carbon and energy sources to support both the new metabolic demand and cell growth.
Problem 2: Insufficient Increase in Target Product Titer Despite Higher NADPH Levels
- Potential Cause 1: The NADPH is being consumed by competing native pathways, such as the glutathione system for oxidative stress response or other reductive biosynthetic pathways [26].
- Solution:
- Downregulate Competing Pathways: Identify and knock out or downregulate genes that are major NADPH sinks not related to your product. For example, reducing the activity of glutathione reductase might channel more NADPH to production, but be cautious of increased oxidative stress sensitivity [26] [25].
- Potential Cause 2: The overexpressed enzyme is not catalytically efficient enough or is inhibited by downstream metabolites.
- Solution:
Problem 3: NADPH/NADP+ Redox Imbalance Leading to Byproduct Formation
- Potential Cause: Static overexpression leads to an overly reduced NADPH/NADP+ pool, forcing the cell to use alternative pathways to re-oxidize NADPH, resulting in the accumulation of byproducts like acetate in E. coli.
- Solution:
- Dynamic Regulation: Consider transitioning to a dynamic regulation strategy using NADPH-responsive biosensors (e.g., SoxR-based) to automatically adjust pathway flux in response to the redox state [1].
- Cofactor Engineering: Introduce soluble transhydrogenases or NADH-dependent synthetic pathways to help balance the overall redox state of the cell [1] [25].
Experimental Protocols
Protocol 1: Overexpression of IDH in a Microbial Host
This protocol outlines the process for overexpressing a heterologous NADP+-dependent isocitrate dehydrogenase (IDH) in E. coli to enhance NADPH supply for lipogenesis, based on strategies used in microalgae and other microbes [24].
1. Gene Cloning and Vector Construction:
- Template DNA: Isolate total RNA from the donor organism (e.g., Tetradesmus obliquus for ToIDH) [24].
- Gene Amplification: Design primers to amplify the coding sequence (CDS) of the target idh gene. Include restriction enzyme sites compatible with your expression vector.
- Ligation and Transformation: Ligate the purified PCR product into a plasmid with a strong, tunable promoter (e.g., PTrc/lac) and an appropriate antibiotic resistance marker (e.g., ampicillin). Transform the construct into a competent E. coli strain (e.g., BW25113) [12].
2. Cultivation and Induction:
- Pre-culture: Inoculate a single colony into LB medium with the appropriate antibiotic. Incubate at 30°C and 200 rpm for 6-8 hours [12].
- Main Culture: Transfer the pre-culture to a defined minimal medium (e.g., M9) with the carbon source of choice (e.g., glycerol or glucose) and antibiotics. Cultivate in a controlled bioreactor with parameters set to 30°C, pH 6.8, and dissolved oxygen maintained at or above 40% [12].
- Induction: When the culture reaches the mid-exponential phase (OD600 ~0.6), induce enzyme expression by adding Isopropyl β-d-1-thiogalactopyranoside (IPTG). A typical final concentration is 0.1 - 1.0 mM.
3. Validation and Analysis:
- Enzyme Activity Assay: Harvest cells by centrifugation after induction. Lyse cells and use a spectrophotometric assay to measure IDH activity by monitoring NADPH production at 340 nm.
- NADPH/NADP+ Quantification: Quench cell metabolism rapidly with perchloric acid, neutralize the extract, and quantify oxidized and reduced cofactor levels using HPLC-UV [12].
- Lipid Analysis: Extract neutral lipids from the cell biomass using organic solvents and quantify gravimetrically or via GC-MS to assess the impact on lipogenesis [24].
Protocol 2: Measuring NADPH/NADP+ Ratios in Engineered Strains
Accurate measurement of the redox cofactor ratio is essential for diagnosing NADPH limitation.
1. Cell Sampling and Quenching:
- Rapidly sample 4 mL of cell broth and immediately mix it with 1 mL of ice-cold perchloric acid (e.g., 6% v/v) to quench metabolism. Mix thoroughly in an overhead shaker for 15 minutes at 4°C. The acidic pH stabilizes oxidized cofactors (NADP+) [12].
2. Sample Neutralization and Preparation:
- Neutralize the acid-treated sample with appropriate volumes of 1 M K2HPO4 and 5 M KOH while keeping the sample in an ice-water bath.
- Centrifuge the neutralized sample at >4,600 × g for 10 minutes at 4°C to remove cell debris. Collect the supernatant and store at -20°C until analysis [12].
3. HPLC-UV Analysis:
- Column: LiChrospher RP-18 (e.g., 25 cm x 4.6 mm).
- Mobile Phase:
- Buffer A: 0.1 M potassium phosphate buffer (pH 6.0), 4 mM tetrabutylammonium hydrogen sulfate, 0.5% (v/v) methanol.
- Buffer B: (Composition to be optimized, often a higher percentage of methanol or acetonitrile for elution).
- Detection: Monitor absorbance at 254 nm (for NADP+) and 340 nm (for NADPH). Use external standards to identify and quantify the cofactors in the sample [12].
Table 1: Performance of NADPH-Generating Enzyme Overexpression in Various Microorganisms
| Organism | Enzyme Overexpressed | Key Quantitative Outcome | Impact on Target Pathway |
|---|---|---|---|
| Tetradesmus obliquus (Microalgae) [24] | NADP+-dependent Isocitrate Dehydrogenase (ToIDH) | - 1.69-fold increase in neutral lipids (vs. wild-type)- Lipid yield: 234.56 mg/L- Biomass: 790.67 mg/L | Enhanced lipogenesis and carbon flux re-routing towards lipids. |
| Escherichia coli [1] | Isocitrate Dehydrogenase from Corynebacterium glutamicum | Enhanced NADPH regeneration capacity. | Improved production of NADPH-dependent chemicals. |
| Escherichia coli (HCT116 cell line) [26] | Mutant IDH1 (R132H) | - Decreased NADPH/NADP+ ratio- 40% increase in PPP flux | Increased 2-HG synthesis at the expense of reductive biosynthesis, sensitizing cells to oxidative stress. |
| Escherichia coli (Engineered for Acetol) [12] | G6PDH (zwf) & NADK (ppnK) | Improved NADPH supply. | Supported acetol production from glycerol under nitrogen limitation. |
Table 2: Key Research Reagent Solutions
| Reagent / Material | Function / Application | Example Use Case |
|---|---|---|
| pTrcHis2B Expression Vector | Cloning and tunable expression of heterologous genes using the Trc/lac promoter. | Overexpression of mgsA and yqhD for acetol production in E. coli [12]. |
| 2-13C Glycerol | Tracer for 13C-Metabolic Flux Analysis (13C-MFA) to quantify intracellular flux. | Elucidating flux re-routing in central carbon metabolism during nitrogen starvation [12]. |
| LiChrospher RP-18 HPLC Column | Analytical separation of nucleotides like NADP+ and NADPH prior to UV detection. | Quantifying intracellular cofactor ratios to assess redox state [12]. |
| BG-11 Medium | Defined medium for the cultivation of cyanobacteria and microalgae. | Cultivating Tetradesmus obliquus for lipid production studies [24]. |
| SoxR-based Biosensor | Genetically encoded tool for real-time monitoring of the NADPH/NADP+ ratio. | Dynamic regulation of metabolic pathways in response to redox state in E. coli [1]. |
Pathway and Workflow Visualizations
Static Regulation of NADPH Supply for Biosynthesis
Workflow for Enzyme Overexpression & Validation
Promoter and RBS Engineering for Precise Control of NADPH Metabolic Flux
Core Concepts and FAQs
What is the fundamental relationship between promoter/RBS engineering and NADPH metabolism?
Promoter and Ribosome Binding Site (RBS) engineering are foundational synthetic biology tools that enable precise control over gene expression at the transcriptional and translational levels. In the context of NADPH metabolism, these techniques allow researchers to fine-tune the expression levels of enzymes involved in NADPH regeneration and consumption, thereby optimizing the intracellular NADPH/NADP+ ratio for enhanced production of target compounds. Static regulation strategies, including promoter engineering, direct carbon flux toward NADPH-generating pathways like the pentose phosphate pathway (PPP) by controlling the expression of key enzymes such as glucose-6-phosphate dehydrogenase (Zwf) [1].
Why is dynamic control often preferable to static engineering for NADPH-dependent pathways?
Static regulation methods, such as constitutive promoter replacements, often lead to NADPH/NADP+ imbalance because they cannot adjust intracellular NADPH levels in real-time to meet fluctuating cellular demands. This imbalance can cause metabolic burdens, disrupt cell growth, and limit production yields. Dynamic regulation systems use genetically encoded biosensors to monitor the intracellular NADPH/NADP+ redox state and automatically adjust pathway enzyme expression, leading to more robust and efficient bioproduction [1]. For example, dynamic reduction of competitive metabolic fluxes in E. coli has been shown to improve NADPH availability and increase xylitol titers to over 200 g/L [27].
What are the key metrics for evaluating the success of promoter-RBS engineering for NADPH flux?
Successful engineering is typically evaluated through multiple quantitative metrics:
- NADPH/NADP+ Ratio: Measured using genetically encoded biosensors like iNAP or NERNST [1] [28].
- Specific Enzyme Activity: For example, NADPH-P450 reductase activity measured via cytochrome c reduction assays [29].
- Metabolic Flux Distributions: Quantified through metabolic flux analysis (MFA) showing carbon channeling through NADPH-producing pathways like PPP [30].
- Target Product Yield and Titer: Ultimate validation of pathway optimization [27].
How does host organism selection impact promoter-RBS strategy for NADPH regulation?
Host organisms possess distinct native promoters, RBS sequences, and metabolic network structures that significantly influence engineering strategy. For instance:
- Archaea: Feature eukaryotic-like transcription with TATA box, BRE, and TSS elements requiring specialized promoter design [31].
- E. coli: Offers well-characterized parts but may require expression balancing to avoid NADPH imbalance [27].
- P. putida: Contains G6PDH isoenzymes with different NAD+/NADP+ specificities that naturally maintain redox balance [1].
Implementation and Troubleshooting
How do I construct and characterize a promoter-RBS library for NADPH pathway optimization?
Experimental Protocol: Library Construction and Screening
Step 1: Library Design
- Select diverse promoter-RBS combinations (wild-type, hybrid, engineered 5'UTRs) from essential metabolic operons [31].
- Include sequences from related species to avoid homologous recombination issues.
- For NADPH pathways, prioritize promoters from NADPH-generating systems (e.g., PPP genes).
Step 2: Vector Assembly
Step 3: Host Integration
- Integrate constructs into the host genome using site-specific recombination systems (e.g., ΦC31 integrase) to ensure copy number stability [31].
- Alternatively, use plasmid-based systems with consistent copy number.
Step 4: Expression Characterization
- Cultivate strains under relevant conditions (varying carbon sources, growth phases).
- Measure reporter enzyme activity (e.g., UidA assay) or target protein expression.
- Calculate expression strength relative to a reference promoter (e.g., minimal PmcrB for methanogens) [31].
Step 5: NADPH Flux Validation
Troubleshooting Common Issues:
- Problem: Limited dynamic range in library expression levels.
- Solution: Incorporate hybrid promoter-RBS combinations and 5'UTR engineering, which can achieve 140-fold expression ranges in methanogens [31].
- Problem: Growth defects or metabolic burden.
- Solution: Implement dynamic regulation instead of constitutive expression to balance pathway expression with growth requirements [27].
- Problem: Inconsistent expression across growth conditions.
- Solution: Characterize promoters at multiple growth phases and substrate conditions, as expression strength can vary significantly [31].
How can I identify and resolve NADPH/NADP+ imbalance in engineered strains?
Diagnosis and Resolution Workflow:
Supporting Quantitative Data for Pathway Engineering:
Table 1: NADPH Generation Pathways and Engineering Strategies
| Pathway | Key Enzymes | Engineering Approach | Expected Impact | Reference |
|---|---|---|---|---|
| Pentose Phosphate Pathway (PPP) | Glucose-6-phosphate dehydrogenase (Zwf), 6-phosphogluconate dehydrogenase (Gnd) | Promoter engineering to enhance expression; protein engineering to modify cofactor preference | Primary NADPH source; 2 NADPH per glucose-6-phosphate | [1] [32] |
| Entner-Doudoroff (ED) Pathway | Glucose-6-phosphate dehydrogenase (Zwf) | Exploit natural cyclicity; express isoforms with different cofactor specificities | Major NADPH source in some bacteria (e.g., P. putida) | [1] |
| TCA Cycle | Isocitrate dehydrogenase (IDH) | Express heterologous NADP+-dependent IDHs from C. glutamicum or A. vinelandii | Significant NADPH source in mitochondria | [1] [30] |
Table 2: Dynamic Regulation Systems for NADPH Balance
| System Type | Key Components | Application Example | Performance Outcome | Reference |
|---|---|---|---|---|
| Biosensor-Mediated | SoxR transcription factor; NERNST (roGFP2 + NADPH thioredoxin reductase) | Real-time monitoring of NADPH/NADP+ status in E. coli | Enable dynamic control of NADPH levels | [1] |
| Two-Stage Dynamic Metabolic Control | Degron tags, CRISPR interference | Xylitol production in E. coli with xylose sole carbon source | 200 g/L titer, 86% theoretical yield | [27] |
| Hybrid Static-Dynamic | Promoter engineering combined with inducible systems | Regulation of membrane-bound transhydrogenase (PntAB) | Alleviated inhibition by fatty acid metabolites | [27] |
What advanced tools are available for designing promoter-RBS systems for NADPH regulation?
Computational and Experimental Resources:
- Machine Learning Integration: ML algorithms can predict enzyme kinetic parameters (kcat values), optimize promoter-RBS combinations, and identify missing reactions in metabolic models to enhance NADPH flux predictions [33].
- Genome-Scale Metabolic Models (GEMs): Enzyme-constrained GEMs (ecGEMs) incorporate enzyme turnover numbers and capacity constraints to simulate NADPH flux distributions more accurately [33].
- Pathway Design Algorithms: Computational tools navigate metabolic networks to design optimal pathways with balanced NADPH cofactor usage, integrating with Design-Build-Test-Learn (DBTL) cycles [34].
- High-Throughput Characterization: Automated platforms enable rapid screening of promoter-RBS libraries under multiple growth conditions (different substrates, growth phases) [31] [35].
The Scientist's Toolkit: Research Reagent Solutions
Table 3: Essential Research Reagents for Promoter-RBS Engineering in NADPH Metabolism
| Reagent/Tool | Function/Application | Example Use Case | Key Features |
|---|---|---|---|
| Promoter-RBS Library | Fine-tuning gene expression levels | Systematic optimization of NADPH-generating enzyme expression | 140-fold dynamic range; 33 combinations; validated in different growth phases [31] |
| Genetically Encoded NADPH Biosensors | Real-time monitoring of NADPH/NADP+ ratio | Dynamic regulation of NADPH-consuming pathways | Ratiometric measurement (NERNST); specific response to NADPH/NADP+ (SoxR) [1] [28] |
| CRISPR-Cas Genome Editing | Precise genomic modifications | Integration of expression cassettes; knockout of competing pathways | High efficiency; multiplexed editing; compatible with various hosts [35] |
| β-Glucuronidase (UidA) Reporter | Quantitative assessment of promoter strength | Characterization of promoter-RBS library variants | Sensitive colorimetric assay; reliable quantification [31] |
| Metabolic Flux Analysis Software | Quantification of intracellular flux distributions | Assessment of NADPH flux through PPP vs other pathways | Integration of 13C labeling data; constraint-based modeling [30] |
| Machine Learning Prediction Tools | Forecasting optimal expression levels | Designing promoter-RBS combinations for NADPH balance | Data-driven optimization; reduces experimental screening burden [33] |
Conceptual Framework: Engineering Workflow
A primary bottleneck in metabolic engineering is overcoming NADPH limitations in engineered pathways. The balance between the reduced (NADPH) and oxidized (NADP+) forms of nicotinamide adenine dinucleotide phosphate is central to redox homeostasis, governing the flux of anabolic reactions and antioxidant defense [36] [37]. Traditional analytical methods, which rely on cell lysis, offer only a static snapshot and destroy the spatial and temporal context of metabolic dynamics [38]. Genetically encoded biosensors represent a transformative technology, enabling real-time, non-invasive monitoring of NADPH/NADP+ ratios in living cells with subcellular resolution. This technical support center provides a comprehensive guide to implementing these sophisticated tools, specifically focusing on the novel NAPstar biosensor family, to help researchers overcome redox balancing challenges and optimize their engineered systems [36].
Understanding Your Tools: NADP(H) Biosensors and Their Characteristics
The NAPstar Biosensor Family
The NAPstar family are single-fluorophore, ratiometric biosensors developed from the Peredox-mCherry chassis. They incorporate circularly permuted T-Sapphire (cpTSapp) and mCherry (mC) fluorescent proteins. Binding of NADPH or NADP+ to the engineered bacterial Rex domains induces a conformational change, altering the TS fluorescence while leaving mC fluorescence unchanged. The TS/mC emission ratio provides a quantitative readout of the NADPH/NADP+ redox state, independent of sensor concentration and expression levels [36].
Key Characteristics of NAPstar Variants [36]:
| NAPstar Variant | Kr (NADPH/NADP+) | Dynamic Range (ΔR/R₀) | Key Features and Recommended Applications |
|---|---|---|---|
| NAPstar1 | ~0.006 | ~2.5 | Highest sensitivity; ideal for detecting subtle redox changes in cytosol. |
| NAPstar2 | ~0.03 | ~2.5 | Balanced sensitivity; good general-purpose sensor. |
| NAPstar3 | ~0.06 | ~2.5 | Well-characterized; used in yeast, plants, mammalian cells. |
| NAPstar6 | ~0.08 | ~2.5 | Lower affinity; suitable for compartments with highly reduced states. |
| NAPstar7 | ~0.17 | ~2.5 | Lowest affinity; best for highly reduced environments like mitochondria. |
| NAPstarC | N/A (Control) | N/A | Non-binding mutant; essential control for background fluorescence. |
Core Research Reagent Solutions
| Item Name | Function/Description | Example Application/Note |
|---|---|---|
| NAPstar Plasmid Family | Genetically encoded biosensor for NADPH/NADP+ ratio. | Select variant based on Kr and subcellular targeting. |
| pTrcHis2B Expression Vector | Plasmid backbone for biosensor expression; contains Trc/lac promoter and ampicillin resistance [12]. | Common for microbial systems; inducible expression. |
| NADPH & NADP+ (Analytical Grade) | High-purity standards for in vitro calibration curves. | Essential for determining sensor response in your system. |
| Dithiothreitol (DTT) | Reducing agent; can artificially increase NADPH/NADP+ ratio. | Useful as a positive control for sensor response [36]. |
| Hydrogen Peroxide (H₂O₂) | Oxidizing agent; can artificially decrease NADPH/NADP+ ratio. | Useful as a positive control for sensor response [36]. |
Frequently Asked Questions (FAQs) and Troubleshooting Guides
FAQ 1: How do I choose the right NAPstar variant for my experiment?
The choice depends on the expected NADPH/NADP+ ratio in your cellular compartment and the dynamic range you wish to observe.
- For standard cytosolic measurements, start with NAPstar2 or NAPstar3, which offer a balanced affinity and have been validated across eukaryotes [36].
- For compartments or conditions expected to be highly reduced (e.g., mitochondria under stress, or during high flux through the pentose phosphate pathway), use a lower-affinity sensor like NAPstar7 to avoid saturation [36] [37].
- To detect very small changes or in more oxidized environments, a higher-affinity sensor like NAPstar1 is more appropriate.
- Always include the non-responsive NAPstarC mutant as a control to account for changes in autofluorescence, expression level, and optical path length [36].
FAQ 2: My biosensor signal is weak or noisy. What could be the cause?
A weak or noisy signal can stem from several issues. Follow this troubleshooting guide to diagnose the problem.
FAQ 3: How can I validate that my biosensor is reporting accurately?
Sensor validation is a critical step to ensure reliable data.
- Perform in-situ calibration: Treat cells with known perturbations and measure the response. Application of DTT (a reductant) should increase the TS/mC ratio, while H₂O₂ (an oxidant) should decrease it [36]. The magnitude and direction of this change confirm dynamic sensor function.
- Cross-reference with biochemistry: If possible, compare the biosensor readout with standard biochemical assays (e.g., enzymatic cycling assays) on parallel cell lysates under defined conditions. While these methods average population data, they can provide a benchmark [38].
- Test specificity: The NAPstar family has high specificity for NADP(H) over NAD(H). However, in systems with extreme NADH fluctuations, it is good practice to confirm that changes in NADH levels do not cross-react with your NAPstar sensor [36].
FAQ 4: Can I use NAPstars to screen for strains with improved NADPH regeneration?
Yes, this is one of the most powerful applications of these biosensors.
- Principle: A pathway that consumes NADPH will create a more oxidized NADP pool (lower TS/mC ratio). Strains with enhanced NADPH regeneration capacity will maintain a more reduced state (higher TS/mC ratio) under production conditions.
- Implementation:
- Transform your production strain library with the cytosolic NAPstar sensor (e.g., NAPstar3).
- Use Fluorescence-Activated Cell Sorting (FACS) to isolate the population of cells with the highest TS/mC ratio (most reduced state) during the production phase.
- Validate sorted strains in bioreactors for improved product titers and yields [39].
- Example: This approach could identify strains where engineering efforts, such as overexpressing glucose-6-phosphate dehydrogenase (G6PDH) in the pentose phosphate pathway, have successfully boosted NADPH supply [40] [12].
Detailed Experimental Protocol: Monitoring NADP(H) Redox Dynamics in a Bioreactor
This protocol outlines the steps for using NAPstars to monitor redox metabolism in an engineered microbe (e.g., E. coli or Y. lipolytica) during a fermentation process aimed at producing a high-value chemical like succinic acid [40].
Strain Construction and Cultivation
- Transformation: Clone your selected NAPstar variant (e.g., NAPstar3 for cytosolic measurement) into an appropriate expression vector with a compatible antibiotic resistance marker and promoter (e.g., a constitutive or inducible promoter) for your host [12].
- Pre-culture: Inoculate a single transformed colony into liquid medium with the appropriate antibiotic. Grow overnight to saturation under standard conditions (e.g., 30-37°C, 200 rpm).
- Bioreactor Inoculation: Dilute the pre-culture to a target OD600 (e.g., 0.1) in a bioreactor containing production medium. For studying nitrogen limitation-triggered acetol production in E. coli, this would be a modified M9 medium with glycerol as the carbon source [12].
Real-Time Monitoring and Sampling
- Online Monitoring: For suspended cells, use an online flow cytometer or at-line sampling with rapid flow cytometry to track the population distribution of the TS/mC ratio throughout the fermentation. This provides a real-time, population-level view of NADP(H) dynamics.
- Sampling for Microscopy:
- At key process phases (e.g., pre-induction, during exponential growth, at nitrogen depletion, and during stationary production), aseptically withdraw a small culture sample (1-2 mL) [12].
- Immediately immobilize cells on an agarose pad or in a microfluidic device for live-cell imaging to prevent changes in metabolic state.
Fluorescence Imaging and Data Analysis
- Image Acquisition: Use a widefield or confocal fluorescence microscope with the following settings:
- T-Sapphire: Ex ~400/30 nm, Em ~515/30 nm.
- mCherry: Ex ~560/40 nm, Em ~630/60 nm.
- Acquire images of both channels for each field of view with minimal exposure to avoid phototoxicity.
- Image Analysis:
- Use image analysis software (e.g., ImageJ/Fiji, CellProfiler).
- Segment individual cells and measure the mean fluorescence intensity in both the TS and mC channels for each cell.
- Calculate the ratiometric value: For each cell, compute Ratio = IntensityTS / IntensitymC.
- Plot the distribution of these ratios across the cell population over time.
Application Note: Troubleshooting NADPH Limitation in a Non-Canonical rTCA Pathway
Background: The engineered Yarrowia lipolytica strain Ncr12 uses a non-canonical reductive TCA (Nc-rTCA) pathway for high-yield succinic acid (SA) production. This pathway replaces NADH-dependent steps with an NADPH-dependent module (aspartate aminotransferase, aspartate ammonia-lyase, glutamate dehydrogenase). A sudden drop in SA production rate is observed, hypothesized to be caused by NADPH limitation [40].
Investigation using NAPstars:
- Hypothesis: The NADPH demand of the Nc-rTCA module exceeds the cell's regeneration capacity, leading to a more oxidized NADP pool and flux bottleneck.
- Experiment:
- Express mitochondria-targeted NAPstar7 in the Ncr12 production strain.
- Run parallel bioreactor cultivations with glucose feed.
- Monitor the mitochondrial NADPH/NADP+ ratio in real-time using at-line flow cytometry or microscopy and correlate with the SA production rate.
- Expected Outcome & Solution:
- If NADPH limitation is the cause: You will observe a sharp decrease in the NAPstar ratio (more oxidized state) just before the SA production rate declines.
- Solution: Implement metabolic engineering strategies to enhance mitochondrial NADPH supply. This could involve:
- Overexpressing NADK2 (the mitochondrial NAD+ kinase) to increase the NADP+ pool [37].
- Overexpressing NADPH-generating enzymes like mitochondrial malic enzyme (ME2) or isocitrate dehydrogenase (IDH2) [37].
- Re-engineering the pathway to use a different, less NADPH-intensive route, as demonstrated by the SubNetX computational algorithm [41].
FAQs: Addressing NADPH Limitation in Engineered Pathways
Q1: What are the common metabolic symptoms of NADPH limitation in my engineered E. coli strain? A1. You may observe a significant slowdown or cessation of product formation, especially for compounds like acetol or fatty acids whose synthesis directly consumes NADPH. The cell might also exhibit reduced growth rates and re-route carbon fluxes, for instance, reducing the flux through the TCA cycle, to cope with the redox imbalance. Monitoring extracellular metabolites can reveal the accumulation of precursor metabolites and a decrease in product yield [12].
Q2: How can I engineer a pathway to bypass NADPH limitation in the reductive TCA cycle for succinic acid production? A2. A successful strategy involves designing a non-canonical reductive TCA (Nc-rTCA) pathway. This replaces the native, NADH-dependent steps (from oxaloacetate to fumarate) with an NADPH-dependent module. The engineered cascade uses enzymes like aspartate aminotransferase (AAT), aspartate ammonia-lyase (AAL), and glutamate dehydrogenase (GDH). This effectively decouples succinic acid synthesis from NADH availability and leverages the NADPH pool, resulting in a significant increase in product yield [40].
Q3: My cyanobacterial biofuel production is low. Could NADPH availability be a factor despite its photosynthetic capacity? A3. Yes. Although cyanobacteria generate NADPH via photosynthesis, introducing a strong heterologous pathway can still create an unexpected drain on the cofactor pool. A common issue is the use of genetic parts (e.g., promoters, RBS) optimized for E. coli that function poorly in cyanobacteria, leading to low and unbalanced expression of pathway enzymes. This can cause metabolic bottlenecks and NADPH wastage. Always use genetic parts specifically characterized for cyanobacteria to ensure efficient pathway expression [42].
Q4: What practical steps can I take to improve NADPH availability in E. coli? A4. Several strategies can be employed:
- Overexpress the Pentose Phosphate Pathway (PPP): Modifying the strain to increase carbon flux through the oxidative PPP is a primary method for enhancing NADPH generation.
- Cofactor Engineering: Substitute NADH-dependent enzymes in your biosynthetic pathway with NADPH-dependent alternatives, or engineer enzyme specificity.
- Express Transhydrogenases: Enzymes like PntAB can convert NADH to NADPH, helping to balance the cofactor ratio.
- Use Reduced Carbon Substrates: Substrates like glycerol, which is more reduced than glucose, can provide a thermodynamic advantage and reduce the net NADPH demand of the pathway [12] [40] [43].
Troubleshooting Guides
Guide 1: Low Product Yield in NADPH-Dependent Bioproduction
| Symptom | Possible Cause | Investigation & Solution |
|---|---|---|
| Low titer of target product (e.g., acetol, fatty acids) | Insufficient NADPH supply | Investigate: Measure intracellular NADPH/NADP+ ratio. Analyze flux through central carbon metabolism (e.g., via 13C-flux analysis). Solve: Overexpress PPP genes (e.g., zwf for glucose-6-phosphate dehydrogenase) or introduce transhydrogenases [12] [43]. |
| Feedback inhibition from pathway intermediates | Investigate: Check for accumulation of acyl-ACPs (in fatty acid synthesis) or other intermediates. Solve: Overexpress an acyl-ACP thioesterase to hydrolyze acyl-ACPs into FFAs and relieve inhibition on key enzymes like ACC [43]. | |
| High byproduct accumulation (e.g., acetate, malate) | Imbalanced pathway expression | Investigate: Analyze extracellular metabolite profiles. Use proteomics to check relative enzyme levels. Solve: Optimize promoter strengths and RBS for each gene in the pathway to ensure stoichiometric expression [44]. |
| Production stops after initial growth phase | Nutrient limitation (e.g., nitrogen) triggering metabolic shutdown | Investigate: Monitor nutrient levels (NH4+). Check if production is growth-associated. Solve: Develop a fed-batch strategy with controlled nutrient feeding to decouple growth from production and maintain metabolic activity [12]. |
Guide 2: Cyanobacterial Host-Specific Challenges
| Symptom | Possible Cause | Investigation & Solution |
|---|---|---|
| No product detected in engineered cyanobacteria | Non-functional heterologous expression system | Investigate: Verify gene insertion and transcription. Check if the E. coli promoter (e.g., lac) is functional in your cyanobacterial strain. Solve: Use characterized native cyanobacterial promoters (e.g., light-inducible, constitutive) and optimize RBS sequences for cyanobacteria [42]. |
| Low productivity despite confirmed gene expression | Metabolic burden or suboptimal carbon fixation | Investigate: Measure growth rate and photosynthetic efficiency. Solve: Fine-tune gene expression levels to minimize burden. Explore engineering RuBisCO or introducing carbon-concentrating mechanisms to enhance CO2 fixation and carbon supply [42]. |
| Culture collapse or poor growth | Toxicity of the biofuel product | Investigate: Monitor cell viability and morphology over time. Solve: Engineer product tolerance through adaptive laboratory evolution (ALE). Implement in situ product removal (ISPR) techniques to keep product concentrations low in the culture [42]. |
Key Experimental Protocols
Protocol 1: 13C-Flux Analysis for Monitoring Metabolic Flux Redistribution
This protocol is used to quantify intracellular metabolic fluxes, crucial for identifying NADPH limitation and verifying the success of engineering strategies [12].
- Strain Cultivation: Cultivate your engineered strain (e.g., E. coli) in a defined minimal medium with a 13C-labeled carbon source (e.g., 2-13C glycerol) as the sole carbon source.
- Sampling: Take samples during both the exponential growth phase and the production phase (e.g., under nitrogen limitation).
- Metabolite Extraction: Quench metabolism rapidly (e.g., using cold methanol). Extract intracellular metabolites.
- Mass Spectrometry (MS) Analysis: Analyze the labeling patterns of key metabolites and proteinogenic amino acids using Gas Chromatography-Mass Spectrometry (GC-MS).
- Flux Calculation: Use computational software to calculate the metabolic flux distribution that best fits the experimental mass isotopomer data, revealing flux rerouting in response to NADPH demand.
Protocol 2: Quantifying NADPH/NADP+ Ratio
Monitoring the cofactor ratio is essential for diagnosing NADPH limitation [12].
- Rapid Sampling: Quickly sample cell broth directly into cold perchloric acid to stabilize the cofactors (oxidized forms are stable at acidic pH).
- Neutralization: Centrifuge the sample and neutralize the supernatant with appropriate amounts of K2HPO4 and KOH.
- HPLC-UV Analysis: Analyze the neutralized extract using High-Performance Liquid Chromatography with UV detection (HPLC-UV). A LiChrospher RP-18 column is used with a gradient of two buffers (e.g., phosphate buffer with tetrabutylammonium hydrogen sulfate and methanol).
- Quantification: Identify and quantify NADP+ and NADPH by comparing their retention times and peak areas with known standards.
Pathway and Process Visualization
NADPH-Centric View of Engineered Pathways
Experimental Workflow for Troubleshooting NADPH Limitation
The Scientist's Toolkit: Research Reagent Solutions
| Category | Reagent / Material | Function in the Context of NADPH Engineering |
|---|---|---|
| Analytical Tools | 2-13C Glycerol | A stable isotope-labeled carbon source used in 13C-flux analysis to trace metabolic fluxes and identify bottlenecks in central carbon metabolism [12]. |
| HPLC-UV with LiChrospher RP-18 column | Used for the separation and quantification of intracellular cofactors like NADPH and NADP+ to monitor the redox state of the cell [12]. | |
| Enzymes & Pathway Components | Acyl-ACP Thioesterase (e.g., TesA') | Hydrolyzes acyl-ACPs to release free fatty acids (FFAs), relieving feedback inhibition on fatty acid biosynthesis and indirectly increasing demand for NADPH [43]. |
| Aspartate Ammonia-Lyase (AAL) | A key enzyme in the non-canonical reductive TCA (Nc-rTCA) pathway, helping to bypass NADH-dependent steps for succinate production by utilizing NADPH [40]. | |
| NADPH-dependent Aldehyde Oxidoreductase (yqhD) | Converts methylglyoxal to acetol in an engineered E. coli pathway, directly consuming NADPH and helping to maintain cofactor balance [12]. | |
| Genetic Parts | Cyanobacteria-Optimized Promoters/RBS | Genetic parts specifically characterized for use in cyanobacteria (e.g., native constitutive or light-inducible promoters) to ensure reliable expression of heterologous pathways, avoiding failed expression that wastes NADPH [42]. |
| Strain Engineering | E. coli BW25113 | A common parent strain for metabolic engineering, used as a base for constructing production hosts, such as acetol-producing strains [12]. |
| Yarrowia lipolytica Po1f | An oleaginous yeast strain used as a platform for engineering complex pathways like the Nc-rTCA cycle for high-yield succinic acid production [40]. |
FAQs: Core Concepts and Mechanisms
Q1: What is the fundamental mechanistic link between NADPH depletion and the induction of disulfidptosis? NADPH is an essential cofactor that provides the reducing power to convert cystine into cysteine. In cancer cells with high expression of the cystine transporter SLC7A11, glucose starvation or other insults cause NADPH depletion. This impairs cystine reduction, leading to its intracellular accumulation. The excess cystine induces "disulfide stress," resulting in aberrant disulfide bond formation within actin cytoskeletal proteins, which triggers cytoskeletal collapse and a unique form of cell death termed disulfidptosis [10] [21].
Q2: Why are certain gynecological cancers particularly vulnerable to disulfidptosis induction? Gynecological malignancies, including ovarian, cervical, and endometrial cancers, frequently overexpress SLC7A11 to sustain glutathione synthesis and maintain redox balance, which supports their rapid proliferation and survival. This very adaptation, however, creates a metabolic dependency and Achilles' heel. When these SLC7A11-high cells experience NADPH depletion, they become highly susceptible to disulfidptosis, as they continue to import cystine but cannot process it, leading to rapid disulfide stress [10].
Q3: How is disulfidptosis distinct from other programmed cell death pathways like ferroptosis or apoptosis? Disulfidptosis is molecularly and mechanistically distinct. It is characterized by aberrant disulfide bonding in the actin cytoskeleton and is independent of the classic apoptotic caspase activation or the iron-dependent lipid peroxidation that defines ferroptosis. Crucially, disulfidptosis is resistant to inhibitors of apoptosis, ferroptosis, and necrosis but can be mitigated by thiol-reducing agents like 2-mercaptoethanol (2-ME), which cleave the aberrant disulfide bonds [21].
Q4: What are the primary regulatory pathways that govern cellular susceptibility to disulfidptosis? Susceptibility is governed by three key regulatory hubs [10]:
- SLC7A11 Expression: Controlled by transcription factors like ATF4 (upregulates) and p53 (suppresses).
- NADPH Homeostasis: Regulated by glucose metabolism (e.g., the pentose phosphate pathway) and energy-sensing pathways like LKB1-AMPK.
- Actin Cytoskeletal Dynamics: The Rac-WAVE regulatory complex (WRC)-Arp2/3 pathway is essential for executing disulfidptosis, with NCKAP1 being a key promoter.
Troubleshooting Guides for Common Experimental Challenges
Table 1: Troubleshooting Disulfidptosis InductionIn Vitro
| Problem & Phenomenon | Potential Cause | Suggested Solution & Validation Experiment |
|---|---|---|
| Failed Disulfidptosis Induction: Expected cell death is not observed after glucose starvation in SLC7A11-high cells. | • Inadequate SLC7A11 expression.• Compensatory NADPH production from other sources (e.g., glutamine).• Insufficient duration of glucose deprivation. | • Validate SLC7A11 protein levels via Western blot. [10]• Combine glucose starvation with a GLUT inhibitor (e.g., Glutor) or an NADPH biosynthesis inhibitor (e.g., G6PD inhibitor, 6-AN).• Extend treatment time and monitor cell viability and actin network integrity (phalloidin staining) over 24-48 hours. [10] [21] |
| Non-Specific Cell Death: Cell death occurs but its mechanism is unclear, potentially involving apoptosis or ferroptosis. | • Off-target effects of chemical inducers.• The cell line undergoes co-occurring death pathways. | • Use specific pharmacological inhibitors: Z-VAD-FMK (apoptosis), Ferrostatin-1 (ferroptosis), Necrostatin-1 (necrosis). Disulfidptosis should proceed despite these. [21]• Confirm disulfidptosis by demonstrating rescue with 2-Mercaptoethanol (2-ME). [21] |
| Inconsistent Results Between Cell Lines: Induction works in one gynecological cancer cell line but not another. | • Genetic heterogeneity affecting key genes (e.g., NRF2, p53, LKB1 status).• Differences in baseline metabolic flux and NADPH/NADP+ ratio. | • Perform genomic profiling of key regulators (NRF2, p53, LKB1).• Measure the intracellular NADPH/NADP+ ratio using commercial kits or biosensors (e.g., NERNST biosensor) to assess redox state before and during induction. [1] |
| Difficulty in Visualizing Actin Collapse: Phalloidin staining does not show clear cytoskeletal disruption. | • Fixation or staining protocol issues.• Cell death may have occurred before significant actin aggregation. | • Optimize fixation and staining protocols for actin cytoskeleton visualization.• Perform time-lapse imaging to capture the dynamic process of actin network collapse following induction. [10] |
Table 2: TroubleshootingIn Vivoand Preclinical Experimentation
| Problem & Phenomenon | Potential Cause | Suggested Solution & Validation Experiment |
|---|---|---|
| Low Efficacy in Mouse Models: The disulfidptosis-inducing regimen shows minimal tumor growth inhibition. | • Poor bioavailability or rapid clearance of the inducing agent.• Tumor microenvironment (TME) provides alternative nutrients (e.g., glutamine) that sustain NADPH. [10] | • Utilize nanodelivery systems (e.g., FeOOH@Fe-Ap@Au nanoparticles) to improve tumor-specific targeting and drug delivery. [10]• Combine NADPH-depleting strategies with drugs that block compensatory pathways (e.g., glutaminase inhibitors). |
| Unexpected Systemic Toxicity: Adverse effects observed in treated animals. | • Lack of selectivity for cancer cells; normal tissues with high SLC7A11 expression may be affected. | • Employ prodrug strategies activated specifically in the tumor microenvironment (e.g., by high ROS or specific enzymes).• Carefully monitor markers of organ function and perform histopathological analysis on key organs. |
| Therapy Resistance Emergence: Tumors initially respond but later relapse. | • Selection for tumor cell clones with low SLC7A11 expression or upregulated NADPH regeneration capacity. | • Analyze post-treatment tumor samples for SLC7A11 expression and mutations in key genes (e.g., KEAP1/NRF2).• Develop combination therapies upfront, such as pairing disulfidptosis inducers with immune checkpoint inhibitors, to prevent outgrowth of resistant clones. [10] |
Experimental Protocols for Key Methodologies
Protocol 1: Inducing and Validating Disulfidptosis via Glucose Starvation
Principle: To mimic metabolic stress and deplete NADPH, specifically targeting SLC7A11-high cancer cells for disulfidptosis [10] [21].
Materials:
- SLC7A11-high gynecological cancer cell line (e.g., validated ovarian cancer cell line).
- Glucose-free cell culture medium.
- Standard cell culture medium (with high glucose, as control).
- Phalloidin stain (e.g., conjugated with Alexa Fluor 488/594).
- Cell viability assay kit (e.g., MTT, CellTiter-Glo).
- 2-Mercaptoethanol (2-ME).
- Specific inhibitors for other cell death pathways (e.g., Z-VAD-FMK, Ferrostatin-1).
Procedure:
- Cell Seeding: Seed cells in standard medium and allow to adhere overnight (~70% confluence).
- Induction: Replace the medium with either:
- Experimental Group: Glucose-free medium.
- Control Group: Standard high-glucose medium.
- Rescue Group: Glucose-free medium supplemented with 2-ME (e.g., 1-2 mM).
- Incubation: Incubate cells for a predetermined period (e.g., 6-24 hours) based on preliminary kinetics data.
- Validation & Analysis:
- Viability Assay: Quantify cell death using a viability assay at the end of the incubation period. Expect significant death only in the experimental group, which is rescued by 2-ME.
- Specificity Check: Repeat induction in the presence of apoptosis/ferroptosis inhibitors. Disulfidptosis should proceed.
- Morphological Confirmation: Fix cells and perform phalloidin staining to visualize F-actin. Look for actin filament collapse and aggregation, distinct from the organized stress fibers in control cells.
Protocol 2: Pharmacological Inhibition of NADPH Regeneration
Principle: To chemically inhibit the pentose phosphate pathway, a major source of NADPH, and synergize with SLC7A11 overexpression to induce disulfidptosis [10].
Materials:
- Glucose-6-phosphate dehydrogenase inhibitor (e.g., 6-Aminonicotinamide, 6-AN).
- Standard cell culture medium.
Procedure:
- Cell Seeding: Seed SLC7A11-high cells as in Protocol 1.
- Treatment: Treat cells with:
- Experimental Group: 6-AN (e.g., 10-100 µM) in standard glucose medium.
- Control Group: Standard glucose medium with DMSO vehicle.
- Incubation & Analysis: Incubate for 24-48 hours. Monitor cell viability and actin cytoskeleton integrity as described in Protocol 1. The combination of high SLC7A11 and G6PD inhibition should induce disulfidptosis even in the presence of glucose.
Pathway and Workflow Visualizations
Disulfidptosis Induction Pathway
Experimental Workflow for Validation
The Scientist's Toolkit: Research Reagent Solutions
Table 3: Essential Reagents for Disulfidptosis Research
| Reagent / Material | Function / Application | Key Considerations |
|---|---|---|
| SLC7A11-high Cell Lines | Essential in vitro models for studying disulfidptosis susceptibility. | Validate SLC7A11 expression (Western blot) in your chosen gynecological cancer cell lines (e.g., OVCA, cervical Ca) before experimentation. [10] |
| Glucose-free Medium | Primary tool for inducing NADPH depletion and disulfidptosis. | Ensure the use of proper control medium. The efficacy is highly dependent on the cell line's metabolic state and SLC7A11 levels. [10] [21] |
| G6PD Inhibitors (e.g., 6-AN) | Pharmacological inhibitor of the oxidative pentose phosphate pathway to block NADPH regeneration. | Can be used in combination with glucose-containing medium to induce disulfidptosis. Titrate concentration to avoid excessive general toxicity. [10] |
| 2-Mercaptoethanol (2-ME) | Thiol-reducing agent used as a rescue control to confirm disulfidptosis. | Reverses aberrant disulfide bonds. The reversal of cell death by 2-ME is a key diagnostic feature distinguishing disulfidptosis from other death mechanisms. [21] |
| Actin Stains (e.g., Phalloidin) | Fluorescent dye to visualize F-actin and confirm cytoskeletal collapse. | A hallmark phenotypic readout. Look for loss of filamentous structure and formation of abnormal actin aggregates. [10] |
| NADPH/NADP+ Assay Kits | To quantitatively measure the intracellular NADPH/NADP+ ratio. | Provides direct biochemical evidence of NADPH depletion following treatment. Critical for validating the mechanism of your inducer. [1] |
| Nanodelivery Systems (e.g., FeOOH@Fe-Ap@Au) | Advanced delivery vehicles to target disulfidptosis inducers to tumors in vivo. | Enhances specificity and efficacy while reducing systemic toxicity in preclinical models. Can be designed to synchronize multiple therapies (e.g., disulfidptosis with ferroptosis). [10] |
Advanced Tools for System-Wide Troubleshooting and Pathway Optimization
CRISPRi Screening for High-Throughput Identification of NADPH-Consuming Gene Targets
Frequently Asked Questions (FAQs) and Troubleshooting Guide
This section addresses common challenges encountered during CRISPRi screening experiments designed to identify NADPH-consuming gene targets. The guidance is framed within the context of overcoming NADPH limitations in engineered pathways.
Table: Troubleshooting Common CRISPRi Screening Issues
| Problem Scenario | Potential Cause | Recommended Solution |
|---|---|---|
| Low sgRNA mapping rate [45] | General sequencing issue; non-specific reads. | Ensure the absolute number of mapped reads is sufficient. A low rate itself does not compromise reliability if sequencing depth is adequate (≥200x coverage) [45]. |
| Variable performance among sgRNAs targeting the same gene [45] | Intrinsic differences in sgRNA editing efficiency due to sequence-specific properties. | Design at least 3-4 sgRNAs per gene to mitigate the impact of individual sgRNA performance variability and ensure robust results [45]. |
| No significant gene enrichment in screen [45] | Insufficient selection pressure applied to the experimental group. | Increase selection pressure and/or extend the screening duration to allow for greater enrichment of cells with the desired phenotype [45]. |
| Unexpected positive LFC in negative screens (and vice versa) [45] | Statistical artifact from the Robust Rank Aggregation (RRA) algorithm when calculating gene-level LFC from sgRNA medians. | This can be a normal algorithmic outcome. Focus on the overall hit ranking and validation [45]. |
| Large loss of sgRNAs in sample [45] | Pre-screening: Insufficient initial library coverage.Post-screening: Excessive selection pressure. | Re-establish the CRISPR library cell pool with adequate coverage. If post-screening, reduce selection pressure [45]. |
| High off-target effects [46] | Cas9 enzyme cuts at unintended genomic sites with sequence similarity. | Design highly specific gRNAs using online prediction tools and employ high-fidelity Cas9 variants to enhance specificity [46]. |
| Low editing efficiency [46] | Suboptimal gRNA design, ineffective delivery method, or low expression of CRISPR components. | Verify gRNA targets a unique sequence, optimize delivery (electroporation, lipofection), and confirm strong promoter activity for Cas9/gRNA expression [46]. |
Assessing Screen Success and Hit Prioritization
How can I determine if my CRISPRi screen was successful? The most reliable method is to include well-validated positive-control genes and their corresponding sgRNAs in your library. Significant enrichment or depletion of these controls strongly indicates effective screening conditions. Alternatively, assess the degree of cell killing under selection and the distribution of sgRNA abundance (log-fold changes) [45].
Should I prioritize candidate genes by RRA score ranking or by combining LFC and p-value?
- RRA Score: Prioritizing by RRA score is generally recommended, as it integrates multiple metrics into a composite score, providing a comprehensive ranking. However, it lacks a clear cutoff for candidate selection [45].
- LFC + p-value: This common approach allows for explicit cutoff settings but may yield a higher proportion of false positives as it relies on only two parameters [45]. A combined strategy, using RRA for primary ranking and LFC/p-value for secondary filtering, can be effective.
Experimental Protocols for Key Workflows
Protocol: Genome-Scale CRISPRi Library Screen
This protocol outlines the steps for performing a pooled CRISPRi screen to identify genes whose repression confers a phenotype related to NADPH consumption, such as improved fitness under NADPH limitation.
1. Library Design and Cloning [47] [48]:
- Select a nuclease-deficient Cas protein (dCas9, dCas12a, or dCas13d) suitable for your host organism (e.g., E. coli or M. tuberculosis) [47] [48] [49].
- Design a sgRNA library targeting the protein-coding genome. A common design includes 3-6 sgRNAs per gene, with variations in predicted strength and Protospacer Adjacent Motif (PAM) binding affinity [48].
- Clone the pooled sgRNA oligonucleotides into the appropriate CRISPRi plasmid backbone via golden gate assembly or restriction digestion/ligation.
2. Library Transformation and Cell Pool Preparation:
- Transform the sgRNA plasmid library into a strain expressing the dCas protein. Use electroporation to ensure high efficiency.
- Plate the transformation on large, square bioassay plates to maintain library diversity. Collect all transformants to create the initial cell pool.
- Quality Control: Sequence the plasmid library pre- and post-transformation to verify coverage. Ensure >200x coverage per sgRNA and >99% library representation [45].
3. Screening under Selection Pressure:
- Inoculate the library cell pool into the main screening culture. Include a portion of the pool as an "T0" reference sample.
- Apply the selection pressure. For identifying NADPH-consuming targets, this could involve:
- Culture cells for multiple generations (e.g., 5-14 days), with periodic back-dilution to maintain log-phase growth [48]. Harvest genomic DNA from the final population and the "T0" reference.
4. Sequencing and Data Analysis [45] [48]:
- Amplify the sgRNA region from genomic DNA and prepare libraries for next-generation sequencing.
- Sequence to a depth of at least 200x per sgRNA. The required data volume can be estimated as:
Required Data Volume = Sequencing Depth × Library Coverage × Number of sgRNAs / Mapping Rate[45]. - Align sequencing reads to the sgRNA reference list.
- Use specialized analysis tools like MAGeCK (which incorporates RRA and MLE algorithms) to identify significantly enriched or depleted sgRNAs and genes between the T0 and final populations [45].
Protocol: Flux Analysis to Validate NADPH-Related Targets
After identifying candidate NADPH-consuming genes, this protocol uses 13C metabolic flux analysis to confirm the metabolic rerouting resulting from their repression [12] [16].
1. Strain Validation and Cultivation:
- Construct specific CRISPRi strains for top candidate genes and a non-targeting control.
- Cultivate the engineered strain in a controlled bioreactor. For acetol production in E. coli, for example, use a defined medium with glycerol as the sole carbon source [12] [16].
- Trigger gene repression (e.g., with an inducer) upon nitrogen depletion to decouple growth from production.
2. 13C Labeling and Sampling:
- Switch the carbon source to a labeled substrate (e.g., 2-13C glycerol) during the production phase [12].
- Take frequent samples of the culture broth to measure extracellular metabolites (substrates and products) and intracellular metabolites.
3. Metabolite Analysis and Flux Calculation:
- Quench metabolism rapidly (e.g., using cold methanol).
- Extract intracellular metabolites and analyze them via GC-MS or LC-MS to determine the labeling patterns in central metabolic intermediates [12].
- Use the labeling data and extracellular flux measurements to compute intracellular metabolic fluxes using computational software (e.g., COBRA Toolbox). The results will show flux rerouting, for instance, towards product biosynthesis like acetol to maintain NADPH/NADP+ balance [12] [16].
Research Reagent Solutions
Table: Essential Reagents for CRISPRi Screening in NADPH Research
| Reagent / Tool | Function / Description | Application Context |
|---|---|---|
| dCas9/dCas13d Effectors [47] [49] | Nuclease-deficient Cas proteins that bind DNA/RNA to block transcription or translation without cleaving the target. | dCas9 for transcriptional repression (Tx-CRISPRi); dCas13d for translational repression (Tl-CRISPRi) and independent operon gene regulation [47] [49]. |
| sgRNA Library | A pooled collection of plasmids each encoding a guide RNA targeting a specific gene. | For high-throughput, genome-wide functional screens. Design includes multiple sgRNAs per gene to ensure robustness [45] [48]. |
| MAGeCK Software [45] | Model-based Analysis of Genome-wide CRISPR-Cas9 Knockout; a computational tool for analyzing CRISPR screen data. | Identifies significantly enriched/depleted genes from sequencing data using RRA (single condition) or MLE (multiple conditions) algorithms [45]. |
| 2-13C Glycerol [12] [16] | A stable isotope-labeled carbon source for tracing metabolic pathways. | Used in 13C-flux analysis to elucidate intracellular flux distributions and confirm metabolic changes from gene repression [12] [16]. |
| NADPH Biosensor [50] | A genetically encoded system that reports intracellular NADPH levels, often coupled with fluorescence. | Enables FACS-based enrichment of cells with desired NADPH levels during CRISPRi screens or for dynamic regulation [50]. |
| Attenuated Guide RNAs [49] | Engineered gRNAs with modified handle structures that provide tunable levels of repression. | Allows for fine-tuning gene expression to balance metabolic flux and growth, avoiding complete gene knockout that can be lethal [49]. |
Workflow and Pathway Visualizations
CRISPRi Screen for NADPH Targets
NADPH-Consuming Acetol Pathway
A primary bottleneck in the industrial production of biofuels, pharmaceuticals, and specialty chemicals in engineered microbes is the imbalanced availability of redox cofactors, particularly the limited supply of Nicotinamide adenine dinucleotide phosphate (NADPH). This technical support center is built upon the Cofactor Engineering via CRISPRi Screening (CECRiS) framework, a systematic approach that leverages the power of CRISPR interference (CRISPRi) to diagnose and remedy cofactor imbalances in metabolic pathways. The following guide provides detailed troubleshooting and frequently asked questions (FAQs) to assist researchers in implementing CECRiS to overcome NADPH limitations, thereby enhancing the production yields of target compounds.
Core CECRiS Concepts and Workflow
The CECRiS framework utilizes programmable CRISPRi libraries to systematically repress target genes and identify those whose knockdown optimizes NADPH availability and flux toward your desired product.
Conceptual Workflow Diagram
The following diagram illustrates the core logical workflow of a CECRiS experiment:
Key Metabolic Pathways for Cofactor Engineering
A fundamental understanding of central carbon metabolism is crucial for selecting gene targets in a CECRiS screen. The diagram below maps key enzymes and pathways involved in NADPH generation that can be targeted.
CECRiS Troubleshooting Guide: FAQs and Solutions
FAQ 1: How much sequencing depth is required for a CECRiS screen?
For reliable results, each sample should achieve a sequencing depth of at least 200x [45]. The total data volume required can be calculated using the formula: Required Data Volume = Sequencing Depth × Library Coverage × Number of sgRNAs / Mapping Rate. For a typical genome-wide library, this often translates to approximately 10 Gb per sample [45].
FAQ 2: Why do different sgRNAs targeting the same gene show variable performance?
Editing efficiency is highly influenced by the intrinsic properties of each sgRNA sequence [45]. To ensure robust and reproducible results, it is critical to design at least 3-4 sgRNAs per gene [45]. This strategy mitigates the impact of variability from any single, poorly performing sgRNA.
FAQ 3: What should I do if my CECRiS screen shows no significant gene enrichment?
A lack of significant enrichment is often not a statistical error, but rather a result of insufficient selection pressure during the screen [45]. To resolve this:
- Increase the selection pressure on the microbial population.
- Extend the duration of the screening process to allow for greater enrichment or depletion of sgRNAs.
- Validate that your positive control genes show the expected significant enrichment or depletion [45].
FAQ 4: How can I validate the functional impact of gene knockdowns on NADPH balance?
Direct measurement of intracellular NADPH/NADP+ ratios can be performed using HPLC-UV analysis of extracts from cells quenched in perchloric acid to stabilize oxidized cofactors [12]. Furthermore, the functional outcome of balanced cofactors can be assessed by measuring the titer of your target product, such as acetol [12] [16] or pyridoxine [51].
FAQ 5: What are the best analytical tools for CECRiS screen data analysis?
The MAGeCK (Model-based Analysis of Genome-wide CRISPR-Cas9 Knockout) tool is currently the most widely used software for this purpose [45]. It incorporates two primary statistical algorithms:
- RRA (Robust Rank Aggregation): Ideal for single-condition comparisons (e.g., one treatment vs. one control).
- MLE (Maximum Likelihood Estimation): Better suited for multi-condition experiments, providing improved statistical power [45].
Troubleshooting Common Experimental Issues
Table 1: Troubleshooting CECRiS Screening Challenges
| Problem | Potential Cause | Solution | Preventive Measure |
|---|---|---|---|
| Large loss of sgRNAs in final sample [45] | Excessive selection pressure; insufficient initial library coverage. | Re-establish library cell pool with adequate coverage; reduce selection pressure. | Ensure library coverage >99% in initial cell pool [45]. |
| Low mapping rate in sequencing [45] | Reads not aligning to sgRNA reference list. | Ensure absolute number of mapped reads is sufficient (depth ≥200x). | Optimize sequencing library preparation. |
| High variability between biological replicates (Pearson correlation <0.8) [45] | Technical noise or low reproducibility. | Perform pairwise comparisons and use Venn analysis to find overlapping hits. | Increase initial cell number; ensure consistent culture handling. |
| Unexpected LFC signs (e.g., positive in negative screen) [45] | RRA algorithm calculates gene LFC as median of sgRNA LFCs; extreme values skew results. | Inspect individual sgRNA LFCs for the gene of interest. | Use multiple sgRNAs per gene to average out outliers [45]. |
Detailed Experimental Protocols
Protocol 1: CRISPRi Library Construction and Screening inE. coli
This protocol is adapted from studies that successfully generated combinatorial gene expression libraries to increase malonyl-CoA flux and 3HP production [52].
- Strain Engineering: Construct your production base strain using standard recombineering, deleting competing pathways (e.g.,
ldhA,poxB,pta-ackA) to minimize byproducts [12]. - CRISPRi System Setup: Introduce a plasmid expressing a modified native Type I-E CRISPR-Cas system and dCas9 repressor (e.g., with KRAB or other potent repressor domains [53]).
- gRNA Array Construction: Use an iterative cloning strategy to build guide RNA arrays targeting six or more genes involved in central carbon metabolism and cofactor balance [52].
- Library Transformation and Culture: Transform the library into your production host. Grow the library to high coverage (>99%) to prevent stochastic loss of sgRNAs. Apply selection pressure (e.g., nitrogen limitation [12] [16]) to trigger product formation and create a selective advantage for strains with improved NADPH balance.
- Sorting & Sequencing: After screening, harvest cells. Extract genomic DNA from the population and amplify the integrated sgRNA constructs for next-generation sequencing [45].
Protocol 2: Intracellular Cofactor Extraction and Quantification
This protocol is critical for directly validating the NADPH/NADP+ balance in your engineered strains [12].
- Sampling and Quenching: Rapidly sample 4 mL of cell broth directly into 1 mL of ice-cold perchloric acid, thoroughly mixing in an overhead shaker for 15 min at 4°C. The acidic pH stabilizes oxidized cofactors (NADP+) [12].
- Neutralization: Neutralize the sample with appropriate amounts of 1 M K₂HPO₄ and 5 M KOH while shaking in an ice-water bath.
- Clarification: Centrifuge the neutralized sample at >4,600 × g for 10 min at 4°C. Collect and store the supernatant at -20°C.
- HPLC-UV Analysis: Perform analysis using a system equipped with a RP-18 column. Use a gradient of two buffers:
- Buffer A: 0.1 M potassium phosphate buffer (pH 6.0) with 4 mM tetrabutylammonium hydrogen sulfate (TBAHS) and 0.5% (v/v) methanol.
- Buffer B: Methanol or acetonitrile-based eluent [12]. Quantify cofactors by comparing retention times and peak areas to known standards.
The Scientist's Toolkit: Key Research Reagents
Table 2: Essential Reagents for CECRiS Implementation
| Reagent / Tool | Function / Application | Example / Specification |
|---|---|---|
| dCas9-Repressor Fusion | Programmable transcriptional repressor; core of CRISPRi. | dCas9-ZIM3(KRAB)-MeCP2(t) for enhanced repression [53]. |
| Arrayed CRISPRi Library | Targets multiple genes for systematic knockdown. | Custom library targeting central carbon metabolism genes and all 397 transporters [54]. |
| NADPH Quantification Kit | Measures intracellular NADPH/NADP+ ratio. | HPLC-UV protocol with perchloric acid quenching [12]. |
| Fluorescence-Activated Cell Sorter (FACS) | High-throughput screening based on fluorescence. | Used to sort top/bottom 5-10% of cells based on a fluorescent reporter [45]. |
| MAGeCK Software | Bioinformatics analysis of CRISPR screen data. | Uses RRA and MLE algorithms for hit identification [45]. |
| 13C-Labeled Substrate | For metabolic flux analysis (13C-MFA). | 2-13C glycerol to trace carbon flux and NADPH sinks [12]. |
| NAD+ Regeneration System | Augments cofactor balance. | Heterologous NADH oxidase (Nox) to oxidize NADH to NAD+ [51]. |
The CECRiS framework provides a powerful, systematic methodology for overcoming one of the most persistent challenges in metabolic engineering: NADPH limitation. By integrating the troubleshooting guides, detailed protocols, and reagent toolkit provided herein, researchers and drug development professionals can effectively design and execute screens to rewire microbial metabolism. This approach enables the development of superior biocatalysts for the high-yield, sustainable production of valuable chemicals and pharmaceuticals.
SubNetX Technical Support Center
Core Concepts & Frequently Asked Questions (FAQs)
Q1: What is SubNetX and what specific problem does it solve in metabolic engineering? SubNetX is a computational algorithm designed to extract reactions from biochemical databases and assemble them into stoichiometrically balanced subnetworks for the production of target biochemicals. It addresses the critical challenge that the synthesis of complex molecules often requires reactions from multiple pathways that must operate in balanced subnetworks not pre-assembled in existing databases. This enables the reconstruction and ranking of alternative biosynthetic pathways based on yield, length, and other design goals for whole-cell biocatalyst development [55].
Q2: How does SubNetX differ from other pathway analysis tools like graph mining or motif finding? Unlike motif finding and graph mining that look for small, arbitrary, and commonly occurring substructures, SubNetX is designed to discover larger, specific, and infrequently occurring substructures. For example, while a motif might be a three-gene feedforward loop, a SubNetX subnet could be a specific 10-reaction MAPK pathway. This makes it particularly valuable for identifying complete functional pathways rather than common small patterns [56].
Q3: My model fails stoichiometric balance checking. What are the most common causes? Imbalanced subnetworks typically result from: (1) Missing auxiliary reactions for cofactor regeneration (especially NADPH/NADP+ balance), (2) Incomplete transport reactions for extracellular metabolites, (3) Incorrect reaction directionality constraints, or (4) Gaps in energy currency (ATP/ADP) balancing. Focus first on verifying NADPH-dependent reaction pairs and ensure your cofactor regeneration loops are closed [57] [58].
Q4: What file formats does SubNetX support for model input and output?
SubNetX operates with Systems Biology Markup Language (SBML) community standard files, which is the widely accepted format for representing biochemical network models. For Python-based implementations, the pySubNetSB package can be installed via pip install pySubNetSB and is available on GitHub [56].
Q5: How can I improve computational performance when working with large metabolic networks? The subnet discovery problem is NP-hard, with naive approaches requiring up to 10^78 evaluations for modest-sized networks. The pySubNetSB implementation reduces this to a more practical 10^8 evaluations through optimized algorithms. For further improvement, consider breaking large problems into smaller functional modules and utilizing high-performance computing resources [56].
Troubleshooting Common Experimental Issues
Issue 1: Inadequate NADPH Regeneration Limiting Product Yield
- Problem Identification: Reduced product formation despite sufficient carbon flux, often accompanied by accumulation of pathway intermediates.
- Solution: Implement an alternative NADPH regeneration system. Replace NAD+-dependent glyceraldehyde-3-phosphate dehydrogenase (GAPDH) with NADP+-dependent versions (e.g., GDH, gapB, or GDP1). In yeast, consider modulating ZWF1 expression to redirect flux from the oxidative pentose phosphate pathway [59] [58].
- Experimental Protocol:
- Amplify NADP+-GAPDH gene (e.g., GDP1) with appropriate promoter terminators.
- Clone into expression vector with selection marker.
- Transform into host strain with knocked-out native GAPDH (TDH3).
- Verify enzyme activity assay: Measure GAPDH activity with NADP+ vs NAD+ cofactors.
- Monitor intracellular NADPH/NADP+ ratio using HPLC-UV analysis after perchloric acid extraction [57] [59].
Issue 2: Failure to Identify Theoretically Valid Pathways
- Problem: SubNetX returns no viable pathways for known producible targets.
- Diagnosis: This often stems from overly restrictive constraint settings or database gaps.
- Troubleshooting Steps:
- Verify reaction database completeness for your organism.
- Adjust cofactor specificity constraints (NADPH vs NADH).
- Check precursor metabolite availability in your host.
- Relax pathway length constraints and manually inspect intermediate results.
- Ensure mass and charge balancing is enabled for all reactions [55] [56].
Issue 3: Computationally Identified Pathways Fail in Vivo
- Problem: Pathways that are stoichiometrically balanced in silico do not produce expected titers in biological systems.
- Root Causes: Enzyme incompatibility, thermodynamic barriers, or toxicity of intermediates.
- Validation Protocol:
- Test individual enzyme activities in host background.
- Measure intermediate metabolite accumulation (LC-MS).
- Analyze proteomic data to verify enzyme expression.
- Implement 13C-flux analysis during production phase to confirm in vivo fluxes [57].
- Gradually induce pathway expression while monitoring cell growth [58].
Quantitative Data for Pathway Design
Table 1: Computational Performance Metrics for Subnet Discovery
| Network Size (Reference→Target) | Naive Approach Complexity | pySubNetSB Complexity | Speedup Factor |
|---|---|---|---|
| 20 reactions → 100 reactions | ~10^78 evaluations | ~10^8 evaluations | 10^70 |
| 10 species → 100 species |
Table 2: NADPH Engineering Strategies for Improved Metabolite Production
| Engineering Strategy | Host Organism | Target Product | Production Improvement | Key Genetic Modification |
|---|---|---|---|---|
| Alternative NADP+-GAPDH | S. cerevisiae | Ethanol from xylose | 13.5% higher yield | ZWF1 knockdown; TDH3→GDP1 replacement |
| NADPH Regeneration rerouting | S. cerevisiae | Protopanaxadiol | 11-fold increase | ALD2→ALD6 replacement; zwf1Δ |
| Cofactor balancing via pathway design | E. coli | Acetol from glycerol | Enabled production | mgsA + yqhD expression under N-limitation |
Experimental Protocols for NADPH-Limited Systems
13C-Metabolic Flux Analysis Protocol for NADPH Utilization
Purpose: Quantify intracellular metabolic fluxes, particularly NADPH-generating and utilizing pathways, during product formation [57].
Materials:
- 2-13C-labeled glycerol (or other carbon source)
- Bioreactor with controlled nutrient feed
- LC-MS system for isotopomer analysis
- Perchloric acid for metabolite extraction
Procedure:
- Cultivate engineered strain in minimal medium with natural abundance carbon source.
- At mid-exponential phase, pulse with 2-13C-labeled carbon source.
- Sample at 0, 30, 60, 120, and 240 seconds after labeling.
- Quench metabolism immediately in cold perchloric acid.
- Extract intracellular metabolites and analyze mass isotopomer distributions via LC-MS.
- Calculate metabolic fluxes using computational modeling software (e.g., INCA, OpenFlux).
- Focus on PPP flux, TCA cycle activity, and NADPH-generating reactions.
Intracellular Cofactor Quantification Protocol
Purpose: Measure NADPH/NADP+ ratios to diagnose cofactor limitations [57].
Procedure:
- Collect 4mL culture sample directly into 1mL ice-cold perchloric acid.
- Mix thoroughly in overhead shaker for 15 minutes at 4°C.
- Neutralize with appropriate amounts of 1M K₂HPO₄ and 5M KOH in ice water.
- Centrifuge at 4,696 × g for 10 minutes at 4°C.
- Collect supernatant and store at -20°C until analysis.
- Analyze cofactors using HPLC-UV with C18 reverse phase column.
- Use gradient elution with two buffers (Buffer A: potassium phosphate; Buffer B: methanol).
Pathway Diagrams and Workflows
SubNetX Pathway Assembly Workflow
NADPH Balancing in Engineered Pathways
Research Reagent Solutions
Table 3: Essential Research Reagents for NADPH Pathway Engineering
| Reagent / Tool | Function/Application | Example/Source |
|---|---|---|
| pySubNetSB | Python package for subnet discovery in SBML models | https://github.com/ModelEngineering/pySubNetSB/ [56] |
| 2-13C Glycerol | Tracer for metabolic flux analysis to quantify NADPH-generating pathways | Commercial isotope suppliers [57] |
| NADP+-GDH/gapB/GDP1 | Heterologous NADP+-dependent GAPDH enzymes for alternative NADPH regeneration | Cloned from respective organisms [59] |
| ALD6 | NADP+-dependent aldehyde dehydrogenase for NADPH regeneration in yeast | S. cerevisiae gene replacement [58] |
| ZWF1 modulators | Copper-repressing promoter to fine-tune glucose-6-phosphate dehydrogenase expression | Engineered promoter systems [59] |
| Perchloric Acid Extraction | Method for stabilizing oxidized cofactors (NADP+) during intracellular quantification | Standard protocol [57] |
| HPLC-UV with C18 column | Analytical method for quantifying NADPH/NADP+ ratios | Standard instrumentation [57] |
Technical Troubleshooting Guide: NAD(P)HX Repair System
Q1: My engineered S. cerevisiae strain for terpenoid production shows growth retardation and reduced product titers, despite solid pathway design. Could a problem with NADPH cofactors be the cause?
A1: Yes, this is a strong possibility. Impaired NADPH pools, potentially due to the accumulation of damaged cofactors, can severely impact pathways dependent on this cofactor, such as terpenoid biosynthesis.
- Underlying Cause: The central cofactors NADH and NADPH are prone to spontaneous or enzyme-catalyzed hydration, forming redox-inactive derivatives known as NAD(P)HX [60] [61] [62]. These damaged molecules can inhibit dehydrogenases and disrupt redox balance. The repair of these cofactors is essential for maintaining metabolic homeostasis, especially in engineered strains where cofactor demand is high.
- Diagnostic Experiment:
- Measure NAD(P)HX Levels: Use a validated LC-MS method to quantify NADHX/NADPHX in your cell extracts [62]. Compare the levels in your problematic strain against a control strain.
- Check Repair Enzyme Expression: Analyze the transcription and protein levels of the native NAD(P)HX repair enzymes in your host, NAXE (epimerase) and NAXD (dehydratase). Reduced expression could indicate a problem.
- Solution: Consider overexpressing the native NAXE and NAXD genes in your production host to bolster the metabolite repair system and ensure a healthy, functional NADPH pool [58].
Q2: I am working with a recombinant E. coli strain. During stress conditions like heat shock, cell viability plummets. What metabolite-related failure should I investigate?
A2: Failure of the NAD(P)HX repair system under stress is a primary suspect. Febrile and heat stress are known triggers for NAD(P)HX accumulation.
- Underlying Cause: Stressors like elevated temperature accelerate the chemical hydration of NAD(P)H, leading to a buildup of NAD(P)HX [62]. If the repair enzymes (NAXD/NAXE) are deficient or overwhelmed, these damaged cofactors accumulate and inhibit essential dehydrogenases.
- Diagnostic Experiment: Perform a temperature shift experiment. Cultivate your strain at standard and elevated temperatures and measure:
- Solution: Ensure robust expression of the repair enzymes. In E. coli, the epimerase and dehydratase activities are fused in a single protein encoded by
yjeF[60]. Overexpression ofyjeFmay enhance the strain's resilience to metabolic stress.
Q3: My patient-derived fibroblasts with a suspected mitochondrial disorder show inhibited growth in galactose medium and perturbations in serine levels. What pathway connects these observations?
A3: This is a classic signature of a failure in the de novo serine synthesis pathway, recently linked to NADHX accumulation due to NAXD deficiency [62].
- Underlying Cause: The first enzyme in the de novo serine synthesis pathway, phosphoglycerate dehydrogenase (PHGDH), is potently inhibited by NADHX [62]. When NADHX repair fails, this inhibition blocks the conversion of 3-phosphoglycerate to serine.
- Diagnostic Experiment:
- Confirm the accumulation of NADHX in patient fibroblasts using LC-MS.
- Perform stable isotope labeling (e.g., with U-¹³C-glucose) to trace flux through the serine synthesis pathway. You will likely see a reduced flux into serine and its derivatives.
- Solution: Research into therapeutic interventions is ongoing. Supplementation with NAD precursors (e.g., Nicotinamide Riboside, NR) or inosine has been shown to partially rescue cell viability in NAXD-deficient models by potentially bypassing the metabolic block [62].
Experimental Protocols for Investigating NAD(P)HX Repair
Protocol 1: Quantifying NAD(P)HX Levels in Cell Extracts using LC-MS
This protocol is adapted from methods used in recent studies on NAXD/NAXE deficiencies [62].
Principle: Liquid Chromatography-Mass Spectrometry (LC-MS) provides the specificity and sensitivity required to separate and quantify the damaged epimers (R- and S-NAD(P)HX) from their native cofactors.
Materials:
- Research Reagent Solutions:
- Extraction Solvent: Ice-cold 0.5 M Perchloric Acid
- Neutralization Solution: 1 M K₂HPO₄ / 5 M KOH
- LC-MS Mobile Phases: (A) LC-MS grade water with 0.1% formic acid; (B) Acetonitrile with 0.1% formic acid
- Internal Standard: Stable isotope-labeled NADHX (if available)
Procedure:
- Quenching and Extraction: Rapidly quench 1 mL of cell culture (OD₆₀₀ ~0.5-1.0) into 4 mL of ice-cold perchloric acid. Mix thoroughly in an overhead shaker for 15 min at 4°C.
- Neutralization: Centrifuge the mixture (e.g., 4,696 × g, 10 min, 4°C). Collect the supernatant and neutralize it to pH ~7.0 using pre-chilled K₂HPO₄ and KOH solutions. Keep the samples on ice during neutralization.
- Clarification: Centrifuge the neutralized sample again to remove the precipitated potassium perchlorate salt. Collect the supernatant and store at -80°C until analysis.
- LC-MS Analysis:
- Chromatography: Use a reversed-phase C18 column. Employ a gradient from 100% A to a higher percentage of B over 10-15 minutes.
- Mass Spectrometry: Operate the mass spectrometer in negative ion mode. Use Multiple Reaction Monitoring (MRM) for specific transitions of NADH, NADPH, and their respective hydrated forms (NADHX/NADPHX) for maximum sensitivity and accuracy.
Protocol 2: In Vitro Enzyme Inhibition Assay for PHGDH
This protocol tests the direct inhibitory effect of purified NADHX on a target dehydrogenase [62].
Principle: The activity of recombinant PHGDH is measured spectrophotometrically by monitoring the accumulation of its product, NADH, at 340 nm. The assay is run with and without the addition of purified NADHX.
Materials:
- Research Reagent Solutions:
- Assay Buffer: 50 mM Tris-HCl, pH 8.0
- Substrate Solution: 5 mM 3-Phosphoglycerate (3-PG)
- Cofactor Solution: 2 mM NAD⁺
- Inhibitor: Purified NADHX (synthesized as described in [60])
Procedure:
- Prepare Reaction Mix: In a cuvette, add:
- Assay Buffer (to a final volume of 1 mL)
- 3-PG (final concentration 0.5 mM)
- NAD⁺ (final concentration 0.2 mM)
- NADHX (varying concentrations, e.g., 0-100 µM)
- Initiate Reaction: Start the reaction by adding a defined amount of purified recombinant human PHGDH.
- Monitor Kinetics: Immediately measure the increase in absorbance at 340 nm for 5-10 minutes using a spectrophotometer.
- Calculate Activity: Compare the initial reaction rates (slope of the absorbance increase) in the presence and absence of NADHX to determine the degree of inhibition and calculate the IC₅₀ value.
Visualization of Pathways and Workflows
NADPH Metabolism and Repair Pathway
This diagram illustrates the core metabolic processes of NADPH generation, its utilization in biosynthesis, the cycle of damage, and the essential repair mechanism.
Diagram Title: NADPH Metabolism, Damage, and Repair Pathway
Experimental Workflow for Diagnosis
This workflow outlines the systematic process for diagnosing problems related to NAD(P)HX repair in a research setting.
Diagram Title: NADPHX Repair System Diagnostic Workflow
Research Reagent Solutions
The following table details key reagents and materials essential for experiments in this field.
Table: Essential Research Reagents for NAD(P)HX Repair Studies
| Reagent / Material | Function / Application | Key Details / Considerations |
|---|---|---|
| Purified NADHX/NADPHX | - Standard for LC-MS quantification- Inhibitor for in vitro enzyme assays | Chemically synthesized and purified [60]. Essential for method validation and mechanistic studies. |
| Anti-NAXE / Anti-NAXD Antibodies | - Protein expression validation (Western Blot)- Subcellular localization (Immunofluorescence) | Verify specificity for the target human, yeast, or bacterial protein isoforms. |
| HAP1 NAXD-/- Knockout Cells | - In vitro model for NAXD deficiency- Studying metabolic consequences of repair failure | Near-haploid human cell line. Useful for controlled experiments under galactose stress [62]. |
| Nicotinamide Riboside (NR) | - NAD⁺ precursor for rescue experiments- Investigating therapeutic interventions | Shown to partially rescue viability in NAXD-deficient cells [62]. |
| Stable Isotope Labels (e.g., U-¹³C-Glucose) | - Metabolic flux analysis (MFA)- Tracing perturbations in serine synthesis pathway | Reveals flux rerouting and identifies blocked pathways due to NADHX accumulation [62]. |
| Recombinant Human PHGDH | - Target enzyme for inhibition studies- Kinetic characterization | Directly used to demonstrate and quantify inhibition by NADHX [62]. |
Enhancing Photosynthetic Efficiency by Introducing Extra NADPH Consumption in Cyanobacteria
FAQs and Troubleshooting Guide
Q1: What is the core principle behind enhancing photosynthetic efficiency via extra NADPH consumption?
A1: The core principle addresses a fundamental imbalance in photosynthesis. The light reactions produce ATP and NADPH, but the dark reactions (Calvin cycle) consume them in a fixed ratio. Theoretical calculations show that linear electron transport produces approximately 2.57 ATP per 2 NADPH, while CO2 fixation requires 3 ATP per 2 NADPH [63]. This leaves an overcapacity of NADPH, leading to a backlog of electrons in the photosynthetic electron transport chain (ETC). This backlog causes over-reduction, activates photoprotective mechanisms that dissipate energy as heat, and ultimately limits photosynthetic efficiency. Introducing extra NADPH consumption acts as a metabolic sink, utilizing this overcapacity, reducing electron pressure on the ETC, and enhancing overall electron flux and photosynthetic yield [64] [65] [63].
Q2: What are common issues when expressing heterologous NADPH-consuming pathways in cyanobacteria?
A2:
- Cofactor Imbalance: Many bacterial enzymes are NADH-dependent, while cyanobacteria have an NADPH-abundant pool [66]. Expressing an NADH-dependent enzyme without modification may lead to very low activity.
- Insufficient Sink Capacity: A single heterologous sink may not be sufficient to utilize the full overcapacity of the ETC.
- Solution: Co-express multiple heterologous sinks. Research has shown that combining a sucrose export pathway (consuming ATP and NADPH) with a cytochrome P450 system (consuming primarily reductant) has an additive effect, further improving quantum yield and electron transport flux [64].
- Metabolic Burden & Product Toxicity: High expression of non-native pathways diverts resources from growth, and accumulated products can be toxic.
- Solution: Introduce product export systems, such as a lactate transporter (LldP) for organic acids, and optimize cultivation conditions like CO2 enrichment to enhance carbon fixation and mitigate toxicity [67].
Q3: How can I experimentally validate that my engineering strategy has improved photosynthetic efficiency?
A3: Key physiological parameters must be measured using specialized equipment like a Dual-PAM-100 or similar system:
- Quantum Yield of PSII (ΦII): An increase in ΦII, especially under higher light intensities, indicates a greater proportion of absorbed light is used for photochemistry, a direct sign of improved efficiency [64].
- P700+ Oxidation State: Measured via absorbance changes at 830 nm, increased oxidation of Photosystem I (PSI) under actinic light suggests that electron sink engineering is successfully alleviating over-reduction on the acceptor side of PSI, protecting it from photodamage [64].
- P700+ Reductive Kinetics: A faster rate of P700+ reduction after a light-to-dark transition indicates an increased electron flux to PSI [64].
- Photochemical Quenching (qP): This parameter estimates the redox state of PSII, and improvements, though sometimes modest, can be observed [64].
- Oxygen Evolution: A higher rate of photosynthetic oxygen evolution under increasing light intensities (a raised light saturation point) is a strong indicator of enhanced photosynthetic capacity [63].
Key Experimental Data and Protocols
The following table summarizes quantitative data from pivotal studies in the field.
Table 1: Summary of Key Experimental Findings in NADPH Sink Engineering
| Engineering Strategy / Host Organism | Key Performance Metrics | Reported Outcome | Citation |
|---|---|---|---|
| General NADPH consumption / Synechocystis sp. PCC 6803 | Growth rate, Biomass, PSII/PSI activity, Light saturation point | Doubled growth rate; significantly higher biomass; increased PSII and PSI activities; light saturation point increased. | [65] [63] |
| Engineered D-lactate production / Synechococcus elongatus PCC7942 | D-lactate titer and productivity | Mutant LdhD (D176A/I177R/F178S/N180R) increased productivity by over 3.6-fold compared to wild-type LdhD. Final strain with transporter and CO2 bubbling produced ~800 mg/L. | [67] |
| Cofactor preference reversal for LdhD / In vitro characterization | Kinetic constants (kcat/Km) | Quadruple mutant LdhDnARSdR showed a 28.2-fold decrease in catalytic efficiency for NADH and a 5.2-fold higher efficiency for NADPH over NADH. | [67] |
| Co-expression of Sucrose export & Cytochrome P450 / Synechococcus elongatus PCC7942 | Quantum Yield of PSII (ΦII) | Sucrose export improved ΦII at lower light; Cytochrome P450 improved ΦII under high light; co-expression showed additive enhancements. | [64] |
Detailed Experimental Protocol: Introducing an Extra NADPH Sink
This protocol outlines the key steps for introducing and validating an NADPH-consuming pathway in a model cyanobacterium.
Objective: To enhance photosynthetic efficiency in Synechocystis sp. PCC 6803 by expressing a heterologous, NADPH-specific D-lactate dehydrogenase and measuring its physiological impact.
Materials:
- Strain: Synechocystis sp. PCC 6803 wild-type.
- Growth Medium: BG-11 medium.
- Equipment: Spectrophotometer, Dual-PAM-100 fluorometer, shaker with lighting, centrifuge, anaerobic chamber (for some enzyme assays).
- Reagents: IPTG (for induction), primers for mutagenesis, materials for cloning and transformation, materials for kinetic assays (pyruvate, NADH, NADPH).
Methodology:
Gene Selection and Engineering:
- Select a target gene, such as d-lactate dehydrogenase (ldhD) from Lactobacillus bulgaricus.
- Use site-directed mutagenesis to change cofactor preference. Based on successful studies, target the discriminatory amino acids in the cofactor binding pocket (e.g., D176A, I177R, F178S, N180R) [67].
- Synthesize the mutated gene with codon optimization for Synechocystis to enhance expression.
Strain Construction:
- Clone the engineered ldhD gene into an expression vector under an inducible promoter (e.g., Ptrc with an IPTG-inducible system).
- Transform the constructed plasmid into Synechocystis sp. PCC 6803 via natural transformation or electroporation.
- Select for transformants on BG-11 agar plates with the appropriate antibiotic. Verify genomic integration via colony PCR and DNA sequencing.
Validation of Enzyme Function:
- Grow the engineered and control strains to mid-exponential phase.
- Induce gene expression with an optimized concentration of IPTG (e.g., 1 mM).
- In vitro Enzyme Assay: Prepare cell-free extracts. Measure D-lactate dehydrogenase activity by monitoring the oxidation of NADPH at 340 nm in a reaction mixture containing cell extract, sodium pyruvate, and NADPH [67]. Confirm the switch in cofactor specificity by comparing activity with NADH vs. NADPH.
Analysis of Photosynthetic Performance:
- Grow cultures under standard conditions (e.g., 30°C, 50 μmol photons m⁻² s⁻¹) to the same optical density.
- Using a Dual-PAM-100, perform the following measurements:
- Rapid Light Curves: Measure the effective quantum yield of PSII (Y(II)) across a range of actinic light intensities (e.g., 0 to 1000 μmol photons m⁻² s⁻¹).
- P700 Analysis: Measure the oxidation state of PSI (P700+) under actinic light and the rereduction kinetics of P700+ in a dark interval following illumination [64].
- Compare the results from the engineered strain against the wild-type and empty-vector controls.
Pathway and Workflow Visualization
NADPH Sink Engineering Workflow
Enzyme Engineering Protocol
The Scientist's Toolkit: Research Reagent Solutions
Table 2: Essential Research Reagents and Materials
| Reagent / Material | Function / Application | Example & Notes |
|---|---|---|
| Cyanobacterial Strains | Model organisms for photosynthetic research. | Synechocystis sp. PCC 6803: Highly transformable. Synechococcus elongatus PCC 7942: Fast-growing, minimal background (lacks native LdhD) [67]. |
| Expression Vectors | Delivering and integrating heterologous genes. | RSF1010-based plasmids (shuttle vectors), pUC-based vectors for neutral site integration (e.g., NSI, NSII) [67]. Use with an inducible promoter like Ptrc. |
| Site-Directed Mutagenesis Kits | Engineering cofactor specificity of enzymes. | QuikChange-style kits. Target residues in the Rossmann fold (e.g., for LdhD: D176, I177, F178, N180) [67]. |
| Dual-PAM-100 System | Simultaneously measuring PSII and PSI activity. | Critical for validation. Measures ΦII, qP, P700+ oxidation state, and ETR [64] [63]. |
| Inducers | Controlling heterologous gene expression. | Isopropyl β-d-1-thiogalactopyranoside (IPTG) for inducible systems like Ptrc. Optimize concentration (e.g., 0.1-2 mM) [67]. |
| Enzyme Assay Reagents | Validating enzyme kinetics and cofactor preference. | NADPH and NADH (compare oxidation rates at 340 nm). Pyruvate (substrate for LdhD). Conduct assays in vitro with cell lysates [67]. |
| Product Export Systems | Mitigating product toxicity and enhancing yield. | Lactate permease (LldP) from E. coli can be co-expressed to export lactate from cyanobacterial cells [67]. |
Validation, Comparative Analysis, and Future Therapeutic Landscapes
In Vivo and In Vitro Validation of Engineered Pathways Using 13C-Flux Analysis and Fermentation Metrics
Core Principles of 13C-MFA for Pathway Validation
What is the fundamental principle behind using 13C-MFA for validating engineered pathways?
13C Metabolic Flux Analysis (13C-MFA) is a powerful technique for quantifying intracellular metabolic reaction rates (fluxes) in living organisms. It functions by tracking the rearrangement of 13C-atoms from labeled substrates (tracers) through metabolic pathways. The unique labeling patterns that emerge in downstream metabolites encode detailed information about the activity of upstream pathways, allowing researchers to infer metabolic fluxes with high precision [68] [69]. Unlike indirect measurements such as transcriptomics or proteomics, 13C-MFA directly measures metabolic pathway activity, which is essential for validating whether an engineered pathway is functionally active and achieving its predicted flux [68].
Why is 13C-MFA particularly important for studying NADPH limitation in engineered pathways?
NADPH is a key cofactor for biosynthetic reactions. Its availability often limits the yield of engineered pathways, such as those for antibiotic production or amino acid synthesis. 13C-MFA is uniquely capable of quantifying flux through NADPH-producing pathways like the Pentose Phosphate Pathway (PPP). It can resolve the contribution of different NADPH-generating routes within a central metabolic network, thereby identifying potential cofactor limitations that would not be apparent from gene expression data alone [68] [70]. This allows researchers to diagnose whether an engineered pathway is failing due to insufficient NADPH supply.
Troubleshooting Common 13C-MFA Experimental Challenges
Our tracer experiment yielded low-information enrichment data. How can we design a more informative experiment?
A poorly designed tracer experiment is a common cause of non-informative data. To robustify your experimental design, especially when prior knowledge of fluxes is limited, follow this workflow [70]:
- Define the Metabolic Network: Formulate a comprehensive model of the core metabolism, including the engineered pathway, in a standardized language like FluxML [69] [70].
- Flux Space Sampling: Instead of relying on a single guess for the intracellular fluxes, use software like 13CFLUX2 to sample a wide range of possible flux distributions [70].
- Evaluate Tracer Mixtures: Screen different commercially available tracer mixtures (e.g., [1,2-13C₂]glucose, [U-13C]glucose) against the sampled flux space.
- Multi-Objective Optimization: Select a tracer mixture that represents the best compromise between high information content for the fluxes of interest (e.g., PPP flux for NADPH generation) and experimental cost [71]. For example, a mixture of 100% [1,2-13C₂]glucose and 100% [1-13C]glutamine can be as informative as more expensive alternatives for mammalian cells [71].
The diagram below illustrates this robust experimental design workflow.
How do we accurately quantify fluxes in a eukaryotic system with complex compartmentalization?
Compartmentation is a major challenge in eukaryotic cells as the same metabolite in different organelles (e.g., cytosol vs. mitochondria) can have different labeling patterns, but standard extraction methods yield an average measurement. To address this [72]:
- Integrate A Priori Knowledge: Explicitly include compartmentalized reactions and metabolite transporters in your metabolic network model.
- Leverage Compartment-Specific Data: Utilize enzyme-specific activity assays or organelle-specific metabolite profiling (where feasible) to constrain the model further.
- Use Tracers for Compartment-Specific Elucidation: Select tracers that generate distinct labeling patterns in different compartments. For instance, 13C-glutamine tracing can help elucidate TCA cycle activity in the mitochondria [72].
Our model fitting fails to converge or yields unrealistic flux estimates. What could be wrong?
This is often a problem of model non-identifiability or poor-quality data.
- Check Model Identifiability: Use statistical tools within software like 13CFLUX2 to diagnose if your proposed fluxes can be uniquely identified from the available labeling data. You may need to add extra measurements or use different tracers [70].
- Verify Isotopic Steady-State: For stationary 13C-MFA, ensure the cells are in a metabolic and isotopic steady state. Sampling too early can lead to incorrect fluxes [72].
- Inspect Raw Labeling Data: Ensure the accuracy of the Mass Isotopomer Distributions (MIDs) measured by your LC-MS or GC-MS platform. Noisy or inconsistent MIDs will prevent a valid flux solution [68].
Detailed Experimental Protocols
Protocol for In Vivo 13C-Tracer Study in Rodent Liver
This protocol is adapted from recent studies that quantify tissue-specific metabolism in live animals [68] [73].
- Animal Preparation: Implant arterial and venous catheters in mice for tracer infusion and serial blood sampling, allowing the study of conscious, unrestrained animals to minimize stress-induced artifacts [68].
- Tracer Infusion: Administer a stable isotope cocktail (e.g., [U-13C]glucose or 2H-water) via continuous intravenous infusion. The use of multiple tracers simultaneously can expand the number of quantifiable pathways [68].
- Sampling: At designated time points, collect plasma and rapidly freeze-clamp tissue samples (e.g., liver) in liquid nitrogen to instantly halt metabolism.
- Metabolite Extraction: Homogenize frozen tissue in a cold methanol-water-chloroform mixture to extract polar and lipid metabolites.
- LC-MS Analysis: Analyze metabolite extracts using Liquid Chromatography-Mass Spectrometry (LC-MS). Hydrophilic Interaction Liquid Chromatography (HILIC) is recommended for improved separation of polar metabolites [68].
- Data Processing: Use specialized software to correct raw MS data for natural isotope abundance and extract Mass Isotopomer Distributions (MIDs) for key metabolites [68] [74].
Protocol for Ex Vivo 13C-Tracing in Human Tissue
This method provides a bridge between in vivo physiology and in vitro control, ideal for studying human metabolism [74].
- Tissue Acquisition and Slicing: Obtain fresh tissue from surgery (e.g., human liver resection). Immediately section it into thin slices (150-250 µm) using a vibratome.
- Tissue Culture: Culture the slices on membrane inserts in an air-liquid interface with nutrient-rich medium, ensuring proper oxygenation. Maintain culture for up to 24 hours.
- Viability Assessment: Confirm tissue viability by measuring ATP/ADP ratios, albumin synthesis, and urea production rates [74].
- 13C-Labeling: Replace the medium with an identical one where all carbon sources (e.g., glucose, amino acids) are fully labeled with 13C.
- Harvesting: Collect tissue slices and medium at multiple time points (e.g., 2h, 8h, 24h) after tracer introduction.
- Global 13C Analysis: Use non-targeted LC-MS to measure 13C-incorporation into hundreds of metabolites simultaneously, providing an unbiased view of pathway activities [74].
The following diagram illustrates the core workflow for a 13C-MFA study, from experiment to flux map.
The Scientist's Toolkit: Research Reagent Solutions
Table 1: Essential Reagents and Tools for 13C-Flux Analysis
| Item | Function/Description | Example Use Case |
|---|---|---|
| 13C-Labeled Substrates | Chemically pure compounds (e.g., [1,2-13C₂]glucose, [U-13C]glutamine) used as metabolic tracers. | Creating an informative tracer mixture to resolve fluxes in the PPP and TCA cycle [70] [71]. |
| FluxML | A universal, machine-readable model description language for 13C-MFA. | Unambiguously defining your metabolic network, including reactions, atom mappings, and measurements for model exchange and reproducibility [69]. |
| 13CFLUX2 | High-performance software suite for the simulation and flux estimation of 13C-labeling experiments. | Performing computational flux inference, robust experimental design, and statistical analysis of results [70]. |
| LC-MS with HILIC | Analytical platform comprising Liquid Chromatography (HILIC improves separation) and Mass Spectrometry. | Measuring the abundance and isotope labeling patterns (MIDs) of intracellular metabolites with high sensitivity [68] [74]. |
| Hyperpolarized 13C-NMR | NMR technique with a >10,000-fold sensitivity increase for real-time metabolic probing. | Monitoring rapid metabolic fluxes in vivo, such as in cancer models or cardiac dysfunction, though limited to initial pathway steps [68]. |
Integrating Fermentation Metrics with 13C-MFA
How can we use fermentation kinetics to complement 13C-MFA data?
Fermentation metrics provide a macro-level view of cellular performance that is essential for interpreting 13C-MFA results in a bioprocessing context. Key kinetic models include [75]:
- Monod Kinetics: Describes microbial growth as a function of a single limiting substrate concentration. Essential for correlating nutrient availability with growth and product formation rates.
- Luedeking-Piret Equation: Describes product formation as a function of both microbial growth rate and cell density. Helps distinguish between growth-associated and non-growth-associated product synthesis.
These kinetic models, when combined with intracellular fluxes from 13C-MFA, create a multi-scale understanding. For example, if 13C-MFA reveals high PPP flux (indicating NADPH generation) but the Luedeking-Piret model shows low product yield, the bottleneck may be downstream in the export machinery rather than in cofactor supply.
What modeling approaches are best for scaling up fermentation processes based on 13C-MFA insights?
When moving from lab-scale to industrial bioreactors, integrating different models is crucial [75]:
- Constraint-Based Modeling (CBM): Use genome-scale metabolic models (GSMMs) to predict the outcome of genetic interventions (like pathway engineering) on growth and product yield under different nutrient conditions.
- Hybrid Modeling: Combine GSMMs with Machine Learning (ML) using historical fermentation data to create more accurate predictive models of cell behavior.
- Computational Fluid Dynamics (CFD): Couple your biological model (e.g., a kinetic or CBM model) with a CFD model of the large-scale bioreactor. This simulates how environmental heterogeneity (e.g., gradients in nutrient, O₂, or pH) impacts the metabolic phenotype you measured with 13C-MFA, enabling more reliable scale-up.
This technical support center is designed for researchers and scientists engineering metabolic pathways, with a specific focus on overcoming the critical challenge of NADPH limitation. NADPH is an essential reducing equivalent that drives the biosynthesis of fatty acids, cholesterol, amino acids, and nucleotides, and is crucial for maintaining antioxidant defense systems [76]. The strategies to regulate its supply can be broadly categorized into static and dynamic approaches. Below are answers to frequently asked questions on this topic.
Frequently Asked Questions (FAQ)
Q1: What is the fundamental difference between a static and a dynamic regulation strategy in metabolic engineering?
- A: A static strategy involves a one-time, permanent genetic modification, such as knocking out or constitutively overexpressing a gene. It is a fixed approach designed to work under a specific set of expected conditions. In contrast, a dynamic strategy introduces a feedback or sensing mechanism that allows the system to self-regulate in response to changing metabolic states, such as nutrient levels or metabolite concentrations, thereby maintaining balance and flexibility [57] [59].
Q2: Why is NADPH balance so critical in engineered pathways, particularly for products like acetol?
- A: NADPH is a key cofactor for reductive biosynthesis. In pathways like acetol production from glycerol, the biosynthetic route is directly coupled to the cell's NADPH/NADP+ balance. The pathway can be designed to make product formation mandatory for the cell to maintain this redox balance. An imbalance can lead to reduced product yields, metabolic stress, and accumulation of byproducts [57].
Q3: My productivity drops significantly after the initial growth phase. What could be causing this?
- A: This is a common issue when using static constitutive promoters. The metabolic burden of constant high-level expression of pathway enzymes during the production phase can hinder the cell's ability to maintain energy and cofactor levels. Implementing a dynamic switch, such as a nutrient-responsive promoter (e.g., copper-repressing or nitrogen-responsive), can separate the growth phase from the production phase, allowing for robust growth first and high-yield production second [57] [59].
Q4: I've knocked out the primary NADPH source (e.g., ZWF1 in the PPP), but my strain grows poorly. How can I fix this?
- A: Knocking out a major NADPH source like ZWF1 disrupts the primary redox balance. The solution is to construct an alternative NADPH regeneration pathway to compensate. For example, you can replace a native NAD+-dependent enzyme (like glyceraldehyde-3-phosphate dehydrogenase, GAPDH) with a NADP+-dependent counterpart, thereby creating a new flux route that generates NADPH directly in the glycolysis pathway [59].
Troubleshooting Guides
Troubleshooting Guide 1: Low NADPH Availability
This guide addresses the common problem of insufficient NADPH supply, which can bottleneck your production pathway.
| Symptom | Possible Cause | Recommended Solution | Key Performance Indicators (KPIs) to Monitor |
|---|---|---|---|
| Low product yield, accumulation of precursor metabolites. | High flux through your pathway depletes the NADPH pool. | Static Strategy: Overexpress native NADPH-generating enzymes (e.g., G6PDH, IDH1, ME1) [76] [6]. | - Intracellular NADPH/NADP+ ratio- Final product titer- Biomass yield |
| Native NADPH regeneration is insufficient or competes with your pathway. | Static Strategy: Introduce an alternative NADPH regeneration pathway (e.g., express NADP+-dependent GAPDH) to create a new NADPH source [59]. | - Glycerol uptake rate (if using glycerol)- Product yield from substrate- CO2 emission rate | |
| Unregulated expression of pathway enzymes causes metabolic burden. | Dynamic Strategy: Use a nutrient-limited or metabolite-responsive promoter to dynamically trigger NADPH regeneration only when needed [57] [59]. | - Product formation rate post-induction- Post-production phase cell viability |
Experimental Protocol: Implementing an Alternative NADPH Regeneration Pathway
- Objective: To restore NADPH generation in a ZWF1 knockout strain by engineering glycolysis.
- Strain Background: Saccharomyces cerevisiae or E. coli with a knocked-out ZWF1 gene.
- Methodology:
- Gene Replacement: Replace the endogenous NAD+-dependent glyceraldehyde-3-phosphate dehydrogenase gene (e.g., TDH3 in yeast) with a heterologous NADP+-dependent GAPDH gene (e.g., GDP1, gapB, or GDH) via homologous recombination [59].
- Validation: Confirm the genetic modification via PCR and sequencing.
- Fermentation: Cultivate the engineered strain (e.g., BZP1) and the control strain in a bioreactor with defined medium (e.g., M9 minimal medium for E. coli). Use carbon sources like glucose or glycerol [57] [59].
- Monitoring: Measure cell density (OD600), substrate consumption (e.g., glycerol), and product formation (e.g., ethanol, acetol) over time. Quantify the intracellular NADPH/NADP+ ratio using HPLC-UV analysis of extracts from perchloric acid-treated samples [57].
- Expected Outcome: The engineered strain should show a restored growth phenotype and an improved product yield, as the new pathway generates NADPH without requiring the oxidative PPP, reducing wasteful metabolic cycles [59].
Troubleshooting Guide 2: Poor Dynamic Range of Pathway Expression
This guide helps when your pathway is either always "on" at a low level or never fully induced, lacking the necessary switch-like behavior.
| Symptom | Possible Cause | Recommended Solution | Key Performance Indicators (KPIs) to Monitor |
|---|---|---|---|
| Leaky expression during growth phase, reducing biomass. | The promoter used is not tightly repressed. | Use a promoter with stronger repression (e.g., copper-repressing promoter) [59]. | - Expression level of pathway genes during growth phase- Final biomass concentration |
| Delayed or weak induction at the start of the production phase. | The sensing mechanism is not sensitive enough to the trigger. | Engineer a more sensitive genetic circuit or use a promoter with a sharper response to the specific nutrient depletion (e.g., nitrogen) [57]. | - Time to maximum product formation rate after trigger- Fluorescence reporter signal from the promoter |
| Inconsistent performance across bioreactor runs. | Environmental fluctuations (pH, O2) interfere with the dynamic switch. | Implement a two-stage process where the trigger (e.g., nutrient feed) is controlled more precisely, or switch to an inducer that can be added at a defined concentration. | - Batch-to-batch variance in product titer- Consistency of metabolite profiles at the switch point |
Experimental Protocol: Dynamic Uncoupling of Growth and Production via Nitrogen Limitation
- Objective: To trigger acetol production in an engineered E. coli strain upon depletion of nitrogen, separating growth from production.
- Strain & Plasmid: An E. coli strain (e.g., BW25113 derivative) engineered with deletions to reduce byproducts (e.g., ldhA, pta-ackA) and carrying a plasmid with acetol biosynthesis genes (mgsA, yqhD) under a strong promoter [57].
- Cultivation Conditions:
- Bioreactor Setup: Use a stirred-tank reactor with controlled temperature (30°C), pH (6.8), and dissolved oxygen (>40%) [57].
- Two-Phase Cultivation:
- Growth Phase: Start with a medium containing a sufficient nitrogen source (e.g., (NH4)2SO4). Allow the cells to grow exponentially until nitrogen is depleted.
- Production Phase: Upon nitrogen depletion, biomass formation ceases, and the acetol production pathway is triggered. Continue to provide the carbon source (e.g., glycerol).
- Analysis:
- Metabolic Flux Analysis (^13C-Flux): Use 2-^13C labeled glycerol during both growth and production phases to trace carbon fate and quantify flux redistribution in central carbon metabolism [57].
- Physiology Monitoring: Regularly sample to measure optical density (OD600), glycerol concentration, and acetol titer.
- Expected Outcome: The data will illustrate a metabolically active non-growing state, with significant flux re-routing from central metabolism towards the target product (acetol) to maintain NADPH/NADP+ balance [57].
The Scientist's Toolkit: Research Reagent Solutions
| Reagent / Material | Function in Experiment | Example & Specification |
|---|---|---|
| 2-^13C Glycerol | A stable isotope-labeled carbon source used for ^13C Metabolic Flux Analysis (^13C-MFA) to quantify intracellular metabolic reaction rates [57]. | >99% atom % ^13C; used in defined M9 minimal media. |
| NADP+-Dependent GAPDH Genes | Heterologous genes used to construct alternative NADPH regeneration pathways by redirecting glycolytic flux. | GDP1 (from Clostridium acetobutylicum), gapB (from Bacillus subtilis), or GDH [59]. |
| Nutrient-Responsive Promoters | Genetic parts that provide dynamic control, allowing gene expression to be switched on or off in response to specific environmental cues. | Copper-repressing promoter [59] or nitrogen-responsive promoters. |
| HPLC-UV System | Used for the precise quantification of intracellular cofactors, including NADPH and NADP+, from cell extracts. | System equipped with a LiChrospher RP-18 column (25 cm x 4.6 mm); requires specific gradient buffers for separation [57]. |
Pathway & Workflow Visualizations
Diagram 1: Central NADPH Metabolism & Engineering Nodes
Diagram 2: Dynamic Regulation via Nitrogen Limitation
FAQs: Core Concepts and NADPH Balance
Q1: What are the "TRY" metrics and why are they critical for evaluating my microbial fermentation process?
The TRY metrics—Titer, Rate, and Yield—are the three key quantitative parameters used to evaluate the performance and economic viability of a microbial fermentation process [77].
- Titer is the concentration of your product in the fermentation broth, typically expressed in grams per liter (g/L). A high titer is crucial for reducing the cost and energy of downstream purification.
- Rate, or Productivity, refers to the amount of product formed per unit volume per hour (g/L/h). A high rate maximizes bioreactor output and reduces operational time.
- Yield describes the efficiency of converting the substrate (e.g., glycerol, glucose) into the product, often given in grams of product per gram of substrate (g/g). A high yield minimizes raw material costs.
Optimizing these metrics is essential for a commercially feasible bioprocess, as they directly impact the Cost of Goods Sold (COGS) [77].
Q2: How does NADPH limitation specifically affect these production metrics?
NADPH is a key redox cofactor that supplies the reducing power for many biosynthetic reactions, including the production of fatty acids, terpenoids, and amino acids. Its limitation creates a cascade of negative effects on TRY metrics [58] [78]:
- Reduced Titer and Yield: Insufficient NADPH directly slows down or halts NADPH-dependent reactions in your engineered pathway, leading to an accumulation of precursors and a lower final product concentration and conversion efficiency. The cell may also shunt carbon towards byproducts that do not require NADPH, further reducing your target product's yield [57].
- Reduced Productivity: A metabolic bottleneck caused by NADPH limitation slows the overall flux through the production pathway, decreasing the volumetric production rate. Engineering the NADPH supply is therefore not just about metabolic support; it is a direct strategy to unlock higher TRY metrics [58] [78].
Q3: What are some direct strategies to overcome NADPH limitation in engineered E. coli or yeast?
You can employ several metabolic engineering strategies to enhance NADPH availability:
- Overexpress NADPH-Generating Enzymes: Introduce or amplify the expression of enzymes in the pentose phosphate pathway (PPP), such as glucose-6-phosphate dehydrogenase (G6PDH, encoded by zwf1 in yeast) [58].
- Re-route Central Carbon Metabolism: Replace native enzymes that produce NADH with orthologs that produce NADPH. A classic example is substituting the NADH-dependent aldehyde dehydrogenase (ALD2) with the NADPH-dependent ALD6 in S. cerevisiae [58].
- Use NADP+-Dependent Glyceraldehyde-3-Phosphate Dehydrogenase (GAPDH): Engineering a switch from the native NAD+-dependent GAPDH to a non-phosphorylating, NADP+-dependent GAPDH can directly increase NADPH generation from the lower glycolysis pathway [57].
- Modulate NADPH-Consuming Pathways: Downregulate competing pathways that unnecessarily consume NADPH, thereby making more of it available for your product synthesis.
Troubleshooting Guides
Guide 1: Diagnosing and Resolving Low Yield
A low product yield indicates inefficient conversion of your carbon substrate into the desired product, often due to metabolic bottlenecks or cofactor imbalance.
Problem: The yield (g product / g substrate) is below theoretical expectations.
| Observation | Potential Cause | Solutions |
|---|---|---|
| Low yield with high byproduct accumulation | Carbon flux is being diverted to competing pathways; NADPH limitation may be stalling the main pathway. | - Delete genes for major byproduct pathways (e.g., ldhA, poxB, pta-ackA in E. coli) [57].- Ensure your product pathway is a mandatory sink for redox balance, making its activity essential for the cell [57]. |
| Low yield with no significant byproducts | The product pathway itself may be inefficient or lack sufficient reducing power (NADPH). | - Engineer the NADPH supply (see FAQ #3) [58] [78].- Optimize the expression levels of pathway enzymes using different promoter strengths to balance flux and prevent intermediate accumulation [58]. |
| Yield drops after scale-up | Inhomogeneous conditions in large bioreactors (e.g., oxygen or nutrient gradients) can cause inconsistent metabolism. | - Improve process control parameters like dissolved oxygen (>40%), pH, and agitation [57] [79].- Consider fed-batch strategies to maintain optimal substrate concentration and avoid overflow metabolism. |
Experimental Protocol: Evaluating NADPH Availability
Objective: To quantify the intracellular NADPH/NADP+ ratio in your engineered strain during production phase.
- Cultivation: Grow your engineered microbe in a controlled bioreactor with defined medium. Sample during the mid-exponential growth phase and early stationary/production phase [57].
- Rapid Quenching: Immediately transfer 4 mL of cell broth into 1 mL of ice-cold perchloric acid to quench metabolism and stabilize oxidized cofactors. Mix thoroughly for 15 minutes at 4°C [57].
- Neutralization: Centrifuge the quenched sample and carefully neutralize the acidic supernatant with a mixture of 1 M K₂HPO₄ and 5 M KOH on ice [57].
- Analysis: Remove the precipitate by centrifugation and analyze the clear supernatant using HPLC-UV with a reversed-phase column (e.g., LiChrospher RP-18) and a validated gradient elution method to separate and quantify NADP+ and NADPH [57].
- Interpretation: Compare the NADPH/NADP+ ratio of your production strain against a control strain. A low ratio confirms a redox cofactor imbalance that requires engineering.
Guide 2: Diagnosing and Resolving Low Titer and Productivity
Problem: The final product concentration (titer) and the production rate (productivity) are low.
| Observation | Potential Cause | Solutions |
|---|---|---|
| Good initial production that plateaus early | Product inhibition; nutrient depletion; loss of plasmid (if used). | - Use a robust, high-copy number plasmid or genomic integration [57].- Implement in-situ product removal (ISPR) techniques.- Use nutrient limitation (e.g., nitrogen) to uncouple growth from production and extend the production phase [57]. |
| Low titer and productivity throughout fermentation | Weak or unbalanced expression of pathway enzymes; insufficient precursor supply. | - Use stronger or regulated promoters to control the timing and level of enzyme expression (e.g., PADH2 in yeast induced upon glucose depletion) [58].- Overexpress key precursor-supplying pathways (e.g., the MVA pathway for terpenoids) [58]. |
| High cell density but low product formation | The metabolic burden is too high, or the production pathway is not active. | - Decouple growth and production using inducible systems or nutrient-triggered switches [57].- Ensure the pathway is correctly engineered to be mandatory for cofactor recycling under production conditions [57]. |
Pathway and Workflow Visualizations
Diagram 1: NADPH-dependent Acetol Pathway.
Diagram 2: TRY Troubleshooting Workflow.
The Scientist's Toolkit: Research Reagent Solutions
Table: Key Reagents for Engineering and Analyzing NADPH-Dependent Pathways.
| Reagent / Material | Function in Research | Example Application in Context |
|---|---|---|
| 2-13C Glycerol | Labeled carbon source for tracing metabolic flux via 13C-Metabolic Flux Analysis (13C-MFA). | Elucidating how carbon flux is re-routed towards acetol biosynthesis and away from central metabolism during nitrogen limitation [57]. |
| Perchloric Acid | A strong acid used for rapid quenching of metabolism in cell samples to stabilize labile cofactors. | Quenching samples for accurate quantification of intracellular NADPH and NADP+ pools [57]. |
| HPLC-UV System with RP-18 Column | Analytical platform for separating and quantifying molecules, including nucleotides like NADPH/NADP+. | Measuring the concentration of energy and redox cofactors in neutralized cell extracts [57]. |
| Methylglyoxal Synthase (MGS) | Key pathway enzyme that converts DHAP to methylglyoxal. | Constructing the synthetic pathway for acetol production from glycerol in E. coli [57]. |
| Aldehyde Oxidoreductase (AOR, yqhD) | NADPH-dependent enzyme that reduces methylglyoxal to form acetol. | Completing the final step in the engineered acetol pathway; its activity directly consumes NADPH [57]. |
| Glucose-6-Phosphate Dehydrogenase (G6PDH) | Key enzyme in the pentose phosphate pathway that generates NADPH. | Overexpression in L. lactis and S. cerevisiae to enhance intracellular NADPH supply for folate and PPD production, respectively [58] [78]. |
FAQs: NADPH Oxidases and Inhibition Strategies
Q1: What are NADPH oxidases (NOXs) and why are they important therapeutic targets? NADPH oxidases (NOXs) are a family of electron-transporting membrane enzymes whose primary function is the controlled generation of reactive oxygen species (ROS). Unlike other enzymatic sources of ROS where production may be a side effect, NOXs are dedicated ROS-generating systems [80] [81]. While low levels of ROS serve as crucial signaling molecules in physiological processes, excessive NOX-derived ROS are significant contributors to oxidative damage in pathological conditions such as cardiovascular diseases, neurodegenerative disorders, fibrosis, and cancer [80] [82]. This makes them promising targets for therapeutic intervention.
Q2: What are the key challenges in developing effective NOX-targeted therapies? The development of effective NOX therapies faces two main challenges. First, achieving isoform selectivity is difficult due to structural similarities among the seven NOX isoforms (NOX1-5, DUOX1, DUOX2), each with distinct tissue distribution and physiological roles [81] [83]. Second, researchers must differentiate between direct enzyme inhibition and non-specific ROS scavenging effects, as many compounds initially characterized as inhibitors are actually scavengers, which can confound experimental results [83].
Q3: How can I confirm that my compound is a direct NOX inhibitor and not just a ROS scavenger? Validating a true inhibitor requires a comprehensive platform of biochemical and biophysical assays [83]. Key strategies include:
- Using multiple, orthogonal assay systems to measure ROS production and enzyme activity.
- Testing for compound interference with specific assay components.
- Employing binding studies to demonstrate direct engagement with the enzyme, such as confirming covalent binding to conserved cysteine residues in the NADPH-binding site, as seen with inhibitors like VAS2870 and VAS3947 [83].
Q4: Within the context of engineered pathways, what strategies can overcome NADPH limitations? In metabolic engineering, a common strategy is to reroute redox cofactor metabolism. This can be achieved by:
- Replacing native enzymes with heterologous counterparts that possess different cofactor specificity. For example, replacing a NAD+-dependent glyceraldehyde-3-phosphate dehydrogenase (GAPDH) with a NADP+-dependent GAPDH (e.g., GDP1) can create an alternative NADPH regeneration pathway within glycolysis [59].
- Overexpressing key enzymes in the pentose phosphate pathway (PPP), such as glucose-6-phosphate dehydrogenase (ZWF1) or 6-phosphogluconate dehydrogenase, though the effectiveness is system-dependent [58] [84].
Troubleshooting Guides
Issue 1: Lack of Specificity in NOX Inhibition
Problem: Your inhibitor candidate affects multiple NOX isoforms or unrelated enzymes, making it difficult to attribute physiological effects to a specific target.
| Potential Cause | Recommended Solution | Key Considerations |
|---|---|---|
| Compound engages a ubiquitous cofactor-binding site. | Utilize isoform-specific docking peptides like NOX2ds-tat, which mimics a regulatory sequence and disrupts subunit assembly specifically for NOX2 [81]. | Peptide-based inhibitors may face challenges with cellular delivery and stability. |
| High compound reactivity leading to promiscuous binding. | Employ fragment-based drug design or high-throughput screening to identify novel scaffolds with higher specificity, as demonstrated by the development of NCATS-SM7270 from GSK2795039 [85]. | Always counter-screen against other ROS-producing systems (e.g., xanthine oxidase, mitochondrial ETC) to rule out off-target effects [85]. |
| Inadequate cellular model. | Use genetic knockout or knockdown controls (e.g., siRNA, CRISPR-Cas9) for the target NOX isoform. The inhibitory effect should be diminished or absent in cells lacking the target protein [85]. | Confirm isoform expression profile in your cell model via RT-qPCR or Western blot before experimentation. |
Issue 2: Differentiating Direct Inhibition from ROS Scavenging
Problem: You observe a decrease in measured ROS in your assay, but it is unclear if this is due to direct inhibition of NOX or a non-specific scavenging of the ROS signal.
Solution: Implement the following experimental workflow to confirm direct inhibition:
Step-by-Step Protocol:
- Cell-Free NOX Activity Assay:
- Prepare membrane fractions from NOX-expressing cells (e.g., phagocyte membranes for NOX2).
- In a 96-well plate, mix membrane fraction with an NADPH-regenerating system (e.g., 100-200 µM NADPH, glucose-6-phosphate, and G6PDH).
- Add the inhibitor candidate and incubate for 5-15 minutes.
- Initiate the reaction by adding NADPH and measure superoxide production in real-time using a chemiluminescent probe like L-012 (5-50 µM) or cytochrome c reduction [83] [86]. A direct inhibitor will reduce signal in this acellular system.
Test in Multiple ROS Detection Systems:
- Test your compound against chemically generated ROS. For example, add the compound to a solution of H2O2 or a xanthine/xanthine oxidase superoxide-generating system and measure ROS using your standard detection probe (e.g., Amplex Red for H2O2, DCFH2 for general ROS) [83]. A reduction in signal indicates ROS scavenging activity.
Conduct Binding Studies:
- Use techniques like Cellular Thermal Shift Assays (CETSA) to see if the compound stabilizes the target NOX protein.
- Employ mass spectrometry to identify specific covalent adducts, as demonstrated for DPI (which binds flavin and heme) and VAS2870 (which alkylates a cysteine in the dehydrogenase domain) [83].
Issue 3: Compromised Cell Viability or Health Upon NOX Inhibition
Problem: Treatment with your NOX inhibitor leads to reduced cell proliferation or increased cell death, confounding the interpretation of functional assays.
| Potential Cause | Recommended Solution | Key Considerations |
|---|---|---|
| Disruption of essential ROS-mediated signaling. | Titrate the inhibitor to find the lowest effective dose that suppresses pathological ROS without completely ablating baseline signaling. Monitor markers like cell proliferation and viability (e.g., MTT assay) in parallel. | Remember that some ROS is required for normal cellular function; complete inhibition may be detrimental [81]. |
| Off-target toxicity. | Use genetic approaches (siRNA, shRNA) to knock down the target NOX isoform. If the phenotype (e.g., reduced viability) is not recapitulated, it suggests the small molecule's effect is due to off-target toxicity [80] [82]. | Always include an inactive analog of your inhibitor as a negative control, if available. |
| Induction of reductive stress. | Monitor the NADPH/NADP+ ratio and GSH/GSSG ratio. An overly reduced environment (reductive stress) can disrupt redox homeostasis and be as harmful as oxidative stress [81]. | This is a particular risk when attempting to boost NADPH availability in engineered pathways [81]. |
Research Reagent Solutions
The following table details key reagents essential for research in NOX biology and inhibition studies.
| Reagent / Tool | Function / Description | Key Application Notes |
|---|---|---|
| Diphenylene Iodonium (DPI) | A classic, broad-spectrum flavoprotein inhibitor that reacts with the flavin and heme prosthetic groups of NOXs [81] [83]. | Lacks isoform selectivity and inhibits other flavoenzymes (e.g., eNOS). Useful as a positive control for pan-NOX inhibition but not for isoform-specific studies [83]. |
| GKT137831 (Setanaxib) | A dual NOX1/NOX4 inhibitor that has entered clinical trials for indications like idiopathic pulmonary fibrosis and primary biliary cholangitis [82] [81]. | One of the most advanced NOX inhibitors clinically. Validates NOX1/4 as targets in fibrotic diseases. |
| GSK2795039 | A small-molecule inhibitor reported to be specific for the NOX2 isoform [86]. | Shown to suppress ROS production, platelet activation, and thrombus formation. However, its specificity has been questioned, underscoring the need for careful validation [85]. |
| NCATS-SM7270 | An optimized derivative of GSK2795039 with improved specificity for NOX2. Demonstrated efficacy in protecting mice from traumatic brain injury [85]. | Represents a next-generation effort to develop more specific NOX2 inhibitors with therapeutic potential. |
| VAS2870 / VAS3947 | Small molecules identified as covalent, bona-fide NOX inhibitors that alkylate a conserved cysteine residue in the NADPH-binding site [83]. | These compounds directly engage the enzyme and are valuable tools for studying triazolopyrazine-based inhibition. |
| NOX2ds-tat | A chimeric peptide that combines the NOX2 docking sequence (NOX2ds) with the cell-penetrating HIV tat peptide. Disrupts the assembly of the NOX2 complex [81]. | Provides a mechanism for selective NOX2 inhibition distinct from small-molecule active-site directed inhibitors. |
| L-012 | A highly sensitive chemiluminescent probe used to detect extracellular superoxide anions generated by NOX activity [86]. | More sensitive than older probes like lucigenin. Ideal for real-time measurement of NOX activity in cell-free systems, intact cells, and even in vivo [86]. |
| Amplex Red | A fluorogenic substrate used to detect hydrogen peroxide (H2O2) [86]. | Since NOX4, DUOX1, and DUOX2 primarily release H2O2, this probe is essential for studying these isoforms [82] [81]. |
Experimental Protocols
Protocol 1: Measuring NOX-Dependent Superoxide Production in Platelet Lysates
This protocol is adapted from studies evaluating the NOX2 inhibitor GSK2795039 and is useful for direct measurement of enzymatic activity [86].
Principle: Platelet lysates are provided with NADPH as a substrate. The superoxide produced by the NOX enzymes reduces the probe L-012, generating a chemiluminescent signal measured in real-time.
Materials:
- Washed human platelets or platelet-rich plasma (PRP)
- L-012 sodium salt (e.g., 100 µM working concentration)
- NADPH (e.g., 100 µM)
- Collagen (e.g., 2 µg/mL) or other agonist to stimulate NOX complex assembly
- Lysis buffer (e.g., containing protease and phosphatase inhibitors)
- Chemiluminescence plate reader
Procedure:
- Prepare Platelet Lysate: Isolate platelets from fresh human blood and wash. Resuspend the platelet pellet in ice-cold lysis buffer without detergents that disrupt protein complexes. Lyse cells by repeated freeze-thaw cycles (3x) or gentle sonication. Clarify the lysate by centrifugation at 10,000 x g for 10 minutes at 4°C. Keep on ice.
- Reaction Setup: In a white, opaque-bottom 96-well plate, combine the following:
- Platelet lysate (e.g., 50 µg protein)
- L-012 probe (final concentration 100 µM)
- Inhibitor or vehicle control (pre-incubate for 10-15 minutes)
- Phosphate-buffered saline (PBS) to adjust volume.
- Initiate Reaction: Briefly before reading, add NADPH to a final concentration of 100 µM to initiate the enzymatic reaction.
- Measurement: Immediately place the plate in the chemiluminescence reader and measure the signal continuously for 30-60 minutes. The initial rate of increase in chemiluminescence is proportional to NOX activity.
Protocol 2: Evaluating the Impact of NADPH Regeneration on Product Synthesis in Yeast
This protocol is based on metabolic engineering strategies to increase NADPH availability for biosynthesis, such as in the production of protopanaxadiol (PPD) [58].
Principle: By replacing a native NAD+-dependent enzyme with a NADP+-dependent counterpart, the glycolytic flux can be rerouted to simultaneously generate ATP and NADPH, supporting the production of NADPH-dependent compounds.
Materials:
- Engineered S. cerevisiae strain (e.g., with TDH3 gene replaced by NADP+-dependent GDP1)
- Appropriate selective media (e.g., SC -Ura)
- Glucose or glycerol as carbon source
- Shake flasks or bioreactors
- HPLC system for product (e.g., PPD) and metabolite quantification
Procedure:
- Strain Construction:
- Replace the native gene for glyceraldehyde-3-phosphate dehydrogenase (TDH3), which produces NADH, with a heterologous gene for NADP+-dependent GAPDH (e.g., GDP1 from S. cerevisiae or other sources) via homologous recombination [59].
- Include your pathway of interest (e.g., PPD synthetic pathway) in the same strain.
- Cultivation:
- Inoculate a single colony of the engineered strain into a pre-culture with selective medium.
- Dilute the pre-culture into the main fermentation medium in shake flasks or a controlled bioreactor. Use defined minimal medium to easily track carbon flux.
- Monitoring and Analysis:
- Monitor cell growth (OD600), substrate consumption (glucose/glycerol), and product formation over time.
- Quantify the target product (e.g., PPD) using HPLC. Compare the titer and yield between the control strain (no redox engineering) and the engineered strain with the alternative NADPH regeneration pathway.
- Measure intracellular NADPH/NADP+ ratios using enzymatic assays or HPLC-based methods from cell extracts to confirm the redox shift [57] [58].
NADPH Oxidase Family and Inhibitor Profiles
The following diagram and table summarize the core structure of NOX enzymes and the characteristics of key inhibitor compounds.
Table 1: Profile of Key NADPH Oxidase Inhibitors
| Inhibitor | Primary Target(s) | Reported Specificity | Proposed Mechanism of Action | Key Developmental / Experimental Status |
|---|---|---|---|---|
| DPI | Flavoproteins | None (Pan-NOX) | Irreversibly reacts with flavin and heme prosthetic groups [83]. | Historical tool compound; not suitable for therapeutic use due to toxicity and lack of selectivity [81]. |
| GKT137831 (Setanaxib) | NOX1, NOX4 | Dual NOX1/4 | Competitive with NADPH; precise binding site not fully elucidated [82] [81]. | Most clinically advanced; Phase II trials for IPF and PBC [82] [81]. |
| GSK2795039 | NOX2 | NOX2-specific (claimed) | Reported to compete with NADPH [86]. | Used in preclinical models (e.g., platelet activation, thrombosis); specificity has been debated [85] [86]. |
| NCATS-SM7270 | NOX2 | Improved NOX2 specificity | Optimized from GSK2795039; detailed mechanism under investigation [85]. | Preclinical; shown to be effective in a mouse model of traumatic brain injury [85]. |
| VAS2870 / VAS3947 | Multiple NOXs | Pan-NOX (bona-fide) | Covalently alkylates a conserved cysteine residue in the dehydrogenase domain, likely interfering with NADPH binding [83]. | Important research tools for validating covalent inhibition as a strategy and for studying NOX function. |
| NOX2ds-tat | NOX2 | NOX2-specific | Peptide that disrupts the assembly of the active NOX2-p47phox-p67phox complex [81]. | A biological tool that provides a unique, non-small molecule approach to NOX2 inhibition. |
Assessing the Translational Potential of NADPH-Targeting Strategies in Preclinical Models of Fibrosis and Cancer
Frequently Asked Questions (FAQs) on NADPH Biology and Therapeutic Targeting
Q1: What is the primary biological role of NADPH, and why is it a target in fibrosis and cancer research?
NADPH is a crucial redox coenzyme that provides the reducing power (high-energy electrons) for both antioxidant defense and reductive biosynthesis [1]. In the context of fibrosis and cancer, NADPH is critical because:
- Fibrosis: NADPH oxidases (NOXes), particularly NOX4, are a major source of reactive oxygen species (ROS) in fibrotic tissues. NOX4-generated ROS activate pro-fibrotic signaling pathways, such as those driven by Transforming Growth Factor-beta (TGF-β), leading to fibroblast activation and excessive extracellular matrix (ECM) deposition [87] [88].
- Cancer: Cancer cells undergo metabolic reprogramming to support rapid growth and proliferation. NADPH is essential for synthesizing key macromolecules like fatty acids and for maintaining redox balance, which allows cancer cells to manage the high levels of ROS generated by their accelerated metabolism [89] [87].
Q2: What are the most common challenges when measuring NADPH/NADP+ ratios in preclinical models?
Accurately assessing the intracellular NADPH/NADP+ redox status is technically challenging. Key issues include:
- Dynamic Fluctuations: The ratio is not static and can vary significantly at different culture times or stages of disease progression, making single time-point measurements potentially misleading [1].
- Disruption of Balance: Traditional static measurement methods often require cell lysis, which disrupts the delicate NADPH/NADP+ balance and prevents real-time monitoring [1].
- Lack of Real-Time Data: Without live-cell monitoring, it is difficult to capture the dynamic metabolic adaptations of cells in response to treatments or environmental changes [1].
Q3: A potential NADPH-targeting therapy worked well in a mouse model but failed in a human clinical trial. What are the likely reasons for this translational gap?
The failure to translate preclinical success to the clinic is a major hurdle, often due to:
- Model Limitations: Traditional animal models, including syngeneic mouse models, do not fully recapitulate all aspects of human disease biology and tumor microenvironment heterogeneity [90].
- Human Disease Complexity: Human populations have greater genetic diversity, varying treatment histories, and comorbidities that are not replicated in controlled preclinical settings [90].
- Compensatory Mechanisms: The targeted pathway may be redundant. For example, in intrahepatic cholangiocarcinoma (iCCA), inhibiting NOX4 alone was insufficient because of a compensatory increase in NOX1 activity. Effective treatment required dual NOX4/NOX1 inhibition [91].
Q4: What strategies can be used to dynamically regulate NADPH levels in cells, rather than using static gene knockouts?
Static gene knockouts can cause metabolic imbalance and disrupt cell growth. Advanced dynamic regulation strategies include:
- Genetically Encoded Biosensors: Tools like the SoxR biosensor (for E. coli) or the NERNST biosensor (a ratiometric biosensor using roGFP2) allow for real-time monitoring and dynamic regulation of the intracellular NADPH/NADP+ balance [1].
- Promoter and RBS Engineering: Precisely tuning the expression of NADP(H)-dependent enzymes by engineering promoters and ribosomal binding sites can help direct carbon flux toward NADPH regeneration pathways without completely disrupting native metabolism [1].
Troubleshooting Guides for Common Experimental Issues
Issue: High Variability in NADPH/NADP+ Ratio Measurements
Potential Causes and Solutions:
| Cause | Solution | Consideration |
|---|---|---|
| Inconsistent cell lysis or sample preparation. | Implement a standardized, rapid quenching protocol to instantly freeze metabolic activity. | Ensure all samples are processed with the same timing and reagents [1]. |
| Use of single time-point measurements. | Employ longitudinal sampling to track ratios over time. | This provides a more dynamic and robust picture of metabolic status [90]. |
| Reliance on endpoint assays that disrupt native balance. | Adopt genetically encoded biosensors (e.g., NERNST). | Enables real-time, non-destructive monitoring in live cells, preserving the native redox state [1]. |
Issue: Lack of Antifibrotic/Efficacy In Vivo Despite Strong In Vitro Data
Potential Causes and Solutions:
| Cause | Solution | Consideration |
|---|---|---|
| Inadequate preclinical model. | Use more human-relevant models like Patient-Derived Xenografts (PDX) or organoids. | PDX models better recapitulate human tumor biology and have been key in validating biomarkers like KRAS [90]. |
| Compensatory pathway activation. | Target multiple nodes (e.g., use NOX1/4 dual inhibitors). | In iCCA, dual inhibition was required to impair Cancer-Associated Fibroblast (CAF) actions and reduce tumor growth, whereas single inhibition was ineffective [91]. |
| Insufficient target engagement. | Validate target modulation in the in vivo model using pharmacodynamic biomarkers. | Confirm that the drug is hitting its intended target and modulating the pathway before assessing efficacy [92]. |
Issue: Unacceptable Toxicity or Metabolic Burden in Engineered Cells
Potential Causes and Solutions:
| Cause | Solution | Consideration |
|---|---|---|
| Static overexpression of pathway enzymes causing imbalance. | Use dynamic regulation systems (biosensors, inducible promoters). | Prevents the continuous, uncontrolled expression that can lead to metabolic burden and redox imbalance [1]. |
| Depletion of essential precursors from central carbon metabolism. | Modulate central carbon metabolism or use alternative carbon sources. | In isoprenoid engineering, enhancing the supply of precursors like acetyl-CoA has been a focal point to overcome limitations [25]. |
| Inhibition of competing pathways depleting NADPH. | Fine-tune the expression of competing enzymes instead of knocking them out. | A balanced approach is often more effective than complete pathway elimination [25]. |
Detailed Experimental Protocols for Key Assays
Protocol 1: Assessing NADPH/NADP+ Redox Status Using the NERNST Biosensor
Principle: The NERNST biosensor is a genetically encoded system that combines a redox-sensitive green fluorescent protein (roGFP2) with an NADPH-thioredoxin reductase C module. It allows ratiometric measurement of the NADPH/NADP+ balance in live cells [1].
Methodology:
- Cell Transduction: Stably transduce your cell line (e.g., a fibroblast or cancer cell line) with the NERNST biosensor construct using lentiviral or other appropriate gene delivery methods.
- Imaging Setup: Seed transduced cells into an imaging-compatible plate (e.g., a glass-bottom dish) and allow them to adhere.
- Ratiometric Imaging:
- Use a fluorescence microscope or plate reader capable of exciting roGFP2 at two wavelengths: ~400 nm (oxidized state) and ~480 nm (reduced state).
- Measure the emission intensity at ~510 nm for both excitation wavelengths.
- Data Calculation and Interpretation:
- Calculate the ratio of emission intensities (400 nm excitation / 480 nm excitation).
- A higher ratio indicates a more oxidized state (lower NADPH/NADP+ ratio), while a lower ratio indicates a more reduced state (higher NADPH/NADP+ ratio).
- Perform calibrations at the end of each experiment using 100% oxidation (e.g., with H₂O₂) and 100% reduction (e.g., with dithiothreitol, DTT) to normalize the ratio.
Troubleshooting Tip: Ensure that the expression level of the biosensor is not too high, as this can buffer the native redox pool and lead to inaccurate measurements.
Protocol 2: Evaluating NOX4 Inhibition in a Preclinical Model of Fibrosis
Principle: This protocol assesses the efficacy of a NOX4 inhibitor, alone and in combination with a NOX1 inhibitor, in a mouse model of pulmonary fibrosis, reflecting strategies that overcome compensatory mechanisms [91].
Methodology:
- Disease Model Induction:
- Use a well-established model of pulmonary fibrosis, such as intratracheal instillation of bleomycin in mice [88].
- Treatment Groups:
- Group 1: Vehicle control (e.g., saline).
- Group 2: NOX4 inhibitor only.
- Group 3: NOX1 inhibitor only.
- Group 4: NOX4/NOX1 dual inhibitor (or a combination of single inhibitors).
- Begin treatment after fibrosis is established (e.g., 7-10 days post-bleomycin).
- Sample Collection and Analysis:
- Histopathology: At endpoint, harvest lungs for staining with Masson's Trichrome or Picrosirius Red to quantify collagen deposition.
- Hydroxyproline Assay: Quantify total collagen content in lung tissue biochemically.
- Molecular Analysis: Isolate protein from lung tissue and perform Western blotting for fibrotic markers (e.g., α-SMA, collagen I) and analysis of NOX1 and NOX4 expression levels.
Troubleshooting Tip: Always include a dual inhibition group, as single NOX4 inhibition may not show efficacy due to NOX1 compensation, as demonstrated in iCCA studies [91].
Key Signaling Pathways in NADPH-Targeting Research
The following diagram illustrates the central role of NADPH in fibrosis and cancer, highlighting key therapeutic targets and the compensatory mechanism between NOX1 and NOX4.
The Scientist's Toolkit: Research Reagent Solutions
The table below lists key reagents and tools essential for researching NADPH-targeting strategies.
| Item | Function/Application | Key Consideration |
|---|---|---|
| NERNST Biosensor | Ratiometric, live-cell monitoring of NADPH/NADP+ redox status [1]. | Preferable over destructive, single-time-point assays for dynamic studies. |
| Dual NOX1/4 Inhibitor (e.g., GKT137831) | To target NADPH oxidases in fibrosis/cancer models where compensatory mechanisms exist [91]. | More effective than single NOX4 inhibition in some cancers (e.g., iCCA). |
| Patient-Derived Xenograft (PDX) Models | Preclinical in vivo models that better recapitulate human tumor biology and stroma [90]. | Crucial for improving the translational predictive value of therapeutic efficacy. |
| Human IPF Lung Tissues (Primary Cells) | For ex vivo validation of targets and mechanisms in human disease contexts [88] [93]. | Confirms relevance of findings from animal models to human pathology. |
| siRNA/shRNA against NOX1 & NOX4 | For genetic validation of target roles in vitro and in vivo [91]. | Essential for establishing a causal relationship before inhibitor studies. |
Conclusion
Overcoming NADPH limitation is a solvable challenge through a multifaceted toolkit of metabolic engineering strategies. The integration of foundational knowledge with advanced methodologies—from static pathway modulation to dynamic biosensor-driven regulation and high-throughput CRISPRi screening—enables precise control over this vital cofactor. Computational tools like SubNetX further empower the design of novel, high-yield pathways. The successful application of these strategies in bioproduction, exemplified by enhanced acetol and 4HPAA synthesis, and in emerging therapeutics, such as inducing disulfidptosis, validates their immense potential. Future directions will focus on refining dynamic control systems, expanding the use of computational retrobiosynthesis, and translating these NADPH-centric approaches into clinical therapies for cancer, fibrosis, and other oxidative stress-related diseases, ultimately bridging the gap between microbial engineering and human medicine.
References
- 1. Dynamic and Static Regulation of Nicotinamide ... Adenine [https://pmc.ncbi.nlm.nih.gov/articles/PMC11314019/]
- 2. of Engineering regenerators in Escherichia coli for enhanced... NADPH [https://link.springer.com/article/10.1007/s00253-013-4750-z]
- 3. NADPH-generating systems in bacteria and archaea [https://www.frontiersin.org/journals/microbiology/articles/10.3389/fmicb.2015.00742/full]
- 4. NAD(H) and NADP(H) Redox Couples and Cellular Energy ... [https://pmc.ncbi.nlm.nih.gov/articles/PMC5737637/]
- 5. (PDF) Rational design of a synthetic Entner–Doudoroff pathway for... [https://www.academia.edu/12551482/Rational_design_of_a_synthetic_Entner_Doudoroff_pathway_for_improved_and_controllable_NADPH_regeneration]
- 6. The multi-faceted role of NADPH in regulating inflammation ... [https://pmc.ncbi.nlm.nih.gov/articles/PMC10722250/]
- 7. NADPH homeostasis in cancer: functions, mechanisms ... [https://www.nature.com/articles/s41392-020-00326-0]
- 8. Nicotinamide adenine dinucleotide phosphate [https://en.wikipedia.org/wiki/Nicotinamide_adenine_dinucleotide_phosphate]
- 9. Strategies to Maintain Redox Homeostasis in Yeast Cells ... [https://www.mdpi.com/1422-0067/25/17/9296]
- 10. Research progress and potential therapeutic targets of a novel ... [https://pmc.ncbi.nlm.nih.gov/articles/PMC12616157/]
- 11. Electron transfer engineering of artificially designed cell ... [https://www.nature.com/articles/s41467-025-58926-9]
- 12. Acetol biosynthesis enables NADPH balance during nitrogen ... [https://microbialcellfactories.biomedcentral.com/articles/10.1186/s12934-025-02687-z]
- 13. Elevating cytosolic NADPH metabolism in endothelial cells ... [https://www.nature.com/articles/s41467-025-64652-z]
- 14. Antioxidant Protection of NADPH-Depleted Oligodendrocyte ... [https://pmc.ncbi.nlm.nih.gov/articles/PMC4962338/]
- 15. Review Article NADPH oxidases as drug targets and ... [https://www.sciencedirect.com/science/article/pii/S0891584917307220]
- 16. Acetol biosynthesis enables NADPH balance during ... [https://pubmed.ncbi.nlm.nih.gov/40091049/]
- 17. Disulfidptosis: a new form of programmed cell death [https://jeccr.biomedcentral.com/articles/10.1186/s13046-023-02712-2]
- 18. Disulfidptosis, A Novel Cell Death Pathway - PubMed Central [https://pmc.ncbi.nlm.nih.gov/articles/PMC11964418/]
- 19. Disulfidptosis decoded: a journey through cell death mysteries ... [https://pmc.ncbi.nlm.nih.gov/articles/PMC11059647/]
- 20. Disulfidptosis in tumor progression | Cell Death Discovery [https://www.nature.com/articles/s41420-025-02495-9]
- 21. Molecular signatures of disulfidptosis: interplay with ... [https://cmbl.biomedcentral.com/articles/10.1186/s11658-025-00743-5]
- 22. Targeting the redox-programmed cell death axis in breast ... [https://www.nature.com/articles/s41420-025-02743-y]
- 23. Reactive Oxygen Species: A Double-Edged Sword in the ... [https://pubmed.ncbi.nlm.nih.gov/40801639/]
- 24. dependent isocitrate dehydrogenase as a novel target for ... [https://www.sciencedirect.com/science/article/abs/pii/S0960852424000671]
- 25. Metabolic engineering strategies to overcome precursor ... [https://www.sciencedirect.com/science/article/abs/pii/S0958166920300938]
- 26. Consumption of NADPH for 2-HG Synthesis Increases ... [https://pmc.ncbi.nlm.nih.gov/articles/PMC6053654/]
- 27. Dynamic control over feedback regulatory mechanisms ... [https://www.sciencedirect.com/science/article/abs/pii/S1096717621000136]
- 28. Reduced nicotinamide adenine dinucleotide phosphate in ... [https://pmc.ncbi.nlm.nih.gov/articles/PMC9343382/]
- 29. Measurement of cytochrome P450 and NADPH– ... [https://pmc.ncbi.nlm.nih.gov/articles/PMC3843963/]
- 30. Metabolic flux analysis and the NAD(P)H/NAD(P)+ ratios in ... [https://microbialcellfactories.biomedcentral.com/articles/10.1186/s12934-018-0860-8]
- 31. A promoter–RBS library for fine-tuning gene expression in ... [https://pmc.ncbi.nlm.nih.gov/articles/PMC11409679/]
- 32. NADPH – Knowledge and References [https://taylorandfrancis.com/knowledge/Engineering_and_technology/Chemical_engineering/NADPH/]
- 33. Machine learning for metabolic pathway optimization: A review [https://pmc.ncbi.nlm.nih.gov/articles/PMC10781721/]
- 34. Computational tools and resources for designing new ... [https://www.sciencedirect.com/science/article/pii/S0958166922000568]
- 35. Engineering Genetic Elements for Microbial Protein ... [https://www.sciencedirect.com/science/article/pii/S2405805X2500170X]
- 36. A family of NADPH/NADP+ biosensors reveals in vivo ... [https://www.nature.com/articles/s41467-024-55302-x]
- 37. Mitochondrial NADPH propels oxidative metabolism - PMC [https://pmc.ncbi.nlm.nih.gov/articles/PMC12507123/]
- 38. Monitoring NAD(H) and NADP(H) dynamics during ... [https://pmc.ncbi.nlm.nih.gov/articles/PMC8807777/]
- 39. Challenges and Opportunities in Smart Biosensing for ... [https://pmc.ncbi.nlm.nih.gov/articles/PMC12455640/]
- 40. Engineered Non-Canonical Reductive TCA Pathway ... [https://www.sciencedirect.com/science/article/abs/pii/S1096717625001703]
- 41. Designing pathways for bioproducing complex chemicals ... [https://www.nature.com/articles/s41467-025-59827-7]
- 42. Cyanobacteria as a Platform for Biofuel Production - PMC [https://pmc.ncbi.nlm.nih.gov/articles/PMC4090892/]
- 43. Engineering Escherichia coli to synthesize free fatty acids - PMC [https://pmc.ncbi.nlm.nih.gov/articles/PMC3856887/]
- 44. Systematic metabolic engineering of Escherichia coli for ... [https://www.sciencedirect.com/science/article/abs/pii/S109671761400010X]
- 45. CRISPR Screen Analysis: Expert Troubleshooting Q&A [https://www.ubigene.us/application/crispr-screening-data-analytics-faq.html]
- 46. Troubleshooting Guide for Common CRISPR-Cas9 Editing ... [https://synapse.patsnap.com/article/troubleshooting-guide-for-common-crispr-cas9-editing-problems]
- 47. Genome-scale CRISPRi screening: A powerful tool in ... [https://pmc.ncbi.nlm.nih.gov/articles/PMC11611010/]
- 48. Whole genome CRISPRi screening identifies druggable ... [https://www.nature.com/articles/s41467-024-54072-w]
- 49. Tunable translation-level CRISPR interference by dCas13 ... [https://www.nature.com/articles/s41467-024-49642-x]
- 50. Developing a Redox Imbalance Forces Drive (RIFD) ... [https://www.sciencedirect.com/science/article/abs/pii/S1096717625001181]
- 51. Multiple Cofactor Engineering Strategies to Enhance ... [https://pmc.ncbi.nlm.nih.gov/articles/PMC11123869/]
- 52. Combinatorial pathway engineering using type I-E CRISPR ... [https://pubmed.ncbi.nlm.nih.gov/29537074/]
- 53. Engineering novel CRISPRi repressors for highly efficient ... [https://genomebiology.biomedcentral.com/articles/10.1186/s13059-025-03640-4]
- 54. CRISPR-assisted rational flux-tuning and arrayed CRISPRi ... [https://www.nature.com/articles/s41467-022-28501-7]
- 55. Designing pathways for bioproducing complex chemicals ... [https://pubmed.ncbi.nlm.nih.gov/40413182/]
- 56. Discovering subnetworks in SBML models - PMC [https://pmc.ncbi.nlm.nih.gov/articles/PMC12478697/]
- 57. Acetol biosynthesis enables NADPH balance during nitrogen ... [https://pmc.ncbi.nlm.nih.gov/articles/PMC11910842/]
- 58. Rerouting of NADPH synthetic pathways for increased ... [https://www.nature.com/articles/s41598-018-34210-3]
- 59. Construction of an alternative NADPH regeneration ... [https://www.sciencedirect.com/science/article/pii/S2405805X24000292]
- 60. Evidence that the metabolite repair enzyme NAD(P)HX ... [https://pmc.ncbi.nlm.nih.gov/articles/PMC5938422/]
- 61. Clinical and biochemical distinctions for a metabolite repair ... [https://pmc.ncbi.nlm.nih.gov/articles/PMC9804276/]
- 62. Failure to repair damaged NAD(P)H blocks de novo serine ... [https://cmbl.biomedcentral.com/articles/10.1186/s11658-024-00681-8]
- 63. Introducing extra NADPH consumption ability significantly ... [https://www.sciencedirect.com/science/article/abs/pii/S1096717616300696]
- 64. Improved photosynthetic capacity and photosystem I ... [https://pmc.ncbi.nlm.nih.gov/articles/PMC7980454/]
- 65. Introducing extra NADPH consumption ability significantly ... [https://pubmed.ncbi.nlm.nih.gov/27497972/]
- 66. Cofactor engineering in cyanobacteria to overcome ... [https://link.springer.com/article/10.1007/s11705-016-1591-1]
- 67. Enhancing the light-driven production of d-lactate by ... [https://www.nature.com/articles/srep09777]
- 68. In vivo 2H/13C flux analysis in metabolism research - PMC [https://pmc.ncbi.nlm.nih.gov/articles/PMC8530839/]
- 69. The Design of FluxML: A Universal Modeling Language for ... [https://pmc.ncbi.nlm.nih.gov/articles/PMC6543931/]
- 70. Robustifying Experimental Tracer Design for13C-Metabolic ... [https://www.frontiersin.org/journals/bioengineering-and-biotechnology/articles/10.3389/fbioe.2021.685323/full]
- 71. Multi-objective experimental design for 13 C-based ... [https://www.sciencedirect.com/science/article/abs/pii/S0025556415001480]
- 72. 13 C metabolic flux analysis in complex systems [https://www.sciencedirect.com/science/article/abs/pii/S0958166910001394]
- 73. Metabolomics atlas of oral 13C-glucose tolerance test in mice [https://www.sciencedirect.com/science/article/pii/S2211124721012973]
- 74. Global 13C tracing and metabolic flux analysis of intact ... [https://www.nature.com/articles/s42255-024-01119-3]
- 75. Optimization and Scale-Up of Fermentation Processes Driven ... [https://pmc.ncbi.nlm.nih.gov/articles/PMC9495923/]
- 76. NADPH—The Forgotten Reducing Equivalent - PMC [https://pmc.ncbi.nlm.nih.gov/articles/PMC8168431/]
- 77. TRYing to evaluate production costs in microbial ... [https://pubmed.ncbi.nlm.nih.gov/38806369/]
- 78. Engineering of Biosynthesis Pathway and NADPH Supply for ... [https://pmc.ncbi.nlm.nih.gov/articles/PMC9705839/]
- 79. Deep dive: Fermentation upstream bioprocess design [https://gfi.org/science/the-science-of-fermentation/deep-dive-fermentation-upstream-bioprocess-design/]
- 80. NADPH Oxidases: From Molecular Mechanisms to Current ... [https://pmc.ncbi.nlm.nih.gov/articles/PMC10510401/]
- 81. Evolution of NADPH Oxidase Inhibitors - PubMed Central - NIH [https://pmc.ncbi.nlm.nih.gov/articles/PMC4543484/]
- 82. Inhibiting NADPH Oxidases to Target Vascular and Other ... [https://pmc.ncbi.nlm.nih.gov/articles/PMC9221095/]
- 83. A closer look into NADPH oxidase inhibitors [https://www.sciencedirect.com/science/article/pii/S2213231720301269]
- 84. Increased NADPH concentration obtained by metabolic ... [https://pubmed.ncbi.nlm.nih.gov/15752350/]
- 85. Development of an improved and specific inhibitor ... [https://www.sciencedirect.com/science/article/pii/S2213231723000125]
- 86. NADPH oxidase 2 inhibitor GSK2795039 exerts ... [https://www.nature.com/articles/s41598-025-20250-z]
- 87. Oxidative stress in cancer and fibrosis: Opportunity for ... [https://pmc.ncbi.nlm.nih.gov/articles/PMC5198743/]
- 88. Pulmonary fibrosis: from mechanisms to therapies [https://translational-medicine.biomedcentral.com/articles/10.1186/s12967-025-06514-2]
- 89. Metabolic Adaptations in Cancer Progression - PubMed Central [https://pmc.ncbi.nlm.nih.gov/articles/PMC12293939/]
- 90. Bridging the Gap: Translating Preclinical Biomarkers to ... [https://blog.crownbio.com/bridging-the-gap-translating-preclinical-biomarkers-to-clinical-success]
- 91. NADPH oxidase 1/4 dual inhibition impairs transforming ... [https://www.nature.com/articles/s41392-025-02347-z]
- 92. Translational Biomarkers: from Preclinical to Clinical a Report ... [https://pmc.ncbi.nlm.nih.gov/articles/PMC3085704/]
- 93. Targeting alveolar epithelial cell metabolism in pulmonary ... [https://pmc.ncbi.nlm.nih.gov/articles/PMC12238887/]