Static Pools vs. Dynamic Flux: Comparing NADPH Regulation Strategies in Metabolism and Disease
This article provides a comprehensive comparison of static and dynamic strategies for studying and modulating NADPH regulation, a central hub in cellular redox metabolism.
Static Pools vs. Dynamic Flux: Comparing NADPH Regulation Strategies in Metabolism and Disease
Abstract
This article provides a comprehensive comparison of static and dynamic strategies for studying and modulating NADPH regulation, a central hub in cellular redox metabolism. Aimed at researchers and drug development professionals, we first explore the foundational principles of NADPH homeostasis, from its biochemical roles in antioxidative defense and biosynthesis to its consumption by enzymes like NOX. We then detail the methodological evolution from static, endpoint assays to dynamic, real-time biosensors like iNap and NAPstars, which offer subcellular resolution. The outline further tackles the challenges of interpreting NADPH dynamics and optimizing interventions, and concludes with a validation framework comparing the predictive power and clinical applicability of different strategies. By synthesizing these intents, this review aims to guide the selection of appropriate NADPH investigation and modulation techniques for complex diseases like cancer and vascular aging.
The NADPH Landscape: Defining Static Homeostasis and Dynamic Signaling
Nicotinamide adenine dinucleotide phosphate (NADPH) serves as an essential redox cofactor and the principal reducing equivalent in cellular metabolism. Unlike its catabolic counterpart NADH, NADPH is predominantly utilized in reductive biosynthesis and the maintenance of redox homeostasis [1]. Its functions are fundamental to core physiological processes, and its regulated production is critical in fields ranging from drug development to the study of complex diseases like cancer and neurodegeneration. Cells maintain a high NADPH/NADP+ ratio to drive thermodynamically favorable biosynthetic reactions and to power robust antioxidant defense systems [1]. The core functions of NADPH can be conceptually divided into three critical areas: acting as a cornerstone of the cellular antioxidant system, providing the reducing power for anabolic pathways, and serving as a substrate for controlled free radical generation. Understanding these functions provides a essential foundation for comparing the static and dynamic strategies used by cells—and leveraged by researchers—to regulate NADPH metabolism.
Core Function 1: NADPH in Antioxidant Defense
The role of NADPH in protecting cells from oxidative damage is one of its most critical functions. NADPH is the key electron donor for regenerating the reduced forms of major antioxidant molecules, thus safeguarding cellular components from reactive oxygen species (ROS).
- Reduction of Glutathione (GSH): NADPH is an essential cofactor for glutathione reductase (GR), which converts oxidized glutathione (GSSG) back to its reduced form (GSH). GSH then acts as a cosubstrate for glutathione peroxidase (GPX) to reduce hydrogen peroxide (H₂O₂) and other peroxides to water or alcohol, thereby neutralizing them [2].
- Regeneration of Thioredoxin (TRX): NADPH is used by thioredoxin reductase (TRXR) to maintain thioredoxin (TRX) in its reduced form. Reduced TRX contributes directly to scavenging H₂O₂ and is crucial for reducing ribonucleotide reductase (RNR), an enzyme essential for DNA synthesis [2].
- Catalase Reactivation: In some cell types, NADPH binds to catalase, an important H₂O₂-disposing enzyme, and reactivates it after it has been inactivated by its own substrate, H₂O₂ [2].
The non-negotiable importance of NADPH in antioxidant defense is starkly illustrated by G6PD deficiency, the most common human enzyme deficiency, affecting an estimated 400 million people worldwide [1]. In red blood cells, which lack mitochondria, the oxidative phase of the Pentose Phosphate Pathway (PPP) is the only source of NADPH. A deficiency in G6PD makes these cells highly susceptible to oxidative stress, leading to hemolytic anemia when exposed to certain drugs or foods, such as fava beans (a condition known as favism) [1]. This example underscores how the cellular redox state is exquisitely dependent on a continuous and adequate supply of NADPH.
Core Function 2: NADPH in Reductive Biosynthesis
Beyond its protective role, NADPH is the dominant source of reducing power for anabolic processes, enabling the synthesis of key macromolecules required for cell growth and proliferation.
Table 1: Major Biosynthetic Pathways Dependent on NADPH
| Biosynthetic Pathway | Key NADPH-Dependent Enzyme(s) | Product(s) |
|---|---|---|
| Fatty Acid Synthesis | Fatty Acid Synthase (FASN) [2] | Long-chain fatty acids |
| Cholesterol Synthesis | HMG-CoA Reductase (HMGCR) [2] | Cholesterol, nonsterol isoprenoids |
| Nucleotide Synthesis | Dihydrofolate Reductase (DHFR) [2] | Tetrahydrofolate (for thymidylate, purines) |
| Amino Acid Synthesis | Iron-Sulfur (Fe/S) protein assembly [2] | Non-essential amino acids, lipoic acid |
| Deoxynucleotide Synthesis | Ribonucleotide Reductase (RNR) [2] | Deoxyribonucleotides (DNA building blocks) |
The interconnection between biosynthesis and NADPH generation is a key feature of cellular metabolism. As intermediates like glucose-6-phosphate are used as precursors for biosynthesis, they concomitantly generate NADPH, which in turn thermodynamically drives the biosynthetic reactions [1]. This co-localization of production and consumption is a fundamental metabolic design principle.
Core Function 3: NADPH in Free Radical Generation
Paradoxically, while NADPH is crucial for antioxidant defense, it is also the direct substrate for enzymes that generate free radicals. This controlled production of reactive oxygen species (ROS) serves important signaling and immunological purposes.
- NADPH Oxidases (NOXs): The NOX enzyme family (including NOX1-5 and DUOX1/2) catalyzes the generation of superoxide anions (O₂⁻) or hydrogen peroxide (H₂O₂) by transferring electrons from NADPH to molecular oxygen [2] [3].
- Physiological Roles of NOX-derived ROS: The ROS produced by NOX enzymes are not merely toxic byproducts; they act as signaling molecules that broadly regulate various redox-sensitive signaling pathways. These pathways stimulate oncogenes like Src and Ras, and can inactivate tumor suppressor proteins such as TP53 and PTEN, playing a significant role in cancer progression [2]. Furthermore, in microglia, the immune cells of the central nervous system, NADPH oxidase is a primary source of ROS for innate immune defense [4].
This dual role of NADPH—both combating and creating oxidative stress—highlights the sophisticated balance cells must maintain and underscores why precise regulation of NADPH levels is so critical.
Key Metabolic Pathways for NADPH Generation
The cellular NADPH pool is supplied by multiple metabolic pathways, allowing cells to adapt to different metabolic states and demands. The major generating systems are compartmentalized within the cell to keep the NADPH supply close to its site of utilization.
Table 2: Major NADPH-Generating Pathways and Enzymes
| Pathway | Key Enzymes | Subcellular Location | Contribution Notes |
|---|---|---|---|
| Pentose Phosphate Pathway (PPP) | G6PD, 6PGDH [1] [5] | Cytosol | Largest contributor to cytosolic NADPH [2]. |
| TCA Cycle-Linked Reactions | IDH1 (cytosolic), IDH2 (mitochondrial) [1] | Cytosol, Mitochondrial Matrix | Generate NADPH from isocitrate. |
| Malic Enzyme Reaction | ME1 (cytosolic), ME3 (mitochondrial) [1] | Cytosol, Mitochondrial Matrix | Converts malate to pyruvate, generating NADPH. |
| Folate Metabolism | MTHFD (Methylenetetrahydrofolate Dehydrogenase) [6] | Cytosol, Mitochondrial Matrix | Generates NADPH in one-carbon metabolism. |
| De Novo Synthesis | NAD Kinase (NADK) [2] | Cytosol, Mitochondria | Phosphorylates NAD+ to NADP+, creating the NADPH precursor. |
Diagram: Major Metabolic Pathways for NADPH Generation. The diagram illustrates key routes including the Pentose Phosphate Pathway, TCA cycle-linked reactions, one-carbon metabolism, and de novo synthesis via NAD Kinase. G6PD: Glucose-6-Phosphate Dehydrogenase; 6PGDH: 6-Phosphogluconate Dehydrogenase; IDH1/2: Isocitrate Dehydrogenase 1/2; ME1/3: Malic Enzyme 1/3; MTHFD1: Methylenetetrahydrofolate Dehydrogenase 1.
Experimental Analysis of NADPH Metabolism
Studying NADPH metabolism and regulation requires specific methodologies to quantify NADPH levels and monitor its dynamics in real-time, especially within different subcellular compartments.
Quantifying NADPH Levels with a WST-8 Assay
A standard biochemical method for estimating NADPH levels uses the highly sensitive WST-8 [2-(2-Methoxy-4-nitrophenyl)-3-(4-nitrophenyl)-5-(2,4-disulfophenyl)-2H-tetrazolium, monosodium salt] assay [4]. The protocol is as follows:
- Cell Seeding and Treatment: Seed cells (e.g., human microglia HMC3) in a 96-well plate at a density of 4000 cells/well and allow them to adhere overnight. Treat cells with the experimental compounds (e.g., metabolites like citric acid or malic acid, or small molecules like dieckol) for a set duration (e.g., 6 hours).
- Reagent Incubation: Remove the media and add a working solution containing 200 μM WST-8 and 8 μM 1-mPMS (1-Methoxy-5-methylphenazinium methyl sulfate) prepared in 1x PBS.
- Spectrophotometric Measurement: Incubate the plate at 37°C for a predetermined time (e.g., 3 hours). The NADPH in the cells reduces WST-8 to a yellow-colored formazan product. Measure the absorbance of the formazan product at 460 nm using a plate reader (e.g., BioTek Synergy H1).
- Data Analysis: The absorbance at 460 nm is directly proportional to the concentration of NADPH in the sample. Calculate the NADPH concentration by comparing the sample absorbance to a standard curve [4].
Real-Time Monitoring with Genetically Encoded Biosensors
Traditional methods require cell homogenization and cannot differentiate between compartmental NADPH pools. Genetically encoded biosensors have revolutionized the field by enabling real-time, subcellular monitoring of NADPH dynamics in live cells.
- iNap1 Sensor: iNap1 is a highly responsive, genetically encoded fluorescent indicator specific for NADPH [6]. To determine compartmentalized NADPH levels, researchers overexpress iNap1 in either the cytosol (cyto-iNap1) or mitochondria (mito-iNap3) of primary cells, such as Human Aortic Endothelial Cells (HAECs).
- Protocol and Imaging:
- Transduction: Introduce the cyto-iNap1 or mito-iNap3 construct into the target cells.
- Confocal Imaging: Visualize the cells using confocal microscopy. The fluorescence of the iNap indicators is collected upon excitation at 405 nm (or 420 nm) and 488 nm (or 485 nm).
- Ratiometric Measurement: The ratio of fluorescence (405/488 or 420/485) is used to reflect the NADPH concentration, which can be calibrated in situ by permeabilizing the cells and exposing them to known concentrations of NADPH [6].
- Application: This technique has been used to make critical observations, such as discovering that cytosolic, but not mitochondrial, NADPH levels increase during endothelial cell senescence, a finding that would be impossible with bulk measurement techniques [6].
Table 3: The Scientist's Toolkit: Essential Reagents for NADPH Research
| Reagent / Tool | Function / Application | Example Use Case |
|---|---|---|
| WST-8 / 1-mPMS Assay Kit | Colorimetric quantification of total cellular NADPH levels. | Measuring NADPH changes in G6PD-deficient microglia after treatment with metabolites [4]. |
| Genetically Encoded Biosensor (iNap1) | Real-time, ratiometric monitoring of subcellular NADPH dynamics in live cells. | Revealing elevated cytosolic NADPH during endothelial cell senescence [6]. |
| SoxR Biosensor | Transcription factor-based biosensor that responds to NADPH/NADP+ ratio. | Investigating NADPH-related processes and dynamic regulation in E. coli [5]. |
| NERNST Biosensor | Ratiometric biosensor using roGFP2 and NADPH-thioredoxin reductase for real-time NADP(H) redox status. | Assessing NADPH/NADP+ balance across various organisms [5]. |
| Human Liver Microsomes (HLM) | In vitro system for studying NADPH-dependent enzymatic activity, e.g., CYP450 metabolism and time-dependent inhibition. | Projecting drug-drug interactions caused by CYP3A inactivation [7]. |
| Cryopreserved Human Hepatocytes (HHEP) | More physiologically relevant in vitro model for hepatic metabolism and NADPH-dependent processes. | Evaluating CYP3A time-dependent inhibition in a cellular context [7]. |
Static vs. Dynamic Regulation of NADPH in Research and Therapy
The regulation of NADPH homeostasis is a central challenge in metabolic engineering and therapeutic development. Strategies can be broadly classified into static (hard-wired) and dynamic (feedback-responsive) approaches, each with distinct advantages and limitations.
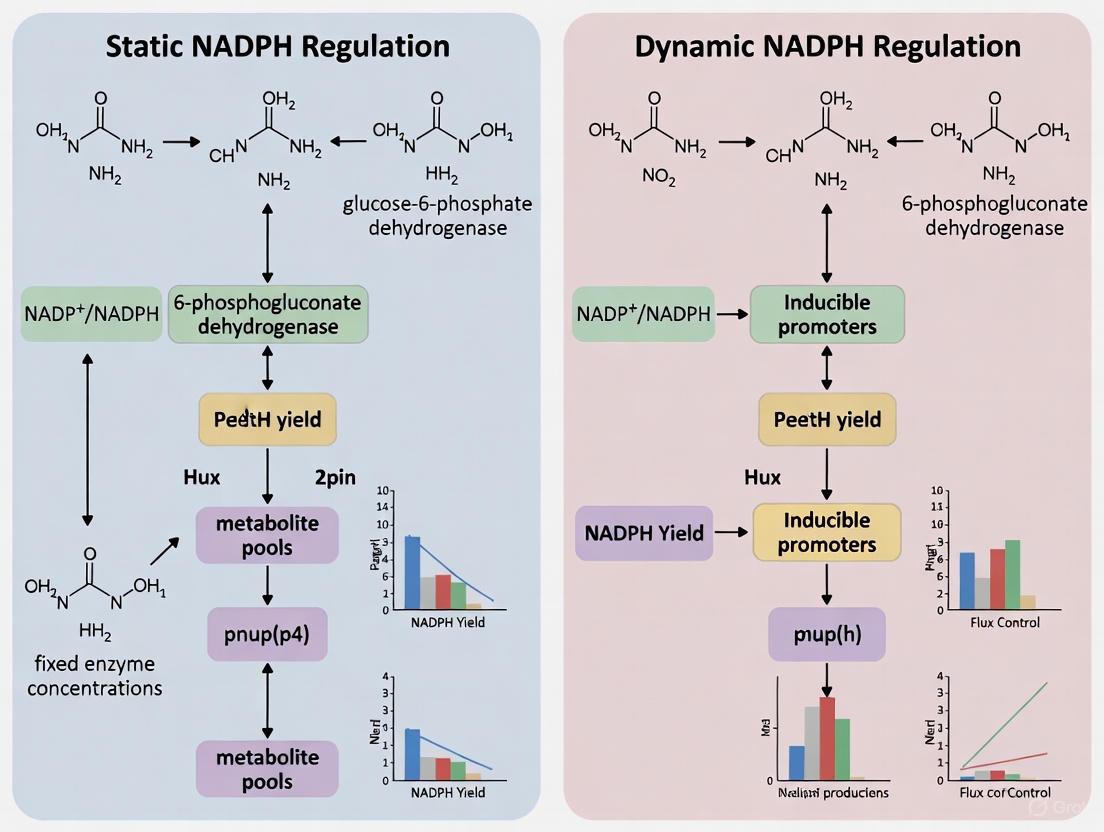
Diagram: Static versus Dynamic NADPH Regulation Strategies. Static methods provide a simple, predictable approach but can lead to metabolic imbalance. Dynamic methods are adaptive and maintain homeostasis but are more complex to implement.
Static Regulation Strategies
Static regulation involves the permanent, hard-wired engineering of metabolic pathways to enhance NADPH supply.
- Overexpression of NADPH-Producing Enzymes: This is the most common strategy. For example, to improve poly-3-hydroxybutyrate (PHB) production, researchers have overexpressed the endogenous genes ppnK (encoding a NAD kinase) and zwf (encoding glucose-6-phosphate dehydrogenase) in E. coli to increase the NADPH pool and drive flux toward the biosynthetic pathway [5].
- Promoter and RBS Engineering: Precise control over the expression of NADP(H)-dependent enzymes can be achieved by engineering promoters and ribosomal binding sites (RBS). An example includes replacing the promoter of the glucose-6-phosphate isomerase gene (pgi) to divert carbon flux from glycolysis toward the NADPH-generating PPP [5].
- Protein Engineering: Modifying the cofactor preference of key enzymes from NADH to NADPH can rewire central metabolism to enhance NADPH supply [5].
A significant limitation of static strategies is their inability to respond to changing cellular conditions. Because they cannot adjust NADPH levels in real-time, they often lead to an imbalance of the NADPH/NADP+ ratio, which can disrupt cell growth and overall production [5].
Dynamic Regulation Strategies
Dynamic regulation aims to sense and adjust intracellular NADPH levels in real-time, maintaining redox balance and optimizing production.
- Genetically Encoded Biosensors: Tools like the SoxR biosensor (specific to E. coli) or the generalizable NERNST biosensor allow real-time monitoring of the intracellular NADP(H) redox status [5]. These biosensors can be linked to genetic circuits to dynamically control the expression of NADPH-consuming or producing pathways based on the current cellular need.
- Leveraging Natural Metabolic Cycles: Some bacteria, like certain Pseudomonas species, naturally adjust NADPH supply through the cyclicity of the Entner-Doudoroff (ED) pathway. The cyclicity is greater in the stationary phase, which aligns with the high NADPH demand for producing compounds like rhamnolipids, providing a natural model for dynamic regulation [5].
Dynamic strategies offer the key advantage of maintaining redox homeostasis, preventing the toxic imbalances associated with static overexpression, and ultimately leading to more robust and efficient microbial cell factories [5].
NADPH is a fundamental cofactor with non-redundant roles in antioxidant defense, reductive biosynthesis, and free radical generation. Its core functions are supported by a network of generating pathways, primarily the PPP, TCA cycle-derived reactions, and one-carbon metabolism. Advanced experimental tools, from WST-8 assays to genetically encoded biosensors, are crucial for dissecting its complex metabolism. The comparison between static and dynamic regulation strategies highlights a critical evolution in metabolic engineering. While static approaches are foundational, the future of optimizing NADPH-dependent processes, whether for bioproduction or therapeutic intervention, lies in sophisticated dynamic systems that can sense and respond to the cellular redox state in real time, thereby achieving balance and maximizing efficiency without compromising cellular health.
Reduced nicotinamide adenine dinucleotide phosphate (NADPH) is a crucial cofactor in metabolic networks, serving as a universal reducing agent that fuels essential cellular processes. This cofactor plays a dual role in both reductive biosynthesis and protection from oxidative stress, making it indispensable for cellular function and survival. The efficient regeneration and maintenance of NADPH homeostasis represents a critical limiting factor for productivity in biotransformation processes and cellular viability under stress conditions. In the context of a broader thesis on comparison static dynamic NADPH regulation strategies research, this review objectively analyzes three fundamental components of NADPH metabolism: the Pentose Phosphate Pathway (PPP) as a primary NADPH source, folate metabolism as a major NADPH consumer in one-carbon transfer reactions, and NAD Kinase (NADK) activity as the master regulator of NADP+ precursor synthesis. Understanding the interplay between these systems and the strategies cells employ to regulate NADPH balance—from static genetic modifications to dynamic sensor-response mechanisms—provides critical insights for metabolic engineering, biotechnology, and therapeutic development.
The Pentose Phosphate Pathway: Architecture and NADPH Production
The Pentose Phosphate Pathway (PPP), also known as the phosphogluconate pathway or hexose monophosphate shunt, is a metabolic pathway parallel to glycolysis that serves as a primary cellular source of NADPH [8] [9]. The pathway operates in two distinct phases: the oxidative phase, which generates NADPH, and the non-oxidative phase, which produces pentose sugars for nucleotide synthesis [8].
Oxidative Phase: NADPH Generation
The oxidative phase begins with glucose-6-phosphate undergoing a dehydrogenation reaction catalyzed by glucose-6-phosphate dehydrogenase (G6PD), producing 6-phosphoglucono-δ-lactone and generating the first molecule of NADPH [8]. This lactone is then hydrolyzed to 6-phosphogluconate by 6-phosphogluconolactonase, followed by an oxidative decarboxylation reaction catalyzed by 6-phosphogluconate dehydrogenase that produces ribulose-5-phosphate, a second NADPH molecule, and CO₂ [8] [9]. The overall reaction for the oxidative phase can be summarized as:
Glucose 6-phosphate + 2 NADP+ + H₂O → ribulose 5-phosphate + 2 NADPH + 2 H+ + CO₂ [8]
This phase is tightly regulated by G6PD, the rate-controlling enzyme that is allosterically stimulated by NADP+ and strongly inhibited by NADPH [8]. The NADPH:NADP+ ratio, normally approximately 100:1 in liver cytosol, serves as the primary mode of regulation [8].
Non-Oxidative Phase: Pentose Sugar Interconversion
The non-oxidative phase involves the synthesis of five-carbon sugars through a series of reversible transformations catalyzed primarily by transketolase and transaldolase [9]. These enzymes facilitate the interconversion of sugar phosphates, allowing the cell to balance the production of ribose-5-phosphate for nucleotide synthesis with the utilization of intermediates for other metabolic pathways [9]. The net reaction of this phase converts three ribulose-5-phosphate molecules into one ribose-5-phosphate and two xylulose-5-phosphate molecules, which are further transformed into two fructose-6-phosphate and one glyceraldehyde-3-phosphate molecule [8] [9]. This flexibility enables the PPP to adapt to cellular demands, directing metabolites toward nucleotide synthesis or back into glycolysis as needed.
Table 1: Key Enzymes of the Pentose Phosphate Pathway and Their Functions
| Enzyme | Reaction Catalyzed | Cofactors/Regulators | Primary Outcome |
|---|---|---|---|
| Glucose-6-phosphate dehydrogenase (G6PD) | Glucose-6-phosphate → 6-phosphoglucono-δ-lactone | NADP+ (stimulator), NADPH (inhibitor) [8] | First NADPH generation |
| 6-phosphogluconolactonase | 6-phosphoglucono-δ-lactone → 6-phosphogluconate | H₂O | Lactone hydrolysis |
| 6-phosphogluconate dehydrogenase | 6-phosphogluconate → ribulose-5-phosphate | NADP+ | Second NADPH generation + CO₂ release |
| Transketolase | Transfer of 2-carbon units between sugar phosphates | Thiamine pyrophosphate | Sugar phosphate interconversion |
| Transaldolase | Transfer of 3-carbon units between sugar phosphates | - | Sugar phosphate interconversion |
Folate Metabolism: NADPH Consumption in One-Carbon Transfers
Folate metabolism, also known as one-carbon metabolism, represents a major NADPH-consuming pathway that plays essential roles in nucleotide synthesis, amino acid metabolism, and methylation reactions [10]. Folates, which include various forms of vitamin B9, serve as essential cofactors in the transfer of one-carbon units required for numerous intracellular processes [10].
Metabolic Integration and NADPH Dependence
The folate cycle intersects with NADPH metabolism at multiple critical points. The enzyme methylenetetrahydrofolate reductase (MTHFR), which catalyzes the conversion of 5,10-methylenetetrahydrofolate to 5-methyltetrahydrofolate, requires NADPH as a reducing equivalent [10]. This reaction represents a committed step in the generation of methyl groups for the methionine cycle and subsequent S-adenosylmethionine (SAM)-dependent methylation reactions. Additionally, the synthesis of thymidylate via thymidylate synthase (TYMS) connects folate metabolism to NADPH availability through the dihydrofolate reductase reaction, which regenerates tetrahydrofolate using NADPH as a cofactor [10]. The interdependency between folate metabolism and NADPH creates a metabolic vulnerability that has been exploited for therapeutic purposes, particularly in oncology.
Therapeutic Targeting and Clinical Implications
The essential role of folate metabolism in nucleotide synthesis has made it a prime target for chemotherapeutic agents such as methotrexate, pemetrexed, and 5-fluorouracil [10]. These drugs function by inhibiting key enzymes in the folate pathway, disrupting DNA synthesis and cellular proliferation particularly in rapidly dividing cancer cells. The clinical efficacy and toxicity profiles of these agents are significantly influenced by nutritional folate status, with research showing that deficient folate status increases toxicity risk for antifolate therapies, while higher folate status exacerbates toxicity for fluoropyrimidine treatments [10]. This complex relationship highlights the importance of understanding NADPH-dependent folate metabolism for optimizing therapeutic interventions.
Table 2: NADPH-Dependent Enzymes in Folate Metabolism and Related Pathways
| Enzyme | Metabolic Pathway | NADPH Role | Biological Significance |
|---|---|---|---|
| Methylenetetrahydrofolate reductase (MTHFR) | Folate cycle | Reductive methyl group formation | Methyl donor production for SAM synthesis |
| Dihydrofolate reductase (DHFR) | Folate regeneration | Folate reduction | Essential for dTMP synthesis and cell proliferation |
| Glutathione reductase | Antioxidant defense | GSH regeneration | Maintains redox homeostasis, protects against oxidative stress |
| Thioredoxin reductase | Antioxidant defense | Thioredoxin reduction | Regulates redox signaling, DNA synthesis |
NAD Kinase (NADK): The Master Regulator of NADPH Biosynthesis
NAD kinase (NADK) occupies a pivotal position in NADPH metabolism as the only enzyme that catalyzes the phosphorylation of NAD+ to NADP+, the essential precursor for NADPH synthesis [11] [12]. This reaction represents the fundamental gateway between NAD+ and NADP+ pools, positioning NADK as a critical control point for cellular redox homeostasis.
Structural Insights and Regulatory Mechanisms
Recent structural studies have revealed important aspects of human NADK organization and function. The enzyme exhibits a tetrameric architecture with distinct regulatory domains that modulate its activity [11]. Specifically, the C-terminal region has been identified as critical for NADK catalytic activity, while the N-terminal region exerts an inhibitory effect on the enzyme's function [11]. This intramolecular regulation enables precise control of NADP+ production in response to cellular demands. Additionally, NADK activity is subject to external regulation by progrowth and mitogenic protein kinases that promote its function to support the heightened anabolic and reductive power demands of proliferating cells, including cancer cells [11].
Functional Significance in Redox Homeostasis and Disease
NADK serves as a metabolic hub that governs ferroptosis susceptibility by orchestrating NADPH homeostasis [12]. Ferroptosis, an iron-dependent form of regulated cell death driven by lipid peroxidation, is critically modulated by NADPH-dependent antioxidant systems, particularly the glutathione-glutathione peroxidase 4 (GPX4) axis [12]. Experimental evidence demonstrates that NADK inhibition through pharmacological approaches (thioNAM) or genetic silencing depletes NADP(H) pools and sensitizes cells to ferroptosis inducers, while NADK overexpression enhances NADPH production and confers ferroptosis resistance [12]. This central positioning makes NADK a potential therapeutic target for conditions where ferroptosis modulation may be beneficial, including cancer, neurodegenerative diseases, and ischemia-reperfusion injury.
Static vs. Dynamic NADPH Regulation Strategies
The regulation of NADPH homeostasis represents a critical challenge in metabolic engineering and cellular function. Two primary strategic approaches have emerged: static regulation through permanent genetic modifications, and dynamic regulation that allows real-time adjustment of NADPH levels in response to changing cellular conditions.
Static Regulation Strategies
Static regulation strategies involve constitutive genetic modifications that permanently alter metabolic flux toward NADPH production. These approaches include:
- Promoter and RBS engineering: Directing carbon flux toward NADPH-producing pathways through controlled expression of key enzymes [5]
- Protein engineering: Modifying the cofactor preference of enzymes to favor NADPH utilization or generation [5]
- Endogenous cofactor engineering: Controlling expression of genes involved in NADPH consumption and regeneration within native pathways [5]
- Heterologous cofactor engineering: Introducing foreign genes to supplement the NADPH regeneration system [5]
- Chemical methods: Utilizing solar energy, electron transfer, or chemical catalysts for NADPH regeneration [5]
While these static approaches have demonstrated utility in enhancing product yields in biotransformation processes, they frequently lead to NADPH/NADP+ imbalance due to their inability to respond to changing intracellular conditions, resulting in suboptimal cell growth and productivity [5].
Dynamic Regulation Strategies
Dynamic regulation strategies employ real-time monitoring and adjustment of NADPH levels to maintain optimal redox balance. These sophisticated approaches include:
- Natural metabolic cycling: Leveraging the inherent cyclicity of pathways like the Entner-Doudoroff (ED) pathway, which naturally adjusts NADPH supply between growth and production phases in certain bacteria [5]
- Genetically encoded biosensors: Utilizing transcription factor-based sensors like SoxR for E. coli or the ratiometric NERNST biosensor, which incorporates a redox-sensitive green fluorescent protein (roGFP2) with NADPH thioredoxin reductase C for real-time monitoring of NADPH/NADP+ redox status across organisms [5]
- Isoenzyme manipulation: Exploiting the different cofactor specificities of isoenzymes such as the three G6PDH isoenzymes in P. putida KT2440 to balance NADPH and NADH production according to metabolic demands [5]
These dynamic systems enable finer control of NADPH homeostasis by responding to real-time fluctuations in cofactor demand, thereby avoiding the metabolic imbalances associated with static approaches.
Table 3: Comparison of Static vs. Dynamic NADPH Regulation Strategies
| Feature | Static Regulation | Dynamic Regulation |
|---|---|---|
| Response capability | Fixed, non-responsive | Real-time adjustment |
| Genetic modification | Permanent constitutive changes | Inducible or sensor-controlled systems |
| NADPH/NADP+ balance | Often disrupted | Maintained within optimal range |
| Implementation complexity | Relatively simple | More complex design required |
| Applications | High-value chemical production, pathway engineering | Stress response, fine-tuned bioproduction, native physiology studies |
| Examples | Overexpression of zwf or gnd genes [5] | SoxR biosensor, NERNST system [5] |
Experimental Approaches and Research Methodologies
Key Experimental Protocols for NADPH Research
Investigation of NADPH-related metabolic pathways employs specialized methodologies to quantify flux, enzyme activity, and metabolic outcomes:
NADK Functional Analysis Protocol:
- Pharmacological inhibition: Use thioNAM (10-100 µM) to chemically inhibit NADK activity [12]
- Genetic manipulation: Employ siRNA-mediated knockdown (e.g., siRNA sequence: 5′-GGA GAA CAT GAT CGT GTA T-3′) or plasmid-driven overexpression of NADK [12]
- Metabolic rescue experiments: Supplement with NAD+ precursors like nicotinamide mononucleotide (NMN) at 0.5-2 mM to test pathway compensation [12]
- Viability assessment: Measure cell survival using CCK-8 assays after 24-48 hours of treatment [12]
- Redox metabolite quantification: Determine NADPH/NADP+ ratios using enzymatic cycling assays or HPLC [12]
PPP Flux Determination:
- Isotopic tracing: Utilize [1-¹³C]-, [2-¹³C]-, or [U-¹³C]glucose to track PPP flux through monitoring ¹³CO₂ release or mass isotopomer distributions in pentose phosphates
- Enzyme activity assays: Measure G6PD and 6PGD activities by monitoring NADPH production kinetics at 340 nm
- Metabolite quantification: Employ LC-MS/MS to determine intracellular concentrations of ribose-5-phosphate, sedoheptulose-7-phosphate, and erythrose-4-phosphate
The Scientist's Toolkit: Essential Research Reagents
Table 4: Key Research Reagents for NADPH Pathway Investigation
| Reagent/Category | Specific Examples | Research Application | Function/Mechanism |
|---|---|---|---|
| NADK Modulators | thioNAM [12] | Pharmacological NADK inhibition | Competitive inhibitor of NADK |
| NADK siRNA [12] | Genetic knockdown of NADK | Targets sequence 5′-GGA GAA CAT GAT CGT GTA T-3′ | |
| NADK overexpression plasmid [12] | NADK functional enhancement | Increases NADK expression and NADP+ production | |
| NAD+ Precursors | Nicotinamide mononucleotide (NMN) [12] | NAD+ pool augmentation | NAD+ salvage pathway intermediate |
| Ferroptosis Modulators | RSL-3 [12] | Ferroptosis induction | GPX4 inhibitor |
| Ferrostatin-1 [12] | Ferroptosis suppression | Lipid peroxidation scavenger | |
| Biosensors | NERNST system [5] | NADPH/NADP+ ratio monitoring | roGFP2 + NADPH thioredoxin reductase C |
| SoxR biosensor [5] | NADPH/NADP+ sensing in E. coli | Transcription factor-based sensor | |
| PPP Inhibitors | Dehydroepiandrosterone (DHEA) | G6PD inhibition | Competitive inhibition of G6PD |
| 6-Aminonicotinamide (6-AN) | 6PGD inhibition | Structural analog of NADP+ |
Integrated Pathway Visualization and Regulatory Networks
The complex interplay between the PPP, folate metabolism, and NADK can be visualized as an integrated network that maintains NADPH homeostasis:
Integrated NADPH Metabolic Network
This integrated view illustrates how NADK-generated NADP+ serves as essential substrate for NADPH-producing enzymes in the PPP, with NADPH subsequently directed toward folate-dependent one-carbon metabolism, reductive biosynthesis, and antioxidant defense systems.
The comparative analysis of static versus dynamic NADPH regulation strategies reveals a clear evolutionary trajectory in metabolic engineering toward more sophisticated, self-regulating systems that mirror natural cellular homeostasis. While static approaches have demonstrated utility in proof-of-concept applications and scenarios where metabolic demands remain relatively constant, dynamic strategies offer significant advantages for complex bioproduction processes and native physiological contexts where NADPH requirements fluctuate. Future research directions will likely focus on refining biosensor sensitivity and response dynamics, developing orthogonal NADPH regeneration systems with minimal crosstalk with native metabolism, and engineering synthetic metabolic cycles that automatically adjust NADPH production in response to precursor availability and product formation. The integration of computational modeling with multi-omics data will further enhance our ability to predict NADPH flux bottlenecks and design targeted intervention strategies. As our understanding of the intricate connections between the PPP, folate metabolism, and NADK continues to deepen, so too will our capacity to manipulate these pathways for therapeutic benefit and biotechnological innovation, ultimately advancing our fundamental comprehension of cellular redox economy.
Nicotinamide adenine dinucleotide phosphate (NADPH) serves as an essential electron donor for reductive biosynthesis and antioxidant defense in cells. A critical design principle of eukaryotic metabolism is the spatial compartmentalization of biochemical processes, and NADPH metabolism is no exception. Separate cytosolic and mitochondrial NADPH pools provide reducing power in their respective locations, a division critical for numerous cellular functions [13] [14]. The inner mitochondrial membrane is impermeable to both NADH and NADPH, meaning neither cofactor can directly cross between the cytosol and mitochondrial matrix [13]. This physical separation necessitates independent regulatory mechanisms for each pool.
Understanding the compartmentalized nature of NADPH metabolism is fundamental for developing therapeutic strategies. This guide objectively compares the performance of static versus dynamic NADPH regulation strategies within the context of these independent pools. Static strategies, such as constitutive gene overexpression or knockout, aim to permanently alter metabolic flux. In contrast, dynamic strategies use genetically encoded biosensors to monitor and respond in real-time to the NADPH/NADP+ redox status, allowing for precise, temporal control [5]. The following sections compare these approaches using supporting experimental data, detailed methodologies, and key research tools.
Comparative Analysis of Cytosolic and Mitochondrial NADPH Metabolism
The table below summarizes the key characteristics, major sources, and functional roles of NADPH in the cytosol and mitochondria, highlighting their distinct natures.
Table 1: Comparison of Cytosolic and Mitochondrial NADPH Pools
| Feature | Cytosolic NADPH Pool | Mitochondrial NADPH Pool |
|---|---|---|
| Major Producing Enzymes/Pathways | Oxidative Pentose Phosphate Pathway (G6PD, PGD), Folate Metabolism (MTHFD) [6] | NADK2 (enzyme producing NADPH from NADH), One-carbon metabolism [13] [15] |
| Primary Functional Roles | Reductive biosynthesis (e.g., fatty acids, cholesterol), antioxidant defense via glutathione and thioredoxin systems [6] [16] | Antioxidant defense, mitochondrial fatty acid synthesis (mtFAS), protein lipoylation, proline synthesis [15] |
| Key Regulatory Enzymes | Glucose-6-phosphate dehydrogenase (G6PD) [6] | NAD+ Kinase 2 (NADK2) [15] |
| Response to Senescence/Aging | Level increases during endothelial cell senescence [6] | Level remains stable during endothelial cell senescence [6] |
| Evidence for Shuttle Systems | No evidence for NADPH shuttle activity with mitochondria; pools are independently regulated [13] | No evidence for NADPH shuttle activity with cytosol; pools are independently regulated [13] |
Experimental Evidence for Independent NADPH Pools
Direct Measurement Using Compartment-Specific Sensors
Experimental Protocol (from [6]):
- Cell Model: Primary cultured Human Aortic Endothelial Cells (HAECs).
- NADPH Indicator: Genetically encoded fluorescent sensor iNap1, targeted to either the cytosol (cyto-iNap1) or mitochondria (mito-iNap3).
- Methodology: Cells were transduced with the sensors. Confocal imaging confirmed precise subcellular localization. Fluorescence was collected upon 420 nm and 485 nm excitation, and the ratio (420/485) was used to reflect the NADPH concentration.
- Calibration: An in situ calibration was performed by permeabilizing the plasma membrane (with 0.001% digitonin) or mitochondrial inner membrane (with 0.3% digitonin) and exposing the cells to increasing concentrations of NADPH.
- Senescence Induction: HAECs were treated with Angiotensin II (2 μM for 72 hours) to induce senescence, a model for vascular aging.
- Key Findings: Upon induction of senescence, the fluorescence ratio of cyto-iNap1 significantly increased, indicating a rise in cytosolic NADPH. Conversely, the fluorescence ratio of mito-iNap3 showed no significant change, demonstrating that the mitochondrial NADPH pool remains stable and is regulated independently [6].
Diagram: Experimental Workflow for Compartment-Specific NADPH Measurement
Metabolic Flux Analysis Using Deuterated Tracers
Experimental Protocol (from [13]):
- Cell Model: HCT116 colorectal carcinoma cells (wild-type and mutants for IDH1/IDH2).
- Tracers: Positionally labeled deuterated glucose: 3-(^{2})H glucose to assess cytosolic NADPH fluxes and 4-(^{2})H glucose to assess mitochondrial NADPH fluxes.
- Methodology: Cells were labeled for 48 hours to reach isotopic steady state in proline biosynthesis metabolites. The incorporation of deuterium into proline pathway intermediates (P5C, proline) was measured using mass spectrometry.
- Rationale: Proline biosynthesis involves NADPH-dependent P5C reduction in the cytosol and NADH-dependent reduction in the mitochondria. The different labeling patterns from the two glucose tracers allow for the distinct quantification of NADPH fluxes in each compartment.
- Perturbation Models: Cells with mutations in cytosolic IDH1 (R132H) or mitochondrial IDH2 (R172K) were used to introduce compartment-specific NADPH challenges.
- Key Findings: A mutation in cytosolic IDH1 altered NADPH fluxes only in the cytosol, without affecting mitochondrial NADPH fluxes. Similarly, a mutation in mitochondrial IDH2 altered fluxes only in the mitochondria. This provides direct evidence against the existence of active NADPH shuttle systems and confirms the independent regulation of these pools [13].
Diagram: Metabolic Tracing for Compartmentalized NADPH Fluxes
Performance Comparison: Static vs. Dynamic NADPH Regulation
The independent nature of NADPH pools necessitates careful consideration when selecting a regulatory strategy. The table below compares the performance of static and dynamic approaches.
Table 2: Performance Comparison of Static vs. Dynamic NADPH Regulation Strategies
| Aspect | Static Regulation Strategies | Dynamic Regulation Strategies |
|---|---|---|
| Core Principle | Permanent genetic modifications to redirect metabolic flux (e.g., overexpression/knockout of pathway enzymes) [5] | Use of genetically encoded biosensors for real-time monitoring and feedback control of NADPH/NADP+ balance [5] |
| Typical Methods | Promoter/RBS engineering, protein engineering, heterologous expression of enzymes [5] | Biosensors like SoxR (for E. coli) or NERNST (roGFP2-based, for general use) [5] |
| Temporal Control | None; constitutive and unresponsive to changing cellular demands | High; allows adjustment of NADPH levels in real-time based on cellular needs [5] |
| Risk of Redox Imbalance | High; can lead to NADPH/NADP+ imbalance, disrupting cell growth and production [5] | Lower; aims to maintain homeostasis by responding to metabolic state |
| Applicability to Specific Pools | Can be targeted (e.g., cytosolic G6PD vs. mitochondrial NADK2) but effect is fixed [6] [15] | Allows for independent monitoring; targeted control is an area of active development |
| Data from Genetic Models | G6PD overexpression elevated cytosolic NADPH and alleviated vascular aging in mice [6]. NADK2 is essential for mitochondrial NADPH and mtFAS [15]. | NERNST biosensor can assess NADPH/NADP+ balance in various organisms, enabling dynamic studies [5]. |
The Scientist's Toolkit: Key Research Reagents and Solutions
This table details essential materials and their functions for studying compartmentalized NADPH metabolism.
Table 3: Key Reagents for NADPH Compartmentalization Research
| Reagent / Tool Name | Function / Application | Key Feature / Consideration |
|---|---|---|
| iNap1 / iNap3 | Genetically encoded sensor for measuring NADPH levels in live cells [6] | Can be targeted to cytosol (iNap1) or mitochondria (iNap3) for compartment-specific measurement [6]. |
| NERNST Biosensor | Ratiometric biosensor for real-time monitoring of NADP(H) redox status [5] | Based on roGFP2 and NADPH-thioredoxin reductase; applicable across organisms [5]. |
| Deuterated Glucose Tracers (3-(^{2})H, 4-(^{2})H) | Metabolic flux analysis to quantify compartmentalized NADPH production [13] | 3-(^{2})H glucose traces cytosolic NADPH fluxes; 4-(^{2})H glucose traces mitochondrial fluxes via proline biosynthesis [13]. |
| Pan-chain Acyl-CoA Profiling (LC-MS) | Mass spectrometry method to simultaneously profile diverse acyl-CoAs from cells and organelles [17] | Reveals compartmentalization of CoA pools and associated metabolism; requires careful sample quenching and processing [17]. |
| SoxR Biosensor | Transcription factor-based biosensor responsive to NADPH/NADP+ in E. coli [5] | Useful for dynamic regulation and screening in bacterial systems [5]. |
The experimental data unequivocally demonstrates that mammalian cells maintain spatially distinct and independently regulated pools of NADPH in the cytosol and mitochondria. This compartmentalization allows the cell to tailor NADPH production and utilization to the specific needs of each organelle—supporting anabolic processes in the cytosol and critical mitochondrial functions like mtFAS and antioxidant defense.
The choice between static and dynamic regulation strategies is pivotal. While static approaches have been instrumental in establishing the functional roles of specific enzymes like G6PD and NADK2, they often lack the finesse required for therapeutic application and can disrupt redox balance. Dynamic regulation represents the future of metabolic control, offering the potential to maintain NADPH homeostasis in a precise, real-time manner. Future research will focus on refining these dynamic systems, developing more sophisticated compartment-specific biosensors and actuators, and applying these tools to correct NADPH dysregulation in age-related diseases, cancer, and metabolic disorders.
In the broader context of comparing static and dynamic NADPH regulation strategies, understanding how to accurately capture the static, steady-state levels of these cofactors is a fundamental prerequisite. The NADPH/NADP+ ratio is a critical indicator of cellular redox state, influencing essential processes from anabolic biosynthesis and antioxidant defense to cellular signaling [5] [18]. Static measurement of total NADPH and NADP+ pools provides a snapshot of this redox potential, forming a baseline against which the benefits of dynamic regulation can be evaluated. This guide objectively compares the core methodologies—from metabolite extraction to final quantification—enabling researchers to select the most appropriate tools for their specific experimental needs.
Core Methodologies for Static NADP(H) Measurement
Static measurement of NADP(H) involves two main steps: metabolite extraction and quantification. The choice of method at each stage significantly impacts the accuracy, reliability, and interpretability of the final redox ratio.
Metabolite Extraction: Preserving the Native Redox State
The primary challenge in extraction is to instantaneously quench cellular metabolism and prevent interconversion between the reduced (NADPH) and oxidized (NADP+) forms during the processing of samples. Inaccurate extraction can lead to significant over- or under-estimation of the true ratio [19].
A systematic comparison of seven different extraction solvents using HCT116 cells revealed that the choice of solvent drastically affects the measured levels of NADPH and NADP+, and by extension, their ratio [19]. The key performance metrics for the top-performing methods are summarized in the table below.
Table 1: Comparison of NADP(H) Extraction Methods from Mammalian Cell Culture
| Extraction Method | Reported NADPH Yield | Reported NADP+ Yield | Key Advantage | Key Disadvantage |
|---|---|---|---|---|
| 40:40:20 ACN:MeOH:Water with 0.1 M Formic Acid | Largest yield [19] | Small yield [19] | Minimizes interconversion; suitable for LC-MS [19] | Requires immediate neutralization to avoid acid degradation [19] |
| 80% Methanol (-70°C) | Moderate yield [19] | Moderate yield [19] | Good balance of yield and practicality | Yields less accurate ratios compared to formic acid-based method [19] |
| Cold Enzyme Assay Buffer + Detergent | Moderate yield [19] | Moderate yield [19] | Reduces interconversion; ideal for subsequent enzyme-based assays [19] | Less effective than organic solvents for mass spectrometry [19] |
| Hot Aqueous Buffer (85°C) | Lower yield [19] | Lower yield [19] | Rapid thermal denaturation of enzymes | Higher risk of interconversion from residual enzyme activity [19] |
The acidic acetonitrile-methanol-water mixture was identified as the most effective for preserving the native redox state, as it best prevents enzymatic interconversion during extraction. This was validated by a spiking experiment where cells grown in 13C6-glucose (fully labeled endogenous metabolites) were extracted with unlabeled NADPH standard added to the solvent. The production of unlabeled NADP+ was minimal with this method, confirming minimal oxidation of NADPH during processing [19].
Quantification Techniques
Following extraction, the concentrations of NADPH and NADP+ are determined using various analytical platforms.
Table 2: Comparison of NADP(H) Quantification Techniques
| Technique | Principle | Sensitivity | Throughput | Ability to Discern NADH |
|---|---|---|---|---|
| Spectrophotometric/ Fluorimetric Enzyme Assays [18] | Couples NADPH consumption/ production to a fluorescent or colored readout via specific enzymes (e.g., glutathione reductase). | High | Moderate | No; measures total NADP(H) pool. |
| Liquid Chromatography-Mass Spectrometry (LC-MS) [19] | Physically separates and detects metabolites based on mass-to-charge ratio. | Very High (LOD ~0.003 μM) [19] | Lower | Yes; can simultaneously and specifically quantify NADPH, NADP+, NADH, and NAD+ [19]. |
| NAD(P)H Autofluorescence Intensity [20] [21] | Measures innate fluorescence of reduced forms (NAD(P)H) upon light excitation. | N/A (Relative) | High | No; cannot spectrally distinguish NADH from NADPH [20] [21]. |
| Fluorescence Lifetime Imaging (FLIM) [20] [21] | Measures the time NAD(P)H spends in the excited state, which changes upon enzyme binding. | N/A (Relative) | Low | Partially; can discriminate free vs. protein-bound NAD(P)H, inferring shifts between catabolic (NADH) and anabolic (NADPH) states [20] [21]. |
Detailed Experimental Protocols
Protocol 1: LC-MS Based Quantification with Optimized Extraction
This protocol, derived from Liu et al. (2018), is considered a gold standard for accurate redox ratio measurement [19].
- Cell Quenching and Extraction: Aspirate culture medium and immediately add 1 mL of ice-cold extraction solvent (40:40:20 acetonitrile:methanol:water with 0.1 M formic acid) to a 10-cm cell culture dish. Keep the dish on dry ice or at -70°C.
- Cell Scraping and Collection: Scrape the cells quickly while the solvent is still semi-frozen. Transfer the extract to a pre-cooled microcentrifuge tube.
- Neutralization: After 3 minutes, add a pre-calculated volume of 10 mM ammonium bicarbonate (NH₄HCO₃) to neutralize the extract and avoid acid-catalyzed degradation of NADPH.
- Centrifugation: Centrifuge at 16,000 × g for 10 minutes at 4°C to remove precipitated protein.
- Analysis: Transfer the supernatant to an LC-MS vial. Analyze using reversed-phase ion-pairing chromatography or HILIC chromatography coupled to a mass spectrometer. The use of two complementary LC methods verifies results [19].
Protocol 2: Spectrophotometric Enzyme Assay for NADPH
This protocol is adapted from a review of spectrophotometric assays for redox biomarkers [18].
- Sample Preparation: Extract cells or tissues using a cold enzyme assay buffer with detergent (0.05% Triton X-100 and 1% DTAB in a carbonate buffer, pH 11) to inactivate enzymes and minimize interconversion.
- Reaction Setup: Prepare a reaction mixture containing:
- Phosphate buffer (pH 7.4)
- Glutathione disulfide (GSSG)
- Sample extract
- Baseline Measurement: Record the absorbance at 340 nm for the reaction mixture.
- Reaction Initiation: Start the reaction by adding a purified Glutathione Reductase (GR) enzyme.
- Kinetic Measurement: Monitor the decrease in absorbance at 340 nm over time, which corresponds to the oxidation of NADPH to NADP+ by GR. The initial rate or total change in absorbance is proportional to the NADPH concentration in the sample.
The Scientist's Toolkit: Essential Research Reagents
Table 3: Key Reagents for Static NADP(H) Measurement
| Reagent / Tool | Function in Experiment |
|---|---|
| Acetonitrile, Methanol, Formic Acid [19] | Components of the optimal extraction solvent for LC-MS; rapidly quenches metabolism and minimizes metabolite interconversion. |
| Glutathione Reductase (GR) [18] [22] | The core enzyme for spectrophotometric assays; specifically oxidizes NADPH to NADP+, allowing its concentration to be coupled to a decrease in absorbance at 340 nm. |
| Detergent Cocktail (Triton X-100/DTAB) [19] | Added to cold aqueous extraction buffers to disrupt membranes and inhibit residual enzyme activity, thereby reducing interconversion during extraction for enzyme assays. |
| `13C6-Glucose [19] | Used for isotopic labeling of endogenous metabolites to experimentally monitor and quantify interconversion artifacts during the extraction process. |
| Ammonium Bicarbonate (NH₄HCO₃) [19] | A neutralizing agent critical for stabilizing NADPH in acidic extracts post-extraction, preventing non-enzymatic acid-catalyzed degradation. |
Visualization of Workflows and Pathways
Static NADPH Measurement Workflow
This diagram illustrates the core decision points and pathways for the two primary quantification methods discussed.
Central NADP(H) Metabolism and Function
This diagram maps the core metabolic pathways involved in NADPH generation and consumption, providing context for the measured ratios.
Nicotinamide adenine dinucleotide phosphate (NADPH) has evolved from being perceived as a static metabolic cofactor to a dynamically fluctuating signaling molecule that regulates critical cellular processes. This guide compares the traditional static regulation strategies with emerging dynamic approaches for monitoring and controlling NADPH redox states. We objectively evaluate the performance, applications, and limitations of various methodological frameworks, supported by experimental data from recent studies. The analysis reveals that dynamic tools provide unprecedented spatial and temporal resolution of NADPH fluxes, enabling researchers to decode the complex signaling language of this essential metabolite in living systems.
The reduced form of nicotinamide adenine dinucleotide phosphate (NADPH) serves as a crucial electron donor in anabolic biosynthesis and antioxidant defense systems. However, emerging evidence positions NADPH beyond its traditional metabolic role, revealing its function as a rapidly fluctuating signaling molecule that fine-tunes inflammatory responses, cellular differentiation, and redox homeostasis [23] [24]. The NADPH/NADP+ redox couple operates as a central metabolic redox pair that is differentially regulated by distinct enzymatic machineries at subcellular levels, creating compartment-specific signaling microdomains [25].
The phosphate group on the 2' position of the ribose ring distinguishing NADP+ from NAD+ constitutes more than a structural variation; it represents a functional specialization that enables independent regulation of these similar cofactors [26] [24]. While NAD+/NADH primarily governs catabolic redox reactions, NADPH is crucial for cellular anabolism and antioxidant responses, creating a fundamental dichotomy in redox metabolism [26]. Understanding NADPH dynamics requires moving beyond static concentration measurements toward real-time monitoring of its fluctuating states, which reflect immediate cellular responses to environmental cues and metabolic demands.
Comparative Analysis of Static vs. Dynamic NADPH Regulation Strategies
Static Regulation Approaches: Foundations and Limitations
Static regulation strategies employ fixed genetic modifications to redirect metabolic flux toward NADPH regeneration pathways. These approaches have formed the traditional foundation for metabolic engineering but face significant limitations in capturing the dynamic nature of NADPH signaling.
Table 1: Static NADPH Regulation Strategies and Their Limitations
| Strategy | Mechanism | Key Applications | Limitations |
|---|---|---|---|
| Promoter Engineering | Redirects carbon flux to pentose phosphate pathway [5] | Microbial production of amino acids, mevalonate, terpenes [5] | Cannot adjust to varying NADPH demands at different culture times [5] |
| Enzyme Overexpression | Enhances endogenous NADPH production via genes like ppnK and zwf [5] | Poly-3-hydroxybutyrate (PHB) production [5] | Causes NADPH/NADP+ imbalance, disrupting cell growth [5] |
| Heterologous Expression | Introduces NADPH-regenerating enzymes from other species [5] | Expression of isocitrate dehydrogenases from Corynebacterium glutamicum [5] | Limited by host enzyme compatibility and expression efficiency [5] |
| Cofactor Engineering | Modifies cofactor preference through protein engineering [5] | Replacement of NADPH-dependent enzymes with NADH-dependent alternatives [5] | Requires extensive enzyme screening and engineering efforts [5] |
Static methods face a fundamental constraint: they cannot provide real-time adjustments to intracellular NADPH levels, leading to persistent NADPH/NADP+ imbalance that disrupts cellular metabolism and productivity [5]. This limitation becomes particularly problematic when NADPH demands vary significantly across different growth phases or environmental conditions.
Dynamic Regulation Strategies: Capturing NADPH Fluctuations
Dynamic regulation frameworks employ real-time monitoring and adjustment of NADPH redox states, enabling researchers to capture the rapid fluctuations that characterize NADPH's signaling function. These approaches leverage natural metabolic cycles and genetically encoded biosensors to maintain NADPH homeostasis.
Table 2: Dynamic NADPH Regulation Strategies and Applications
| Strategy | Mechanism | Key Applications | Performance Advantages |
|---|---|---|---|
| Metabolic Pathway Cyclicity | Leverages natural flux variations in Entner-Doudoroff pathway [5] | Pseudomonas species transitioning between growth and PHA production phases [5] | Automatically adjusts NADPH supply between growth and production phases [5] |
| NAPstar Biosensors | Genetically encoded sensors with Rex domains mutated for NADPH specificity [25] | Real-time monitoring of subcellular NADP redox states in yeast, plants, mammalian cells [25] | Measures NADPH/NADP+ ratio across 5000-fold range (0.001 to 5) [25] |
| NERNST Biosensor | Ratiometric biosensor using roGFP2 and NADPH thioredoxin reductase C [5] | Assessment of NADPH/NADP+ balance across organisms [5] | Enables cross-species NADP(H) redox status comparison [5] |
| SoxR Biosensor | Transcription factor-based biosensor responding to NADPH/NADP+ [5] | Investigating NADPH-related processes in E. coli [5] | Provides dynamic regulation of NADP(H) redox balance in prokaryotes [5] |
The NAPstar biosensor family represents a particularly significant advancement, enabling specific, real-time measurements of NADP redox states across a broad range (NADPH/NADP+ ratios from 0.001 to 5) with subcellular resolution [25]. These tools have revealed unexpected dynamics, including cell cycle-linked NADP redox oscillations in yeast and illumination-dependent changes in plant leaves [25].
Experimental Data and Methodologies
Quantitative Performance Comparison of NADPH Biosensors
Rigorous characterization of NADPH monitoring tools provides critical data for selecting appropriate methodologies based on specific research requirements.
Table 3: Performance Characteristics of NADPH Biosensors
| Biosensor | Dynamic Range | Kd(NADPH) or Kr(NADPH/NADP+) | pH Sensitivity | Subcellular Resolution | Key Applications |
|---|---|---|---|---|---|
| NAPstar1 | NADPH/NADP+ ratio 0.001-5 [25] | Kr = 0.9 μM [25] | Limited sensitivity [25] | Yes [25] | Real-time monitoring in living cells [25] |
| NAPstar3 | NADPH/NADP+ ratio 0.001-5 [25] | Kr = 1.6 μM [25] | Limited sensitivity [25] | Yes [25] | Cell cycle oscillations in yeast [25] |
| NAPstar6 | NADPH/NADP+ ratio 0.001-5 [25] | Kr = 11.6 μM [25] | Limited sensitivity [25] | Yes [25] | Plant hypoxia-reoxygenation responses [25] |
| NERNST | Ratiometric measurements [5] | Not specified | Uses roGFP2, known pH sensitivity [25] | Yes [5] | Cross-species NADP(H) redox comparison [5] |
| Conventional LC-MS | Limited to snapshot measurements [19] | N/A | Not applicable | No [19] | Absolute concentration measurements [19] |
The performance advantages of NAPstar sensors include their substantial dynamic range (5000-fold), limited pH sensitivity, and compatibility with both ratiometric fluorescence and fluorescence lifetime imaging (FLIM) measurements [25]. These characteristics make them particularly suitable for capturing rapid NADPH fluctuations in living cells.
Experimental Protocols for NADPH Dynamics Research
Protocol: NAPstar Biosensor Implementation and Calibration
Objective: To monitor subcellular NADPH/NADP+ ratios in live cells using NAPstar biosensors with temporal resolution sufficient to capture signaling-associated fluctuations.
Materials:
- NAPstar expression plasmids (NAPstar1, 3, or 6 for different affinity ranges) [25]
- Appropriate host cells (yeast, mammalian, or plant) [25]
- Fluorescence microscopy system with capability for ratiometric imaging or FLIM [25]
- Image analysis software (e.g., ImageJ with appropriate plugins)
Methodology:
- Sensor Expression: Transfect target cells with NAPstar plasmids using appropriate methods (electroporation, viral transduction, or chemical transfection).
- Excitation Scanning: Conduct fluorescence excitation scans from 350-450 nm while monitoring emission at 515 nm to confirm proper sensor function.
- Ratiometric Imaging: Capture paired images at 400 nm (TS excitation, NADPH-sensitive) and 560 nm (mCherry excitation, reference) wavelengths.
- Ratio Calculation: Compute TS/mCherry ratio images using the formula: R = F515(400nmex)/F587(560nmex).
- In Vivo Calibration: Perform calibration using hydrogen peroxide (oxidation) and dithiothreitol (reduction) treatments to establish minimum and maximum ratio values.
- Dynamic Monitoring: Acquire time-lapse ratio images to track NADPH fluctuations during experimental interventions.
Validation: Confirm NADPH specificity by testing sensor response to NADH and NAD+ additions, which should produce minimal signal change compared to NADPH/NADP+ perturbations [25].
Protocol: Accurate Extraction and Quantification of NADPH/NADP+ Ratios
Objective: To precisely determine NADPH/NADP+ ratios from cell and tissue samples while minimizing artifactual interconversion during extraction.
Materials:
- Extraction solvent: 40:40:20 acetonitrile:methanol:water with 0.1 M formic acid [19]
- Neutralization buffer: 10 mM ammonium bicarbonate (NH4HCO3) [19]
- Liquid chromatography-mass spectrometry system [19]
- HILIC or reversed-phase ion pairing chromatography columns [19]
Methodology:
- Rapid Quenching: Rapidly transfer cell culture or tissue samples to cold (-70°C) extraction solvent.
- Metabolite Extraction: Vortex vigorously for 30 seconds, then incubate on dry ice for 10 minutes.
- Neutralization: Add NH4HCO3 to neutralize acidic extraction solvent (prevents NADPH degradation).
- Centrifugation: Remove precipitated protein by centrifugation at 16,000 × g for 15 minutes at 4°C.
- LC-MS Analysis: Inject supernatant onto LC-MS system using either:
- HILIC chromatography (for polar metabolite separation)
- Reversed-phase ion pairing chromatography (for broader metabolomics)
- Quantification: Determine concentrations using standard curves from authentic NADPH and NADP+ standards.
Critical Considerations:
- Complete extraction within 3 minutes before neutralization to minimize acid-catalyzed degradation [19]
- Maintain samples at 5°C in autosampler with pH ~7.4 to preserve NADPH stability [19]
- Use 13C-glucose labeling to monitor and correct for interconversion artifacts [19]
Signaling Pathways and Metabolic Networks
The dynamic fluctuation of NADPH occurs within complex metabolic networks where it serves as a critical link between central carbon metabolism and redox signaling. The following diagrams visualize key pathways and experimental workflows for studying NADPH dynamics.
Diagram 1: NADPH Metabolic Signaling Network. This diagram illustrates NADPH's dual role in inflammatory and anti-inflammatory processes, highlighting the competition for consumption that fine-tunes cellular responses [24].
Diagram 2: Experimental Strategy Framework. This workflow compares static and dynamic NADPH regulation methodologies, their applications, and limitations based on recent experimental evidence [5] [25].
The Scientist's Toolkit: Essential Research Reagents
Table 4: Key Research Reagents for NADPH Dynamics Studies
| Reagent/Category | Specific Examples | Function/Application | Key Characteristics |
|---|---|---|---|
| Genetically Encoded Biosensors | NAPstar family (NAPstar1, 3, 6) [25] | Real-time monitoring of NADPH/NADP+ ratios in live cells | Specific for NADP(H), subcellular resolution, Kr values 0.9-11.6 μM [25] |
| Extraction Solvents | 40:40:20 ACN:MeOH:water + 0.1 M formic acid [19] | Metabolite quenching and extraction for LC-MS analysis | Minimizes NADPH/NADP+ interconversion, improves accuracy [19] |
| Chromatography Methods | HILIC, Reversed-phase ion pairing [19] | Separation of NADPH from NADP+ and other metabolites | Enables precise quantification, compatible with MS detection [19] |
| Enzyme Inhibitors/Activators | NOX inhibitors, NOS modulators [24] | Manipulating NADPH consumption pathways | Tests NADPH flux in inflammatory vs. anti-inflammatory processes [24] |
| Isotope Labels | 13C-glucose [19] | Tracing NADPH synthesis pathways and monitoring interconversion | Identifies artifactual oxidation/reduction during extraction [19] |
The evolving understanding of NADPH as a dynamically fluctuating signaling molecule necessitates a paradigm shift in research methodologies. While static regulation strategies provide foundational tools for metabolic engineering, they cannot capture the rapid, compartment-specific fluctuations that characterize NADPH's signaling functions. Dynamic approaches, particularly genetically encoded biosensors like the NAPstar family, enable real-time monitoring of these fluctuations with unprecedented spatial and temporal resolution.
The experimental evidence compiled in this guide demonstrates that the competition for NADPH consumption between opposing inflammatory and anti-inflammatory pathways represents a fundamental regulatory mechanism in immune cells [24]. Future research must continue to develop increasingly sophisticated tools to decode the complex signaling language of NADPH dynamics, potentially revealing novel therapeutic strategies for diseases characterized by redox imbalance, including cancer, metabolic disorders, and chronic inflammatory conditions [26]. The integration of static and dynamic approaches will provide a more comprehensive understanding of how NADPH fluctuations regulate cellular function in health and disease.
From Snapshots to Live Feeds: Tools for Monitoring and Targeting NADPH
In the field of metabolic research, accurately measuring key molecules like NADPH is fundamental to understanding cellular energy, redox balance, and biosynthetic processes. The choice of assay methodology can significantly influence experimental outcomes and interpretations. This guide provides an objective comparison of three traditional static assay techniques—chromatography, mass spectrometry, and enzymatic cycling—focusing on their application in NADPH quantification and related metabolic pathways. By examining the performance characteristics, experimental requirements, and practical limitations of each method, we aim to equip researchers with the data necessary to select the most appropriate technology for their specific research context in drug development and basic science.
Performance Comparison of Static Assay Techniques
The table below summarizes the core performance characteristics of the three major static assay techniques based on current research applications.
Table 1: Performance Comparison of Traditional Static Assay Techniques
| Assay Technique | Sensitivity & Detection Limits | Key Advantages | Major Limitations | Typical Applications in NADPH Research |
|---|---|---|---|---|
| Liquid Chromatography-Mass Spectrometry (LC-MS/MS) | LOQ: 0.002-0.008 pmol/L for thyroid hormones [27]; Successfully quantifies 5-methyl THF from 0.1 ng/mL [28] | High specificity and sensitivity; Can be multiplexed to analyze multiple metabolites simultaneously [29] [28] | High instrument cost; Requires specialized technical expertise; Complex sample preparation [27] | Quantifying acetyl-CoA and short-chain acyl-CoAs [29]; Diagnosing MTHFR deficiency via 5-methyl THF measurement [28] |
| Enzymatic Cycling Assays | Correlates well with UPLC-MS (r = 0.95 for NAD+, 0.97 for NADH); Highly specific for NAD+ and NADH [30] | Lower cost; High specificity for target analytes; Amenable to high-throughput formats [30] | Provides only a static snapshot of levels; Cannot differentiate subcellular compartmentalization [6] [30] | Monitoring total cellular NAD+ and NADH levels; Age-related metabolic decline studies [30] |
| Fluorometric/Colorimetric Kits | Varies by kit; Can produce comparable results to LC-MS in certain matrices [29] | Commercial availability; Protocol simplicity; No need for expensive instrumentation [29] | Susceptible to matrix interference; One commercial colorimetric ELISA for acetyl-CoA failed to produce interpretable results [29] | Initial screening or relative quantification in simple matrices where validated |
Detailed Experimental Protocols
Liquid Chromatography-Mass Spectrometry (LC-MS/MS) for Metabolite Quantification
LC-MS/MS has become a gold standard for precise metabolite quantification due to its high sensitivity and specificity.
- Sample Preparation: Protein precipitation is a common first step. For dried blood spots, samples are added to a methanol:acetonitrile:water solution (5:3:2 v/v/v) and sonicated for 1 hour. Metabolite extracts are then isolated by centrifugation [31]. For tissue samples, enzymatic digestion with collagenase can be superior to mechanical homogenization for efficient analyte extraction [32].
- Chromatography: Separation is often achieved using reversed-phase or specialized columns. For compounds with high structural similarity, such as thyroid hormones, a pentafluorophenyl (F5) column provides superior resolution. The mobile phase frequently consists of 0.1% formic acid in water (Mobile Phase A) and 0.1% formic acid in methanol (Mobile Phase B) [27].
- Mass Spectrometry Detection: The mass spectrometer is typically operated in Selected Reaction Monitoring (SRM) or Multiple Reaction Monitoring (MRM) mode. For NAD+ and NADH, negative ionisation mode can be used. The instrument is tuned to monitor specific parent-to-product ion transitions for each analyte [27] [30].
- Quantification: Analyte concentrations are determined using calibration curves. The use of stable isotope-labeled internal standards is critical for compensating for matrix effects and ensuring accurate quantification [29] [32].
Enzymatic Cycling Assay for NAD+ and NADH
This method amplifies a detectable signal through a cyclic enzymatic reaction, making it highly sensitive for cofactors like NAD+ and NADH [30].
- Dual Extraction for Oxidized and Reduced Species:
- NAD+ Extraction (Acidic): Cell or tissue samples are homogenized in trichloroacetic acid (TCA) to stabilize the oxidized form. The acid extract is then neutralized.
- NADH Extraction (Basic): A separate aliquot of the sample is homogenized in a basic solution (e.g., NaOH) and heated to stabilize the reduced form, followed by acidification.
- Cycling Reaction: The extracted samples are added to a reaction mixture containing alcohol dehydrogenase (ADH), diaphorase, and the necessary substrates (ethanol and resazurin). In this coupled system:
- ADH reduces NAD+ to NADH while oxidizing ethanol to acetaldehyde.
- The generated NADH is then oxidized by diaphorase, reducing resazurin to highly fluorescent resorufin.
- This cycle repeats thousands of times, amplifying the signal.
- Detection and Quantification: The fluorescence of resorufin is measured using a multi-well fluorescence plate reader. The fluorescence intensity is directly proportional to the amount of NAD+ or NADH in the original sample. Quantification is achieved by comparing the signal to a standard curve [30].
Research Reagent Solutions
The table below lists essential reagents and materials commonly used in these assay protocols.
Table 2: Key Research Reagents and Their Functions
| Reagent / Material | Function / Application | Assay Type |
|---|---|---|
| Stable Isotope-Labeled Internal Standards | Corrects for sample loss and matrix effects during analysis, ensuring quantification accuracy. | LC-MS/MS [29] [32] |
| Pentafluorophenyl (F5) HPLC Column | Provides unique selectivity for separating structurally similar isomers (e.g., T3 and rT3 hormones). | LC-MS/MS [27] |
| Alcohol Dehydrogenase (ADH) & Diaphorase | The core enzyme pair for the cyclic reaction that amplifies the signal for NAD+ or NADH detection. | Enzymatic Cycling [30] |
| Resazurin Sodium Salt | A redox dye that is reduced to the highly fluorescent resorufin in the enzymatic cycling assay, serving as the readout. | Enzymatic Cycling [30] |
| Volumetric Absorptive Microsampling (VAMS) Devices | Enables standardized and logistically simple dried blood spot collection from field settings (e.g., elite athletes). | Metabolomics (Sample Collection) [31] |
| Trichloroacetic Acid (TCA) & Sodium Hydroxide (NaOH) | Used in the separate acidic and basic extractions to stabilize the oxidized (NAD+) and reduced (NADH) species, respectively. | Enzymatic Cycling [30] |
Analytical Workflows and NADPH Metabolism
The following diagrams illustrate the general workflows for the two primary assay types and the central role of NADPH in mitochondrial metabolism.
Diagram 1: Static Assay Workflow Comparison
Diagram 2: Mitochondrial NADPH Metabolism
The selection of an appropriate static assay is a critical decision that hinges on the specific research question, required sensitivity, and available resources. LC-MS/MS offers unparalleled specificity, sensitivity, and multiplexing capability, making it ideal for definitive quantification and discovery-based work, despite its higher operational complexity. Enzymatic cycling assays provide a highly sensitive, specific, and cost-effective solution for dedicated analysis of nucleotides like NAD+ and NADH. Traditional fluorometric or colorimetric kits offer convenience but require rigorous validation to ensure accuracy in complex biological matrices. Understanding the capabilities and limitations of each platform, as outlined in this guide, enables researchers to make informed choices that enhance the reliability and impact of their findings in the dynamic field of NADPH regulation.
A Guide to NAD(P)H Biosensors for Metabolic Research
Genetically encoded biosensors have revolutionized our ability to monitor metabolic processes in real-time within living cells. For the central redox metabolites NADPH and NADH, tools like iNap, NAPstars, and SoNar provide unprecedented insight into subcellular metabolic dynamics, enabling research from fundamental biology to drug discovery [25] [33] [34]. This guide objectively compares the performance and applications of these key biosensors to inform their use in static and dynamic NADPH regulation research.
Biosensor Performance at a Glance
The table below summarizes the key characteristics of the three major biosensor families for NADPH and NADH.
| Biosensor Name | Target | Dynamic Range | Apparent Kr or Kd | Key Features & Advantages | Primary Applications & Contexts of Use |
|---|---|---|---|---|---|
| NAPstars [25] | NADPH/NADP+ ratio | ~5000-fold range (NADPH/NADP+ ~0.001 to 5) | Kr(NADPH/NADP+): Varies by variant (e.g., NAPstar1 Kr=0.9) | High specificity for NADP over NAD; pH-resistant; compatible with FLIM. | Revealing NADP redox oscillations (yeast cell cycle); dynamics in plants (light, hypoxia); conserved glutathione system role in antioxidative electron flux [25]. |
| iNap [25] | NADPH | Information Missing | Kd(NADPH): ~4 µM (iNap1); ~32 µM (iNap4) | Ratiometric signal; requires sensor dimerization. | Monitoring NADPH levels in live cells; limited by potential concentration-dependent response [25]. |
| SoNar [34] | NAD+/NADH ratio | 15-fold dynamic range | Kd(NAD+): ~5.0 µM; Kd(NADH): ~0.2 µM; KNAD+/NADH: ~40 | Intensely fluorescent; rapid response; pH-resistant; high selectivity for NAD(H) over NADP(H). | High-throughput screening for metabolic agents (e.g., identified KP372-1); quantifying cytosolic NAD+/NADH ratio in cancer vs. non-cancer cells [34]. |
Experimental Protocols and Methodologies
To ensure reproducible results, follow these detailed protocols derived from foundational biosensor studies.
Protocol for Live-Cell Imaging with NAPstars
- Sensor Expression: Transfect target cells (e.g., yeast, mammalian cells, plant leaves) with a plasmid encoding the NAPstar variant of choice, often with subcellular targeting sequences (e.g., NAPstar3) [25].
- Image Acquisition: Use a confocal or widefield fluorescence microscope. For ratiometric imaging, collect two excitation channels:
- Excitation 1: ~400 nm (TS protein, NADPH-sensitive).
- Excitation 2: ~560 nm (mCherry, internal reference) [25].
- Data Analysis: Calculate the ratio of fluorescence (TS/mCherry) for each pixel or cell. This ratio reflects the NADPH/NADP+ redox state. Calibrate the ratio in vivo using solutions with known NADPH/NADP+ ratios or pharmacological agents to perturb metabolism [25].
Protocol for High-Throughput Screening with SoNar
- Stable Cell Line Generation: Create cancer cell lines (e.g., H1299 human lung cancer) stably expressing cytosolic SoNar [34].
- Compound Treatment: Seed cells into multi-well plates. Treat with compounds from a library (e.g., >5,500 unique compounds) [34].
- Fluorescence Measurement: Use a plate reader capable of dual-excitation ratiometric measurements.
- Excitation 1: 420 nm
- Excitation 2: 485 nm
- Emission: ~515 nm [34]
- Hit Identification: Calculate the 420/485 nm fluorescence ratio. Compounds that induce a significant increase in the ratio (indicating a higher NAD+/NADH ratio) are selected for further cytotoxicity and mechanistic studies [34].
The Scientist's Toolkit: Essential Research Reagents
This table lists key reagents and their functions for experiments utilizing these biosensors.
| Reagent / Material | Function in Experiment | Example & Context |
|---|---|---|
| SoNar-Expressing Cell Line | Enables real-time monitoring of cytosolic NAD+/NADH ratio. | H1299 human lung cancer cells; used for high-throughput metabolic screening [34]. |
| Lactate Dehydrogenase (LDH) Inhibitor | Perturbs NAD+/NADH ratio by blocking NAD+ recycling from NADH. | Oxamate; used to validate SoNar response and study glycolytic dependency [34]. |
| Monocarboxylate Transporter Inhibitor | Blocks pyruvate/lactate uptake, used to validate metabolic shifts. | AR-C155858; used to confirm pyruvate-induced SoNar response is due to intracellular metabolism [34]. |
| NADPH | Reduced cofactor for in vitro biosensor characterization and calibration. | Used in titration experiments to determine Kd(NADPH) and dynamic range of NAPstars and iNap [25]. |
| Glutathione System Inhibitors | Impairs a major antioxidative pathway to study NADPH consumption. | Used with NAPstars to reveal its conserved, primary role in mediating electron flux during oxidative challenge [25]. |
Visualizing Biosensor Applications in Metabolic Pathways
Genetically encoded biosensors integrate into established metabolic pathways to provide dynamic data. The diagram below illustrates key pathways and measurement points for NADPH/NADP+ and NAD+/NADH biosensors.
Strategic Guidance for Biosensor Selection
Choosing the right biosensor is critical for experimental success. The following insights, drawn from performance data and application studies, provide strategic guidance.
For Specific NADPH/NADP+ Ratio Measurements: The NAPstars family is the superior choice. Its high specificity for NADP over NAD, broad dynamic range, and robustness across various eukaryotes (yeast, plants, mammalian cells) makes it ideal for studying antioxidant defense, reductive biosynthesis, and redox signaling without cross-talk from the NAD pool [25]. Its compatibility with FLIM also enables more quantitative imaging in complex tissues.
For High-Throughput Screening and Glycolytic Flux: SoNar is exceptionally well-suited for these applications. Its intense fluorescence, rapid response kinetics, and large dynamic range allow for the detection of subtle metabolic perturbations in real-time, making it a powerful tool for drug discovery campaigns targeting cancer metabolism [34].
A Note on iNap and Sensor Limitations: While iNap sensors are ratiometric and useful for monitoring NADPH, their requirement for dimerization adds expression level as a variable that can influence measurements [25]. Furthermore, earlier sensors based on redox-sensitive GFPs (e.g., roGFP2) can equilibrate with the glutathione pool, raising concerns about their specificity for NADP(H) [25].
Nicotinamide adenine dinucleotide phosphate (NADPH) serves as a central cofactor in redox metabolism, providing reducing power for biosynthetic reactions and antioxidant defense systems. The real-time monitoring of NADPH dynamics in live cells has become a critical capability for understanding cellular metabolism, stress responses, and metabolic diseases. Genetically encoded biosensors have revolutionized this field by enabling researchers to track NADPH fluctuations with high spatiotemporal resolution in living systems, revealing compartment-specific metabolic behaviors that were previously inaccessible with traditional destructive methods. This guide compares the performance of currently available NADPH biosensors, providing experimental data and protocols to help researchers select the optimal tools for their specific applications in drug development and metabolic research.
Biosensor Comparison: Technical Specifications and Performance Metrics
The table below summarizes the key characteristics of major NADPH biosensors used in live-cell imaging, allowing for direct comparison of their technical specifications and performance metrics.
Table 1: Comparison of Genetically Encoded NADPH Biosensors
| Biosensor Name | Sensor Type | Detection Mode | Dynamic Range | Excitation/Emission | Key Applications | Notable Features |
|---|---|---|---|---|---|---|
| NAPstar family [25] | Genetically encoded (Rex-TS-mC) | Ratiometric (NADPH/NADP+ ratio) | Kr(NADPH/NADP+) 0.001 to 5 | Excitation: 400/515 nm (TS); mC reference | Yeast, plants, mammalian cells | Real-time monitoring across 5000-fold NADPH/NADP+ range; subcellular resolution |
| iNAP1 [6] | Genetically encoded (cpYFP-based) | Ratiometric (NADPH concentration) | Not specified | Excitation: 405/488 nm or 420/485 nm | Endothelial cell senescence studies | pH-resistant; used in cytosol and mitochondria |
| NADP-Snifit [35] | Semisynthetic (SPR-SNAP-Halo) | FRET-based (NADPH/NADP+ ratio) | 8.9-fold FRET change; r50 = 30 | FRET pair: TMR/SiR (ex: 560 nm) | Mapping subcellular NADPH/NADP+ ratios | pH-insensitive; tunable response; long-wavelength excitation |
| SoNar [36] | Genetically encoded (cpYFP-based) | Ratiometric (NADH/NAD+ ratio) | Not specified | Excitation: 420/480 nm | NADH/NAD+ ratio monitoring | Bright, ratiometric, large dynamic range |
| Peredox [36] | Genetically encoded (Rex-cpYFP) | Ratiometric (NADH/NAD+ ratio) | Not specified | Excitation: 420/480 nm | NADH/NAD+ ratio monitoring | Limited pH sensitivity; high brightness |
Experimental Protocols for NADPH Biosensor Implementation
Objective: To monitor compartment-specific NADPH/NADP+ ratios in live eukaryotic cells using NAPstar biosensors.
Materials:
- NAPstar plasmid constructs (NAPstar1-3, 6-7)
- Appropriate expression system (yeast, mammalian, or plant cells)
- Confocal fluorescence microscope with capability for ratiometric imaging
- Image analysis software (e.g., ImageJ, MATLAB)
Methodology:
- Sensor Expression: Transfect target cells with NAPstar constructs targeted to specific subcellular compartments (cytosol, mitochondria, nucleus).
- Calibration: Perform in situ calibration using digitonin permeabilization (0.001% for plasma membrane, 0.3% for mitochondrial membrane) with increasing NADPH concentrations.
- Image Acquisition: Collect fluorescence images upon 405 nm (or 420 nm) and 488 nm (or 485 nm) excitation.
- Data Analysis: Calculate the ratio of fluorescence intensities (405/488 or 420/485) to determine NADPH/NADP+ ratios.
- Validation: Treat cells with 100 μM diamide (oxidant) to verify sensor responsiveness.
Key Experimental Findings:
- NAPstars enabled discovery of conserved robustness of cytosolic NADP redox homeostasis across eukaryotes
- Revealed cell cycle-linked NADP redox oscillations in yeast
- Detected illumination- and hypoxia-dependent NADP redox changes in plant leaves
- Identified glutathione system as primary mediator of antioxidative electron flux
Objective: To monitor cytosolic and mitochondrial NADPH dynamics during endothelial cell senescence.
Materials:
- iNAP1 and iNAPC (non-responsive control) constructs
- Primary Human Aortic Endothelial Cells (HAECs)
- Angiotensin II (Ang II) for senescence induction
- Confocal microscope with ratiometric capability
Methodology:
- Subcellular Targeting: Express cyto-iNAP1 and mito-iNAP3 in HAECs using appropriate targeting sequences.
- Senescence Induction: Treat HAECs with 2 μM Ang II for 72 hours to induce senescence.
- Image Acquisition: Collect fluorescence at 420/485 nm excitation ratios.
- Data Normalization: Normalize iNAP1 signals against iNAPC to account for expression variations.
- Statistical Analysis: Compare NADPH levels between young and senescent cells.
Key Experimental Findings:
- Cytosolic NADPH increases significantly during EC senescence (Ang II-induced)
- Mitochondrial NADPH remains stable during senescence
- G6PD upregulation further elevates cytosolic NADPH during senescence
- NADPH elevation inhibits HDAC3 activity, potentially mitigating aging effects
Signaling Pathways and Metabolic Context of NADPH Regulation
The diagram below illustrates the central metabolic pathways involving NADPH generation and utilization, highlighting key regulatory nodes and compartmentalization.
NADPH Metabolic Pathways and Regulation
The Scientist's Toolkit: Essential Research Reagents and Materials
Table 2: Key Research Reagent Solutions for NADPH Biosensor Studies
| Reagent/Material | Function/Application | Example Use Cases |
|---|---|---|
| NAPstar Constructs [25] | Real-time monitoring of NADPH/NADP+ ratios | Studying redox metabolism across yeast, plants, mammalian cells |
| iNAP1 Sensor [6] | Compartment-specific NADPH monitoring | Investigating endothelial cell senescence and vascular aging |
| NADP-Snifit [35] | FRET-based NADPH/NADP+ ratio sensing | Mapping subcellular NADPH dynamics with long-wavelength excitation |
| SoNar Sensor [36] | NADH/NAD+ ratio monitoring | Comparative studies of NAD and NADP redox states |
| Digitonin [6] | Selective membrane permeabilization | In situ calibration of compartment-targeted biosensors |
| Diamide [6] | Oxidant for sensor validation | Testing biosensor responsiveness and dynamic range |
| Angiotensin II [6] | Inducer of cellular senescence | Modeling age-related NADPH changes in endothelial cells |
| Folic Acid [6] | NADPH metabolism modulator | High-throughput screening for NADPH-elevating compounds |
Critical Performance Considerations in Biosensor Selection
When selecting NADPH biosensors for specific research applications, several critical performance factors must be considered:
Specificity and Cross-Reactivity: The NAPstar family shows substantially higher affinity for NADPH over NADH (one to two orders of magnitude), though some cross-reactivity exists [25]. This specificity is crucial for accurate NADPH monitoring in environments with fluctuating NADH levels.
pH Sensitivity: Early cpYFP-based sensors suffered from pH sensitivity, complicating data interpretation in acidic microenvironments. Newer sensors like NADP-Snifit are explicitly designed to be pH-insensitive, making them preferable for applications where pH fluctuations occur [35].
Compartment-Specific Targeting: Different biosensors show varying effectiveness in subcellular compartments. iNAP1 has been successfully targeted to both cytosol and mitochondria, revealing compartment-specific NADPH dynamics during endothelial senescence [6].
Dynamic Range Requirements: NAPstars offer monitoring across a 5000-fold range of NADPH/NADP+ ratios (0.001 to 5), making them suitable for detecting both subtle and dramatic redox changes [25].
The development of genetically encoded biosensors has transformed our ability to monitor NADPH dynamics in live cells with unprecedented spatial and temporal resolution. The current generation of tools, including the NAPstar family, iNAP sensors, and NADP-Snifit, each offer distinct advantages for specific research contexts. The selection of an appropriate biosensor depends critically on the experimental requirements, including the need for compartment-specific targeting, pH stability, dynamic range, and compatibility with other experimental probes. As these tools continue to evolve, they will undoubtedly yield deeper insights into the fundamental role of NADPH metabolism in health, disease, and therapeutic interventions.
The reduced form of nicotinamide adenine dinucleotide phosphate (NADPH) serves as a central redox cofactor in metabolic networks, providing reducing power for antioxidant defense, reductive biosynthesis, and cellular signaling pathways. Efficient NADPH regeneration is a critical limiting factor for productivity in biotransformation processes and maintaining cellular health [37]. Traditional static regulation strategies for modulating NADPH levels have included direct genetic modifications such as overexpressing endogenous NADPH-producing enzymes (e.g., glucose-6-phosphate dehydrogenase [G6PD] or isocitrate dehydrogenase), knocking out competing pathways, modifying cofactor preference through protein engineering, and promoter/RBS engineering [37]. While these approaches have demonstrated utility in metabolic engineering, they often lead to NADPH/NADP+ imbalance due to their inability to provide real-time adjustment of intracellular cofactor levels in response to changing cellular demands [37].
The emergence of dynamic regulation systems centered on genetically encoded biosensors has revolutionized NADPH monitoring and manipulation, enabling real-time readouts of NADPH/NADP+ ratios with subcellular resolution [37] [25]. These biosensors have become indispensable tools for high-throughput drug screening, allowing researchers to identify NADPH-modulating compounds with unprecedented efficiency and precision. This review compares the performance of current NADPH biosensor technologies and their application in screening platforms for discovering therapeutic compounds that target NADPH-related pathways in aging, metabolic disease, and cardiovascular disorders [6] [38].
Comparative Analysis of NADPH Biosensor Technologies
The development of genetically encoded biosensors has enabled real-time monitoring of NADPH dynamics in live cells and organisms, providing invaluable tools for drug discovery campaigns. The table below compares the key characteristics of major NADPH biosensor classes:
Table 1: Performance Comparison of NADPH/NADP+ Biosensors
| Biosensor | Sensor Type | Detection Principle | Dynamic Range | Key Advantages | Limitations |
|---|---|---|---|---|---|
| iNap Family [6] [25] | Genetically encoded (Rex-based) | Fluorescence intensity | ~2.5-3 fold | Specific NADPH detection; validated in mammalian cells | Excitation at short wavelengths; potentially pH-sensitive |
| NAPstars [25] | Genetically encoded (Peredox-derived) | Ratiometric (TS/mCherry) | ~2.5 fold (5000-fold NADPH/NADP+ ratio range) | pH-insensitive; tunable response range; compatible with FLIM | Requires characterization of variant specificity |
| NADP-Snifit [35] | Semisynthetic | FRET-based | ~9 fold | Ratiometric; pH-insensitive; excitable at long wavelengths | Requires chemical labeling; more complex implementation |
| NERNST [25] | roGFP2-based | Ratiometric | Varies with system | Measures NADPH/NADP+ balance | Potential cross-reactivity with glutathione system |
The NAPstar family, introduced in 2024, represents a significant advancement with its large dynamic range covering NADPH/NADP+ ratios from 0.001 to 5, and specificity for NADP over NAD [25]. These sensors enable measurements across multiple eukaryotic systems (yeast, plants, mammalian cells) and have revealed conserved robustness of cytosolic NADP redox homeostasis, cell cycle-linked NADP redox oscillations in yeast, and illumination-dependent changes in plants [25].
The iNap sensors have been successfully deployed in physiological studies, such as demonstrating the compartment-specific regulation of NADPH during endothelial cell senescence, where cytosolic—but not mitochondrial—NADPH levels increase during aging [6]. This spatial resolution is crucial for understanding nuanced drug effects on subcellular NADPH pools.
Table 2: Experimental Applications of NADPH Biosensors in Drug Screening
| Application Context | Biosensor Used | Readout | Key Findings |
|---|---|---|---|
| Vascular aging drug screening [6] | iNap1 | Fluorescence ratio (405/488 nm) | Identified folic acid as NADPH-boosting compound from 1419 FDA-approved drugs |
| Antioxidant pathway analysis [25] | NAPstars | Fluorescence lifetime (FLIM) & ratiometric | Glutathione system dominates antioxidative electron flux over thioredoxin system |
| Metabolic adaptation studies [35] | NADP-Snifit | FRET efficiency | Enabled mapping of NADPH/NADP+ ratios in response to environmental changes |
| Cytosolic vs mitochondrial NADPH dynamics [6] | cyto-iNap1 / mito-iNap3 | Compartment-specific fluorescence | Revealed distinct NADPH regulation during endothelial senescence |
Experimental Protocols for Biosensor-Based Screening
Biosensor Implementation and Validation
Establishing a robust screening platform requires careful implementation and validation of chosen biosensors. The following workflow outlines the key steps:
Sensor Selection and Vector Construction: Select appropriate biosensor based on desired dynamic range, specificity, and compatibility with experimental system. For subcellular compartment targeting, fuse biosensor to localization signals (e.g., mitochondrial targeting sequence for mitochondrial NADPH measurements [6]). The NAPstar series offers variants with different NADPH binding affinities (Kd(NADPH) ranging from 0.9 μM for NAPstar1 to 11.6 μM for NAPstar6), enabling selection based on expected intracellular NADPH concentrations [25].
Cell Line Engineering and Monoclonal Selection: Generate stable cell lines expressing biosensors using lentiviral transduction or similar methods. Select monoclonal populations to ensure homogeneous sensor expression, which is critical for screening consistency. For HTS applications, Z'-factor values >0.5 must be established to ensure assay robustness [39].
Validation and Quality Control:
- Confirm proper subcellular localization via confocal microscopy [6]
- Validate sensor functionality using known stimuli (e.g., diamide for oxidation, N-acetylcysteine for reduction) [6]
- Establish dynamic range under experimental conditions
- Determine fluorescence lifetime values for FLIM-compatible sensors like NAPstars [25]
High-Throughput Screening Protocol
Sample Protocol for NADPH-Modulating Compound Screening:
- Cell Preparation: Plate biosensor-expressing cells in 384-well plates at optimized density (e.g., 5,000-10,000 cells/well for adherent cells) and culture for 16-24 hours [6] [39].
- Compound Treatment: Add compound libraries using automated liquid handling systems. Include appropriate controls (untreated, positive controls for NADPH increase/decrease).
- Incubation: Incubate plates for predetermined time based on kinetics of NADPH response (typically 4-48 hours depending on biological context).
- Signal Detection:
- For intensity-based sensors: Read fluorescence at appropriate wavelengths (e.g., 405/488 nm excitation for iNap sensors) [6]
- For ratiometric sensors: Acquire multiple excitation/emission pairs and calculate ratios
- For FLIM-compatible sensors: Perform fluorescence lifetime imaging for more quantitative measurements [25]
- Data Analysis: Normalize signals to controls, calculate Z-scores for compound effects, and identify hits based on predetermined thresholds (typically >3 standard deviations from mean).
Counter-Screening: Include secondary assays to exclude false positives resulting from autofluorescence, compound interference with fluorescence, or general cytotoxicity [39].
Research Reagent Solutions Toolkit
Table 3: Essential Research Reagents for NADPH Biosensor Applications
| Reagent Category | Specific Examples | Function/Application | Key Considerations |
|---|---|---|---|
| NADPH Biosensors | iNap1, iNap3 [6]; NAPstar series [25]; NADP-Snifit [35] | Real-time monitoring of NADPH/NADP+ ratios | Select based on specificity, dynamic range, and pH sensitivity requirements |
| Cell Lines | Primary Human Aortic Endothelial Cells (HAECs) [6]; THP-1 [40]; HEK293; Yeast strains [25] | Model systems for NADPH studies | Primary cells offer physiological relevance; established lines provide reproducibility |
| Validation Reagents | Diamide [6]; Folic Acid [6]; H2O2 [40]; Angiotensin II [6] | Sensor calibration and experimental controls | Establish response dynamics and specificity |
| Screening Equipment | Fluorescence microplate readers; Confocal microscopes; FACS systems [39] [41] | Signal detection and analysis | HTS requires automated systems with environmental control |
| Compound Libraries | FDA-approved drug collections [6]; Natural product libraries; Targeted chemical collections | Source of NADPH-modulating candidates | Pre-characterized libraries facilitate translational development |
Signaling Pathways in NADPH Regulation and Drug Action
Understanding NADPH regulatory networks is essential for interpreting screening results and hypothesizing mechanisms of action for identified compounds. The major pathways involved in NADPH metabolism and their modulation by screening hits include:
The oxidative pentose phosphate pathway (oxPPP), particularly the rate-limiting enzyme G6PD, represents the major NADPH source in many cell types [37] [6]. Screening campaigns have identified compounds that influence G6PD activity, including those affecting its post-translational modification (e.g., S-nitrosylation at C385) [6]. The folate metabolism pathway generates NADPH through methylenetetrahydrofolate dehydrogenase (MTHFD) and has been successfully targeted by identified hits like folic acid, which elevated NADPH content and ameliorated vascular aging in mouse models [6].
NADPH is consumed by several systems including the glutathione (GSH) and thioredoxin (Trx) antioxidant systems, and NADPH oxidases (NOX) that generate signaling ROS [6] [25]. Recent biosensor studies using NAPstars have demonstrated that under acute oxidative challenge, the glutathione system serves as the primary mediator of antioxidative electron flux across diverse eukaryotic cells, highlighting its importance as a target for cytoprotective compounds [25].
Applications in Drug Discovery and Development
Case Study: Vascular Aging Drug Screening
A compelling application of NADPH biosensors in HTS comes from vascular aging research, where researchers used the iNap1 biosensor to screen 1419 FDA-approved drugs for effects on cytosolic NADPH in human aortic endothelial cells (HAECs) [6]. The study employed the following experimental workflow:
- Senescence Model Establishment: Induced senescence in HAECs using angiotensin II (2 μM for 72 hours) or other stressors (high glucose, endothelin-1, homocysteine)
- Biosensor Monitoring: Expressed cyto-iNap1 in senescent cells and measured fluorescence ratio (405/488 nm excitation)
- Primary Screening: Tested compound library for NADPH-modulating effects
- Hit Validation: Confirmed folic acid as a top hit that elevated NADPH via MTHFD1
- Functional Assessment: Demonstrated that folic acid alleviated vascular aging in angiotensin II-infused mice and naturally aged mice
This campaign successfully identified folic acid as an NADPH-boosting compound that protected against endothelial senescence by increasing reduced glutathione and inhibiting HDAC3 activity [6]. The study highlights how biosensor-based screening can rapidly translate compound identification to functional validation in disease models.
Comparative Performance in Different Screening Paradigms
The selection of appropriate biosensors depends on specific screening requirements:
For kinetic studies and subcellular resolution: NAPstar sensors offer advantages with their FLIM compatibility and minimal perturbation of cellular NADPH pools, enabling precise measurements of compartment-specific dynamics [25].
For high-content screening with spatial information: iNap sensors provide sufficient resolution to distinguish cytosolic versus mitochondrial NADPH pools, as demonstrated in studies showing compartment-specific changes during endothelial senescence [6].
For endpoint screening in high-throughput formats: Ratiometric sensors like NADP-Snifit offer excellent Z'-factors and robustness for large-scale compound screening [35].
Genetically encoded biosensors have transformed our ability to identify NADPH-modulating compounds through high-throughput screening, enabling the discovery of therapeutic candidates with precise effects on redox metabolism. The evolution from static to dynamic regulation strategies has addressed previous limitations in maintaining NADPH/NADP+ balance, with modern biosensors providing real-time, compartment-resolved monitoring of cofactor dynamics.
Future developments will likely focus on expanding the color palette of NADPH biosensors for multiplexed imaging with other metabolic sensors, enhancing sensitivity to detect subtle physiological changes, and improving targeting to additional subcellular locations. The integration of these advanced biosensor technologies with CRISPR-based screening approaches and human organoid models will further accelerate the discovery of NADPH-targeted therapeutics for aging, metabolic diseases, and conditions characterized by redox imbalance [39] [42]. As these tools continue to evolve, they will undoubtedly uncover new aspects of NADPH biology and provide innovative strategies for therapeutic intervention in redox-related pathologies.
Reduced nicotinamide adenine dinucleotide phosphate (NADPH) serves as an essential redox cofactor and a crucial node in the cellular metabolic network. It provides the reducing power for numerous biosynthetic processes, maintains the cellular antioxidant defense system, and functions as a key regulator in energy metabolism [37]. The regulation of NADPH metabolism presents a particular challenge because its production and consumption are distributed across multiple interconnected pathways and cellular compartments. The complex nature of NADPH metabolism poses significant challenges for therapeutic intervention in diseases where NADPH imbalance is a pathological feature, including cancer, metabolic disorders, and inflammatory conditions [43].
Network pharmacology has emerged as a powerful interdisciplinary approach that aligns perfectly with the complexity of NADPH metabolism. Unlike traditional single-target drug discovery, network pharmacology integrates systems biology, omics technologies, and computational methods to identify and analyze multi-target drug interactions within biological networks [44]. This approach is particularly well-suited for understanding and modulating NADPH metabolism, as it enables researchers to visualize and quantify the interactions between multiple pathways involved in NADPH generation and utilization, including the pentose phosphate pathway (PPP), Entner-Doudoroff (ED) pathway, and TCA cycle [37].
This review employs a comparative framework to evaluate two fundamental strategic paradigms for regulating NADPH metabolism: static regulation and dynamic regulation. Through systematic analysis of experimental data and methodologies, we provide researchers with objective criteria for selecting appropriate strategies based on specific research or production objectives.
Network Pharmacology Workflow for NADPH Research
The investigation of NADPH regulation through network pharmacology follows a structured computational and experimental pipeline. This workflow enables the identification of multi-target mechanisms underlying NADPH metabolism and the prediction of compounds capable of modulating this essential cofactor.
Computational Target Identification and Validation
The initial phase involves comprehensive data collection of bioactive compounds from databases such as the Traditional Chinese Medicine Systems Pharmacology Database and Analysis Platform (TCMSP), PubChem, and ChEMBL [44] [45]. Following compound identification, target prediction utilizes ligand-based approaches including Similarity Ensemble Approach (SEA) and SwissTargetPrediction, which operate on the principle that structurally similar molecules often bind to similar protein targets [45]. Concurrently, disease-associated genes related to NADPH metabolism are compiled from databases including GeneCards, OMIM, and DisGeNET [45] [46].
Network construction represents the core of this approach, integrating compound-target interactions and protein-protein interaction (PPI) data from databases such as STRING [44] [46]. This multi-layered network is visualized and analyzed using Cytoscape software, where topological analysis through plugins like CytoHubba identifies key nodes (hub genes) within the NADPH regulatory network [46] [47]. These hub genes represent proteins with high connectivity that likely serve as critical regulators of NADPH metabolism. Subsequent pathway enrichment analysis using KEGG and Gene Ontology (GO) databases reveals the biological pathways and processes through which these key targets influence NADPH metabolism [45] [46].
Molecular docking provides in silico validation of predicted compound-target interactions by calculating binding affinities and simulating molecular interactions [47]. For enhanced accuracy, molecular dynamics simulations can be performed to confirm binding energy and ligand stability over time, typically running for 100 ns per protein-drug complex in software such as GROMACS [47].
Experimental Validation of NADPH Modulation
The computational predictions require experimental validation through a series of methodological approaches. Cell-based assays measure NADPH level changes following treatment with identified compounds, with concentration-dependent responses providing confirmation of bioactivity [43]. Gene and protein expression analysis of hub targets (e.g., qRT-PCR, Western blot) verifies whether identified compounds actually modulate the predicted targets at transcriptional and translational levels [46] [47]. Additional functional assays evaluate downstream effects on relevant physiological processes, including oxidative stress response, inflammatory pathways, and metabolic flux [45].
The NADPHnet strategy represents a specialized implementation of this workflow, employing network-based methods to predict key proteins and drug-target interactions related to NADPH metabolism [43]. This approach characterizes the impact of natural products on NADPH metabolism using a combined score (NADPH-Score) and has demonstrated broader applicability and improved accuracy in external validation compared to traditional single-target approaches [43].
Comparative Analysis of Static vs. Dynamic Regulation Strategies
NADPH regulation strategies can be broadly categorized into static and dynamic approaches, each with distinct mechanisms, advantages, and limitations. The following comparison synthesizes experimental data and performance metrics from current research.
Table 1: Performance Comparison of Static vs. Dynamic NADPH Regulation Strategies
| Parameter | Static Regulation | Dynamic Regulation | Experimental Measurement |
|---|---|---|---|
| NADPH Titer/Level Improvement | 20-50% [37] | 75.7% (gentamicin C1a production) [48] | HPLC, LC-MS, enzymatic assays |
| NADPH/NADP+ Ratio Control | Limited, often causes imbalance [37] | Precise, maintains redox balance [37] | Ratiometric biosensors (NERNST) [37] |
| Temporal Resolution | Fixed throughout process [37] | Real-time adjustment [37] [48] | Time-course metabolomics [48] |
| Cellular Growth Impact | Often impaired due to cofactor imbalance [37] | Maintained through phase-specific adjustments [37] [48] | OD600, cell counting, viability assays |
| Pathway Engineering Complexity | Moderate (promoter engineering, gene knockout) [37] | High (biosensors, regulatory circuits) [37] [42] | Flux balance analysis, metabolic modeling |
| Production Phase Specificity | Uniform across growth phases [37] | Phase-optimized (growth vs. production) [37] [48] | Phase-specific metabolomics [48] |
Static Regulation Strategies: Methods and Experimental Outcomes
Static regulation employs fixed genetic modifications to enhance NADPH regeneration, primarily through direct manipulation of NADPH metabolic pathways. The most common approach involves overexpressing endogenous genes encoding NADPH-generating enzymes, such as glucose-6-phosphate dehydrogenase (zwf) in the pentose phosphate pathway or NAD kinase (ppnK) [37]. For example, Li et al. demonstrated that overexpressing ppnK and zwf increased NADPH supply and improved poly-3-hydroxybutyrate (PHB) production by enhancing flux through the PHB biosynthesis pathway [37].
Heterologous expression of NADPH-regenerating enzymes represents another static approach. Research has shown that expressing isocitrate dehydrogenases (IDHs) from Corynebacterium glutamicum and Azotobacter vinelandii in Escherichia coli enhanced NADPH regeneration capacity [37]. Alternative static strategies include: reducing or knocking out competing pathways for NADPH consumption; modifying cofactor preference through protein engineering; promoter/RBS engineering to fine-tune expression levels of NADPH-related enzymes; and external chemical or photochemical NADPH regeneration methods [37].
The experimental protocols for evaluating static regulation typically involve: constructing overexpression strains via plasmid-based expression or chromosomal integration; measuring NADPH levels using enzymatic assays or biosensors; quantifying specific metabolites (e.g., gentamicin C1a, fatty acids, terpenes) via HPLC or LC-MS; and analyzing metabolic fluxes through 13C-labeling experiments and flux balance analysis [37] [48].
The primary limitation of static regulation is its inability to respond to changing cellular conditions, often leading to NADPH/NADP+ imbalance that disrupts cell growth and productivity. This approach cannot provide real-time monitoring or adjustment of intracellular NADP(H) levels, resulting in suboptimal metabolic efficiency [37].
Dynamic Regulation Strategies: Advanced Methodologies and Performance
Dynamic regulation employs real-time monitoring and control systems to adjust NADPH metabolism in response to changing cellular conditions. These systems typically incorporate biosensors that detect intracellular NADPH/NADP+ ratios and regulatory circuits that modulate expression of NADPH-related genes accordingly [37].
Genetically encoded biosensors form the core of dynamic regulation systems. The transcription factor SoxR biosensor specifically responds to NADPH/NADP+ ratios in E. coli, enabling real-time monitoring of NADPH metabolism [37]. For broader applicability across organisms, the NERNST biosensor was developed—a ratiometric system based on a redox-sensitive green fluorescent protein (roGFP2) coupled with an NADPH thioredoxin reductase C module [37]. This biosensor enables real-time monitoring of NADPH/NADP+ redox status across various organisms and provides a platform for implementing dynamic control strategies [37].
Artificial intelligence (AI)-driven control frameworks represent the most advanced approach to dynamic regulation. In a recent demonstration for gentamicin C1a production, an AI-driven system integrated multiple modules: backpropagation neural network (BPNN)-based kinetic modeling (with R² values of 0.9631, 0.9578, and 0.9689 for specific substrate consumption rates, specific growth rates, and specific gentamicin C1a production rates, respectively); multi-objective optimization (NSGA-II); dual-spectroscopy monitoring (near-infrared and Raman); and closed-loop feedback control [48]. This integrated system enabled real-time coordination between carbon, nitrogen, and oxygen supplementation based on cellular demands, resulting in a 75.7% improvement in gentamicin C1a titer compared to traditional fed-batch fermentation [48].
Metabolic flux analyses of dynamically regulated systems reveal characteristic reorganization of metabolic networks during late fermentation phases, including increased flux through the pentose phosphate pathway and enhanced NADPH generation and consumption [48]. Natural dynamic regulation mechanisms also exist, such as the cyclical operation of the Entner-Doudoroff pathway in certain Pseudomonadaceae, where pathway cyclicity increases during stationary phase to support production of compounds like rhamnolipids and polyhydroxyalkanoates [37].
NADPH-Related Signaling Pathways in Disease and Therapy
NADPH metabolism intersects with numerous disease-relevant signaling pathways, creating potential intervention points for network pharmacology approaches. Understanding these pathway interactions is essential for developing effective NADPH-targeted therapies.
The Nrf2/KEAP1/ARE pathway emerges as the most frequently validated mechanism for antioxidant activities regulated by NADPH-dependent compounds [45]. Under oxidative stress, NADPH helps maintain cellular redox balance and supports the activation of Nrf2, which translocates to the nucleus and activates antioxidant response element (ARE)-driven genes encoding enzymes like glutathione peroxidases (GPx) [45] [46].
The NF-κB signaling pathway represents a central inflammatory mechanism that is closely linked to NADPH metabolism. NADPH oxidase-derived ROS can activate NF-κB signaling, which in turn promotes the expression of pro-inflammatory cytokines including TNF-α, IL-6, and IL-1β [45] [46]. Network pharmacology studies have consistently identified NF-κB as a key target for natural products with both antioxidant and anti-inflammatory properties, highlighting its position as a critical interface between oxidative stress and inflammation [45].
The PI3K/AKT/mTOR pathway serves as another important node in NADPH-related networks, integrating growth factor signaling with metabolic regulation and cell survival decisions [44] [45]. This pathway is particularly significant in cancer contexts, where NADPH metabolism supports rapid proliferation and protects against oxidative stress [43]. Additionally, mitochondrial dysfunction pathways connect NADPH status to cellular energy production, apoptosis regulation, and calcium homeostasis, with implications for neurodegenerative diseases, cardiovascular conditions, and metabolic syndromes [49].
Research Reagent Solutions for NADPH Studies
The experimental investigation of NADPH regulation requires specialized reagents and tools. The following table summarizes essential materials and their applications in NADPH research.
Table 2: Essential Research Reagents for NADPH Regulation Studies
| Reagent Category | Specific Examples | Research Application | Key Features |
|---|---|---|---|
| Biosensors | SoxR biosensor, NERNST (roGFP2 + TrxR) [37] | Real-time monitoring of NADPH/NADP+ ratios | Ratiometric measurement, genetic encoding |
| Computational Databases | TCMSP, DrugBank, STITCH, STRING [44] [45] | Target prediction and network construction | Compound-target interactions, PPI data |
| Natural Product Compounds | Oxyberberine, Scopoletin, Tanshinone IIA [43] [46] | Validation of NADPH modulation | Multi-target activity, concentration-dependent effects |
| Analytical Tools | Cytoscape (with CytoHubba), AutoDock, GROMACS [44] [47] | Network analysis and molecular docking | Topological analysis, binding affinity calculations |
| Pathway Modulators | Nrf2 activators, NF-κB inhibitors, PI3K/AKT modulators [45] | Experimental validation of predicted targets | Pathway-specific activity, dose-responsive |
| Cell-Based Assay Systems | RAW264.7 macrophages, HLF fibroblasts [46] [47] | In vitro validation of anti-inflammatory/antioxidant effects | Disease-relevant models, reproducible responses |
The comparative analysis of NADPH regulation strategies reveals distinct applications for static and dynamic approaches. Static regulation offers a more straightforward implementation for systems with consistent NADPH demands throughout the cultivation period, while dynamic regulation provides superior performance for processes with phase-specific metabolic requirements or those requiring precise redox balance maintenance.
Network pharmacology serves as an essential framework for identifying multi-target approaches to NADPH regulation, particularly for complex diseases where NADPH metabolism intersects with multiple pathological pathways. The integration of computational predictions with experimental validation has successfully identified natural products like Oxyberberine that modulate NADPH levels and exhibit therapeutic potential for diabetes and cancer [43].
Future directions in NADPH regulation research will likely focus on advanced dynamic control systems incorporating AI-driven optimization [48], refined biosensors with enhanced sensitivity and specificity [37] [42], and the integration of multi-omics data for comprehensive network analysis [44]. These developments will further enhance our ability to precisely modulate NADPH metabolism for therapeutic intervention in complex diseases characterized by redox imbalance.
Challenges and Solutions in NADPH Measurement and Manipulation
The accurate measurement of nicotinamide adenine dinucleotide phosphate (NADPH) is fundamental to advancing our understanding of cellular metabolism, redox biology, and for developing effective dynamic regulation strategies. However, researchers face significant technical challenges that can compromise data integrity and biological interpretation. Key among these are the pH sensitivity of biosensors, the compartment-specific nature of NADPH pools, and the difficulty in distinguishing NADPH from its close analog, NADH. This guide objectively compares the performance of current NADPH monitoring tools and methodologies, providing experimental data to inform selection and implementation for rigorous scientific investigation.
Biosensor Performance: A Comparative Analysis of Key Tools
The development of genetically encoded biosensors has revolutionized the study of NADPH dynamics, yet each tool comes with distinct advantages and limitations. The table below summarizes the performance characteristics of several prominent biosensors.
Table 1: Performance Comparison of Genetically Encoded NADPH/NADP+ Biosensors
| Biosensor Name | Reports | Key Features & Improvements | pH Sensitivity | Specificity (NADPH vs. NADH) | Subcellular Compartmentalization | Primary Limitations |
|---|---|---|---|---|---|---|
| NAPstar Family [25] | NADPH/NADP+ Ratio | Rational design from Peredox; Real-time, ratiometric measurements across a wide NADPH/NADP+ range (0.001 to 5). | Limited sensitivity | High specificity; Kd(NADPH) 0.9-11.6 µM vs. Kd(NADH) 24.4-248.9 µM [25]. | Demonstrated in cytosol and mitochondria [25]. | Some variants (e.g., NAPstar6/7) show slight dependence on total NADP pool size [25]. |
| iNap Family [6] [25] | NADPH Concentration | Used with targeting sequences for compartment-specific measurement (e.g., cytosol, mitochondria) [6]. | Sensitivity noted for cpYFP-based sensors like iNap and SoNar [25]. | Requires dimerization for function, adding expression level as a variable [25]. | Successfully deployed in cytosol and mitochondria [6]. | Based on cpYFP, which has known pH sensitivity [25]. |
| NERNST [25] | NADPH/NADP+ Ratio | Based on roGFP2 and an NADPH thioredoxin reductase C module. | -- | Considerable concerns regarding specificity as roGFP2 efficiently equilibrates with the glutathione redox couple in vivo [25]. | -- | Lacks specificity for the NADP couple due to cross-talk with glutathione redox state [25]. |
| SoNar [6] | NADH/NAD+ Ratio | -- | High sensitivity, as a cpYFP-based sensor [6]. | Reports on NADH, but significant cross-reactivity with NADPH can confound interpretation [6]. | -- | High pH sensitivity and significant NADPH cross-reactivity limit utility for specific NADH detection [6]. |
Experimental Protocols for Validating NADPH Metabolism Tools
Protocol: In Vitro Characterization of Biosensor Specificity
This methodology is critical for determining the cross-reactivity of a sensor with NADH, a common pitfall in the field [25].
- Recombinant Protein Purification: Express the biosensor (e.g., NAPstar variants) in E. coli and purify using affinity chromatography suitable for the tag (e.g., His-tag).
- Fluorometric Titration: Record fluorescence spectra (excitation/emission) of the purified biosensor in a buffered solution.
- NADPH Titration: Titrate with increasing concentrations of NADPH (e.g., 0–100 µM) in the presence of a constant, physiologically relevant concentration of NADP+ (e.g., 150 µM).
- NADH Titration: In a separate experiment, titrate with NADH (0–1000 µM) in the presence of a constant, high concentration of NAD+ (e.g., 500 µM) to assess cross-reactivity.
- Data Analysis: Plot the ratiometric fluorescence response (e.g., TS/mCherry for NAPstars) against the nucleotide concentration. Fit the data to determine the apparent dissociation constants (Kd) for NADPH and NADH. A high Kd(NADH) relative to Kd(NADPH) indicates strong specificity [25].
Protocol: Compartment-Specific NADPH Measurement in Live Cells
This protocol, derived from studies in primary human aortic endothelial cells (HAECs), allows for direct comparison of cytosolic and mitochondrial NADPH pools [6].
- Sensor Expression: Transfect cells with genetically encoded biosensors (e.g., iNap1, iNap3, or NAPstars) targeted to specific compartments using localization sequences.
- Cytosolic Sensor: cyto-iNap1 (lacking a targeting sequence or with a nuclear export signal).
- Mitochondrial Sensor: mito-iNap3 (fused to a mitochondrial targeting sequence).
- Confocal Imaging and Calibration:
- Image live cells using a confocal microscope with appropriate excitation lasers (e.g., 405/488 nm for iNap).
- For in situ calibration, permeabilize the plasma membrane (0.001% digitonin) or mitochondrial inner membrane (0.3% digitonin) and expose cells to a range of known NADPH concentrations. This generates a standard curve for converting fluorescence ratio to NADPH concentration [6].
- Experimental Intervention: Expose sensor-expressing cells to physiological or pharmacological stimuli.
- Positive Control: Apply 100 µM diamide, a strong oxidant that consumes NADPH, to observe a decrease in the cytosolic iNap signal [6].
- Metabolic Perturbation: Use compounds like rotenone (inhibits mitochondrial complex I) or substrates like β-hydroxybutyrate/acetoacetic acid to manipulate mitochondrial NADH/NAD+ ratios and validate compartment-specific responses [6].
- Data Quantification: Calculate the fluorescence ratio (405/488 or 420/485) over time for each subcellular compartment. Normalize data to a non-responsive control sensor (e.g., iNapc) if available.
Protocol: Tracing NADPH Production Using Deuterated Glucose
This method leverages stable isotopes to trace the fate of hydride ions from specific metabolic pathways into the NADPH pool and downstream products [50].
- Cell Culture and Labeling: Culture cells (e.g., H1299 non-small cell lung cancer cells) in standard media, then switch to media containing
[3-²H]glucose.- Rationale: The hydrogen at the C3 position of glucose is transferred to NADPH by the enzyme 6-phosphogluconate dehydrogenase (6PGD) in the oxidative pentose phosphate pathway (PPP). This label is lost to water in glycolysis, preventing confounding labeling of downstream metabolites, making it ideal for tracing PPP-derived NADPH [50].
- Metabolite Extraction: Harvest cells at various time points (from 30 minutes to 72 hours) using a quenching solution like cold methanol. Extract intracellular metabolites.
- Mass Spectrometry Analysis:
- Analyze metabolite extracts using LC-MS/MS to detect deuterium incorporation into NADPH.
- To link NADPH production to biosynthetic outputs, analyze labeling in fatty acids (e.g., myristate, palmitate) and cholesterol after 72 hours of labeling [50].
- Data Interpretation: Quantify the percentage of labeled NADPH species (M+1, M+2). Rapid labeling confirms NADPH turnover. Labeling in lipids, but not in citrate, confirms the label was incorporated via NADPH-dependent reductases and not through carbon skeletons [50].
Visualization of NADPH Metabolism and Technical Challenges
NADPH Metabolic Pathways and Measurement Interference
The diagram below illustrates the primary cellular sources of NADPH and highlights key technical pitfalls in its measurement.
Experimental Workflow for a Rigorous NADPH Study
This workflow outlines a comprehensive approach for a compartment-specific NADPH study that proactively addresses common technical pitfalls.
The Scientist's Toolkit: Key Research Reagent Solutions
This table details essential reagents and their functions for studying NADPH metabolism, helping researchers select the right tools for their experimental needs.
Table 2: Essential Research Reagents for NADPH Studies
| Reagent / Tool | Function / Utility | Key Experimental Considerations |
|---|---|---|
| [3-²H] Glucose [50] | Isotopic tracer for PPP-derived NADPH. Hydrogen from C3 is transferred to NADPH via 6PGD. | Label does not exchange in glycolysis, providing a clean readout of NADPH produced by the oxidative PPP [50]. |
| Genetically Encoded Biosensors (e.g., NAPstars, iNaps) [6] [25] | Live-cell, compartment-specific monitoring of NADPH or NADPH/NADP+ ratio. | Requires validation of specificity (vs. NADH) and pH sensitivity. Expression levels of some sensors (iNaps) can affect readings [6] [25]. |
| Digitonin [6] | Mild detergent for selective plasma membrane permeabilization. | Enables in situ calibration of biosensors in live cells by allowing controlled access of NADPH to the sensor [6]. |
| Diamide [6] | Thiol-oxidizing agent that consumes NADPH. | Useful as a positive control to induce a decrease in cytosolic NADPH sensor signal and test antioxidant response [6]. |
| NADK Inhibitors | Pharmacological tools to inhibit de novo NADP+ synthesis. | Useful for probing the dependency of cellular processes on the NADP(H) pool. Specific inhibitors are an area of active development. |
| LC-MS/MS | High-sensitivity quantification of NADPH, NADP+, and isotopic labeling. | Requires rapid quenching of metabolism. Provides absolute concentrations but lacks subcellular resolution without fractionation [50]. |
Navigating the technical pitfalls of pH sensitivity, compartment-specificity, and nucleotide discrimination is paramount for generating reliable data in NADPH research. The experimental data and comparisons presented here demonstrate that while no single tool is flawless, a strategic combination of rigorously validated biosensors like the NAPstar family, isotopic tracing with [3-²H] glucose, and meticulous experimental protocols can effectively overcome these challenges. This objective comparison of performance and methodologies provides a framework for researchers to design robust studies, ultimately strengthening the foundation for developing targeted static and dynamic NADPH regulation strategies.
Reduced nicotinamide adenine dinucleotide phosphate (NADPH) serves as a central redox currency in living cells, powering essential processes including reductive biosynthesis, antioxidant defense, and redox signaling [37] [25]. Traditionally, NADPH metabolism has been studied through static measurements that provide snapshot views of pool sizes, failing to capture the dynamic fluctuations that underlie metabolic regulation and functional outcomes. The emerging paradigm in metabolic research emphasizes that dynamic NADPH flux, rather than static concentration, often correlates more strongly with physiological and pathological states [51] [25]. This shift necessitates advanced tools and methodologies capable of monitoring NADPH dynamics with high spatial and temporal resolution.
The critical limitation of traditional static approaches lies in their inability to capture rapid metabolic adaptations. As noted in recent reviews, "traditional static regulation methods often lead to the NADPH/NADP+ imbalance, causing disruptions in cell growth and production. These methods also fail to provide real-time monitoring of intracellular NADP(H) or NADPH/NADP+ levels" [37]. This technological gap has driven the development of genetically encoded biosensors and advanced flux analysis techniques that now enable researchers to correlate dynamic NADPH fluxes with functional biological outcomes across diverse experimental models and physiological conditions.
Methodological Framework: Tools for Monitoring NADPH Dynamics
Genetically Encoded Biosensors for Real-Time NADPH Monitoring
Table 1: Comparison of Genetically Encoded NADPH Biosensors
| Biosensor Name | Detection Principle | Dynamic Range | Subcellular Localization | Key Applications | Notable Features |
|---|---|---|---|---|---|
| NAPstar Family [25] | Ratiometric (TS/mCherry) | NADPH/NADP+ ratios: 0.001 to 5 | Cytosol, mitochondria, nucleus | Real-time monitoring in yeast, plants, mammalian cells | pH-insensitive, compatible with FLIM |
| iNap1 [6] | Ratiometric (Ex405/488) | NADPH concentration | Cytosol, mitochondria | Endothelial cell senescence studies | Used in high-throughput drug screening |
| NERNST [37] | roGFP2-based | NADPH/NADP+ ratio | Multiple compartments | Redox status assessment | Concerns about glutathione cross-talk |
| SoNar [6] | Ratiometric (Ex420/485) | NADH/NAD+ ratio | Cytosol, mitochondria | NADH redox measurements | Responsive to pyruvate/oxamate |
The NAPstar biosensor family, developed from the Peredox-mCherry chassis through rational mutagenesis of NADH-binding domains, represents a significant advancement in NADPH monitoring technology. These sensors incorporate a circularly permuted T-Sapphire (TS) fluorescent protein nested between two copies of the bacterial transcriptional repressor Rex domain, with mutations that switch specificity from NADH to NADPH binding [25]. The NAPstar sensors exhibit apparent dissociation constants for NADPH (Kd(NADPH)) ranging from 0.9 μM for NAPstar1 to 11.6 μM for NAPstar6, with substantially weaker affinity for NADH (24.4-248.9 μM), ensuring specificity for the NADP+ system [25].
Implementation of these biosensors involves transfection or transduction of target cells with plasmids encoding the biosensor, often with specific targeting sequences for subcellular localization. Confocal microscopy is then used to monitor fluorescence changes, with calibration performed using digitonin-permeabilized cells exposed to known NADPH concentrations [6]. The ratiometric nature of these measurements controls for variations in expression level and optical path length, enabling quantitative assessment of NADPH dynamics.
Metabolic Flux Analysis (MFA) and Isotope Tracing
Complementary to biosensor approaches, metabolic flux analysis through isotope tracing provides quantitative assessment of pathway activities that generate or consume NADPH. State-of-the-art approaches now enable "simultaneous quantification of metabolic fluxes in the liver, heart, and skeletal muscle of individual mice" through in vivo isotope infusion and tissue-specific analysis [52]. This multi-organ fluxomics platform revealed that obesity increases hepatic gluconeogenesis and citric acid cycle flux, accompanied by elevated glucose oxidation in the heart that compensates for impaired fatty acid oxidation [52].
The experimental workflow for in vivo multi-organ fluxomics typically involves:
- Continuous infusion of 13C-labeled substrates (e.g., [U-13C]glucose) in awake, unstressed mice
- Rapid tissue collection following anesthesia at predetermined time points
- Metabolite extraction and LC-MS analysis of isotope labeling patterns
- Computational flux estimation using metabolic network models
- Statistical comparison of flux distributions between experimental conditions
Comparative Analysis: Static vs. Dynamic NADPH Regulation Strategies
Fundamental Differences in Approach and Outcome
Table 2: Static vs. Dynamic NADPH Regulation Strategies
| Characteristic | Static Regulation | Dynamic Regulation |
|---|---|---|
| Core Approach | Constitutive overexpression or knockout of metabolic genes | Real-time adjustment using biosensors and inducible systems |
| Temporal Resolution | Single timepoint measurements | Continuous, real-time monitoring |
| NADPH/NADP+ Balance | Often causes imbalance [37] | Maintains homeostasis through feedback |
| Tools & Methods | Promoter engineering, gene knockout, protein engineering [37] | Genetically encoded biosensors, CRISPRi, controlled proteolysis [51] |
| Metabolic Impact | May reduce fitness due to resource misallocation | Maintains growth while optimizing production |
| Experimental Workflow | Design-Build-Test-Learn (DBTL) cycle | Automated feedback control systems |
| Therapeutic Applications | Limited by inability to adapt to changing conditions | Promising for adaptive metabolic therapies |
Quantitative Performance Comparison
The superior performance of dynamic regulation strategies is exemplified by engineering approaches in E. coli for xylitol production. In a landmark study, researchers implemented "2-stage dynamic metabolic control (DMC) to improve NADPH flux in E. coli using xylitol production from xylose as a test case" [51]. The results demonstrated that while a "stoichiometric approach" focusing on competitive flux reduction led to a 20-fold improvement in xylitol production, a "regulatory strategy" that dynamically manipulated metabolic regulation through reduced glucose-6-phosphate dehydrogenase activity and activation of membrane-bound transhydrogenase resulted in a 90-fold improvement [51]. These strains ultimately achieved remarkable titers of "200 g/L of xylitol from xylose at 86% of theoretical yield in instrumented bioreactors" [51].
The underlying mechanism for this dramatic improvement involves a unique metabolic state characterized by: (1) reduced glucose-6-phosphate dehydrogenase activity, leading to reduced NADPH pools; (2) increases in pyruvate ferredoxin oxidoreductase activity, improving acetyl-CoA flux and NADPH production; and (3) disruption of fatty acid biosynthesis, alleviating inhibition of membrane-bound transhydrogenase (PntAB) by fatty acid metabolites [51]. Crucially, "improved NADPH fluxes are, in part, a consequence of reduced NADPH pools," highlighting the complex relationship between metabolite concentrations and metabolic fluxes [51].
Case Studies: Correlating NADPH Dynamics with Functional Outcomes
NADPH Dynamics in Cellular Senescence and Aging
Compartment-specific NADPH dynamics have been directly correlated with cellular aging processes in endothelial cells (ECs). Using iNap1 biosensors, researchers discovered that "cytosolic, but not mitochondrial, NADPH level increases during EC senescence" [6]. This elevated cytosolic NADPH pool was linked to decreased NO availability, which promoted G6PD de-S-nitrosylation at C385, enhancing its activity and further increasing NADPH production [6].
Functional outcomes of this NADPH dynamic were demonstrated through intervention studies showing that "G6PD overexpression alleviated, while its knockdown aggravated, vascular aging" [6]. The mechanistic connection was established through the discovery that NADPH is "indispensable for G6PD to protect against vascular aging through increasing reduced glutathione and inhibiting HDAC3 activity" [6]. This case study exemplifies how dynamic NADPH monitoring can reveal compartment-specific metabolic adaptations with direct functional consequences in age-related pathologies.
NADPH Dynamics in Cancer Metabolism
In colorectal cancer (CRC) models, NFATc1-mediated metabolic reprogramming demonstrates how transcription factor activity directly influences NADPH metabolism and functional outcomes. Research has shown that "NFATc1 enhances NAD kinase (NADK) expression, elevating intracellular NADP+ levels to activate the PPP, thereby boosting proliferation" [53]. This NADPH flux supports ribose-5-phosphate production for nucleotide synthesis and NADPH for redox homeostasis and lipid biosynthesis, creating a functional outcome of accelerated tumor growth.
The therapeutic relevance of these findings was demonstrated through intervention studies showing that "NFATc1 inhibitors suppress colorectal cancer (CRC) growth by targeting the NFATc1/NADK and NFATc1/MDM2 axis and synergize with oxaliplatin" [53]. This case illustrates how understanding dynamic NADPH regulation can identify novel therapeutic targets in cancer metabolism.
Real-Time NADPH Dynamics in Oxidative Stress Response
Contrary to long-standing models, recent high-temporal-resolution studies using HyPerRed and iNap1 biosensors have revealed that "NADPH levels do not decrease 5-s after hydrogen peroxide treatment," contradicting the canonical feedback inhibition model for pentose phosphate pathway activation [54]. Instead, glucose sustains NADPH levels under acute oxidative stress through mechanisms that appear to involve anticipatory regulation rather than simple feedback loops.
This discovery was enabled by "simultaneous real-time, single-cell monitoring of NADPH and hydrogen peroxide" [54], highlighting the power of dynamic measurement approaches to challenge and refine established metabolic models. The functional outcome here is a fundamental revision of our understanding of redox regulation, with implications for understanding aging, cancer, and numerous other pathological conditions associated with oxidative stress.
The Scientist's Toolkit: Essential Research Reagents and Methods
Table 3: Research Reagent Solutions for NADPH Flux Studies
| Reagent/Method | Primary Function | Key Features | Example Applications |
|---|---|---|---|
| NAPstar Biosensors [25] | Real-time NADPH/NADP+ ratio monitoring | Subcellular targetable, pH-insensitive, FLIM-compatible | Cell cycle oscillations, metabolic cycling |
| iNap1 Biosensor [6] | NADPH concentration measurement | Specific for NADPH, rationetric | High-throughput drug screening, senescence studies |
| 13C-Glucose Isotope Tracers [52] | PPP flux quantification | Enables metabolic flux analysis | Multi-organ fluxomics, in vivo metabolic adaptation |
| CRISPRi/a Systems [51] | Dynamic gene expression control | Tunable, reversible gene regulation | Metabolic engineering, functional genomics |
| Targeted Proteolysis Systems [51] | Inducible protein degradation | Rapid protein removal, temporal control | 2-stage bioprocess optimization |
| SoxR Biosensor [37] | NADPH/NADP+ sensing in E. coli | Bacterial-specific response | Microbial metabolic engineering |
| LC-MS/MS Platforms | Absolute NADPH quantification | High sensitivity, specificity | Validation of biosensor measurements |
The correlation between dynamic NADPH flux and functional biological outcomes represents a paradigm shift in metabolic research, moving beyond static concentration measurements to capture the temporal and spatial dynamics that underlie metabolic regulation. The evidence from diverse biological contexts—including microbial engineering, cellular senescence, cancer metabolism, and oxidative stress response—consistently demonstrates that dynamic flux measurements provide superior predictive power for understanding functional outcomes compared to traditional static approaches.
Future advancements in this field will likely focus on several key areas: (1) development of next-generation biosensors with expanded dynamic range and reduced interference from similar metabolites; (2) integration of multi-omics approaches to correlate NADPH dynamics with transcriptional, translational, and post-translational events; (3) application of machine learning algorithms to predict metabolic behavior from dynamic flux data; and (4) translation of dynamic regulation strategies to therapeutic interventions for metabolic diseases, cancer, and age-related disorders.
The experimental frameworks and comparison data presented in this review provide a foundation for researchers to select appropriate strategies for correlating NADPH dynamics with functional outcomes in their specific biological systems. As these approaches continue to evolve, they will undoubtedly reveal new connections between NADPH metabolism, cellular function, and disease pathogenesis, opening new avenues for metabolic engineering and therapeutic development.
The equilibrium between antioxidant and pro-oxidant activities, known as the pro-oxidant-antioxidant balance (PAB), plays a critical role in cellular homeostasis and therapeutic outcomes [55]. This balance is particularly significant in the context of nicotinamide adenine dinucleotide phosphate (NADPH) metabolism, which serves as a central regulator of cellular redox status [37] [56]. Reduced NADPH functions as a crucial cofactor in metabolic networks, providing reducing power for both antioxidant defense systems and reductive biosynthesis [37]. The fundamental challenge in therapeutic interventions lies in precisely modulating this balance—whether to enhance antioxidant defenses against oxidative stress or to promote pro-oxidant effects for eliminating pathological cells, such as in antibacterial therapies or selective cancer treatments.
Understanding NADPH regulation is paramount for advancing these therapeutic strategies. NADPH oxidases (NOXs) form a family of electron-transporting membrane enzymes dedicated to reactive oxygen species (ROS) generation, making them prime therapeutic targets [56]. Simultaneously, the NADPH-dependent antioxidant systems provide cellular protection against oxidative damage. This article comprehensively compares static versus dynamic NADPH regulation strategies, providing experimental methodologies, key signaling pathways, and essential research tools for developing optimized redox-based interventions across various disease contexts, from infectious diseases to neurodegenerative disorders and metabolic conditions.
NADPH Regulation Strategies: Static vs. Dynamic Approaches
Static Regulation Strategies
Static regulation strategies involve permanent genetic modifications or constitutive expression systems to modulate NADPH metabolism. These approaches primarily target central carbon metabolic pathways, with the pentose phosphate pathway (PPP) being the predominant source of NADPH regeneration [37]. Common static regulation methods include:
- Promoter and RBS engineering to precisely regulate the expression of NADP(H)-dependent enzymes
- Protein engineering to modify the cofactor preference of dependent enzymes from NADPH to NADH or vice versa
- Endogenous cofactor engineering to control the expression of genes involved in NADPH consumption and regeneration
- Heterologous cofactor engineering to supplement the NADPH regeneration system with enzymes from other organisms
- Photochemical or electrochemical methods driven by solar energy, electron transfer, or chemical catalysts for NADPH regeneration [37]
While these strategies have demonstrated utility in metabolic engineering for production of high-value chemicals like amino acids, mevalonate, terpenes, and fatty-acid-based fuels, they possess significant limitations for therapeutic applications [37]. Traditional static regulation methods often lead to NADPH/NADP+ imbalance, causing disruptions in cell growth and production because they cannot adjust intracellular NADPH levels in real-time according to varying cellular demands at different physiological states [37].
Dynamic Regulation Strategies
Dynamic regulation strategies employ responsive systems that automatically adjust NADPH levels based on cellular conditions, offering more precise temporal control. These advanced approaches include:
- Natural dynamic adjustment mechanisms, such as the cyclicity of the Entner-Doudoroff (ED) pathway observed in Pseudomonadaceae and Burkholderiaceae, where the pathway becomes more cyclical during stationary growth phase to increase NADPH production for biosynthetic processes like rhamnolipid and polyhydroxyalkanoate production [37]
- Genetically encoded biosensors that enable real-time monitoring of intracellular NADP(H) redox status, allowing subsequent regulation of the NADPH/NADP+ balance [37]
- Specific biosensor systems including the transcription factor SoxR biosensor that responds to NADPH/NADP+ in E. coli, and the ratiometric NERNST biosensor utilizing a redox-sensitive green fluorescent protein (roGFP2) and NADPH thioredoxin reductase C module for monitoring NADP(H) redox status across various organisms [37]
Dynamic regulation is particularly valuable in therapeutic contexts where redox requirements fluctuate, such as during different disease stages or in response to treatment. For example, research has demonstrated that the dynamic adjustment of the ED pathway's cyclicity represents an effective bacterial strategy to transition between NADPH demands in cell growth phase versus polyhydroxyalkanoate production phase [37].
Comparative Analysis of Regulation Strategies: Experimental Data
Table 1: Comparison of Static vs. Dynamic NADPH Regulation Strategies
| Feature | Static Regulation | Dynamic Regulation |
|---|---|---|
| Temporal Control | Fixed, constitutive | Responsive, real-time adjustment |
| Response Capability | Unable to respond to changing cellular demands | Automatically adjusts to physiological states |
| Implementation Complexity | Relatively simple genetic modifications | Complex circuit design requiring biosensors |
| Metabolic Impact | Often causes NADPH/NADP+ imbalance | Maintains better redox homeostasis |
| Therapeutic Precision | Limited, one-size-fits-all approach | High, can adapt to disease progression |
| Representative Methods | Overexpression of ppnK and zwf genes; Heterologous IDH expression | SoxR biosensor; NERNST biosensor; ED pathway cyclicity |
| Optimal Applications | Stable production environments; High-throughput screening | Complex disease contexts; Personalized medicine approaches |
Table 2: Quantitative Assessment of NADPH Regulation in Therapeutic Contexts
| Parameter | Antioxidant-Dominant Effect | Pro-Oxidant-Dominant Effect | Balanced Approach |
|---|---|---|---|
| NADPH/NADP+ Ratio | Increased | Decreased | Maintained within physiological range |
| ROS Levels | Reduced | Elevated | Context-dependent modulation |
| Cellular Outcome | Protection against oxidative stress | Induced oxidative damage to pathogens/cancer cells | Homeostatic maintenance |
| Therapeutic Examples | Neuroprotection; Cardiovascular protection | Antibacterial therapy; Cancer treatment | Metabolic disease management |
| PAB Index | Positive (Antioxidant > Pro-oxidant) | Negative (Pro-oxidant > Antioxidant) | Near zero (Balanced) |
| Representative Agents | Te bipenem (antibiotic with antioxidant dominance) | Fluoroquinolones, Beta-lactams | Doxycycline, Tigecycline, Rifampicin (mixed properties) |
Experimental Protocols for Assessing Pro-Oxidant/Antioxidant Balance
Simultaneous Microplate Assessment of Pro-Oxidant Antioxidant Balance Index (PABI)
Recent advancements enable simultaneous determination of antioxidant and pro-oxidant potential using a single microplate to evaluate the pro-oxidant antioxidant balance index (PABI) [57] [58]. This methodology provides a comprehensive assessment of redox properties particularly relevant for pharmaceutical compounds.
Materials and Reagents:
- 96-well microplates suitable for absorbance measurements
- 2,2-diphenyl-1-picrylhydrazyl (DPPH) radical solution
- FRAP (Ferric Reducing Antioxidant Power) working solution
- Test compounds (e.g., antibiotics, therapeutic agents)
- Phosphate buffered saline (PBS, pH 7.4)
- Standard curve references (Trolox for antioxidant capacity; FeSO₄ for pro-oxidant capacity)
- Microplate reader capable of measuring absorbance at 517nm (DPPH) and 593nm (FRAP)
Procedure:
- Prepare serial dilutions of test compounds in PBS or appropriate solvent
- For antioxidant activity (DPPH assay):
- Add 100μL of each sample to 100μL of DPPH solution (0.1mM in methanol)
- Incubate for 30 minutes in darkness at room temperature
- Measure absorbance at 517nm
- Calculate DPPH50 values (concentration causing 50% radical scavenging)
- For pro-oxidant activity (FRAP assay):
- Add 10μL of each sample to 190μL of FRAP working solution
- Incubate for 30 minutes at 37°C
- Measure absorbance at 593nm
- Calculate FRAP50 values (concentration causing 50% of maximum pro-oxidant activity)
- PABI Calculation:
- Determine PABI using the formula: PABI = (1/DPPH50) / (1/FRAP50)
- PABI > 1 indicates antioxidant-dominant effect
- PABI < 1 indicates pro-oxidant-dominant effect
This method has been successfully applied to evaluate 18 commonly prescribed antibiotics, revealing that tebipenem exhibits a dominant antioxidant effect (positive PABI), while fluoroquinolones and beta-lactams typically show pro-oxidant dominance, and antibiotics like doxycycline, tigecycline, and rifampicin demonstrate balanced dual activities [57] [58].
Genetically Encoded Biosensor Implementation for Dynamic Monitoring
The development of genetically encoded biosensors enables real-time monitoring of intracellular NADP(H) redox status, facilitating dynamic regulation strategies [37].
Materials and Reagents:
- Plasmid constructs containing biosensor elements (e.g., SoxR, roGFP2)
- NADPH thioredoxin reductase C module (for NERNST biosensor)
- Appropriate host cells (bacterial, yeast, mammalian depending on application)
- Culture media and transfection reagents
- Fluorescence microscopy or flow cytometry equipment
- Calibration standards for ratiometric measurements
Procedure:
- Biosensor Implementation:
- Transfect host cells with biosensor constructs using appropriate methods
- Select and expand successfully transfected populations
- Validate biosensor expression and functionality
- Dynamic Monitoring:
- Expose biosensor-equipped cells to experimental conditions
- Measure fluorescence signals at appropriate excitation/emission wavelengths
- For ratiometric sensors like NERNST, calculate ratio values
- Correlate fluorescence signals with NADPH/NADP+ ratios using calibration curves
- Intervention Adjustment:
- Use real-time biosensor data to inform therapeutic adjustments
- Implement feedback loops for automated regulation in advanced systems
- Correlate NADPH dynamics with functional outcomes
This approach allows researchers to move beyond static assessments to dynamic monitoring of redox status, enabling more precise interventions that can be adjusted according to temporal fluctuations in cellular redox demands.
Signaling Pathways in Redox Balance and Therapeutic Targeting
Figure 1: NADPH-Dependent Redox Signaling Pathways. This diagram illustrates the central role of NADPH in both ROS generation through NADPH oxidase (NOX) activation and antioxidant defense systems, leading to diverse cellular outcomes including oxidative damage, signaling responses, and functional adaptations.
The interplay between NADPH, reactive oxygen species (ROS), and cellular responses forms the foundation of redox-based therapeutic interventions. NADPH serves as the primary electron donor for NOX enzymes, which catalyze the reduction of molecular oxygen to superoxide anion (O₂•⁻) [56]. This ROS can be dismutated to hydrogen peroxide (H₂O₂), which functions as a signaling molecule at physiological levels but causes oxidative damage at elevated concentrations [56] [59].
The therapeutic targeting of these pathways involves either enhancing antioxidant defenses to protect against oxidative stress or selectively increasing pro-oxidant effects to eliminate pathological cells. For instance, in neurodegenerative diseases, excessive NOX activity contributes to oxidative neuronal damage, suggesting that NOX inhibition may be therapeutic [60]. Conversely, in antibacterial therapy, many antibiotics exert their bactericidal effects partly through pro-oxidant mechanisms that enhance ROS-mediated bacterial cell death [57] [58].
Experimental Workflow for Redox Balance Therapeutic Development
Figure 2: Therapeutic Development Workflow for Redox-Based Interventions. This diagram outlines the systematic approach from compound screening through PABI assessment, mechanism analysis, NADPH regulation studies, functional outcome evaluation, and eventual therapeutic application.
The experimental workflow for developing redox-based therapeutics involves sequential steps that progress from initial screening to mechanistic studies and functional validation. The PABI assessment serves as a crucial early-stage screening tool that efficiently characterizes the redox properties of therapeutic candidates [57] [58]. Compounds demonstrating promising PABI profiles then advance to more detailed mechanistic studies investigating their effects on NADPH regulation and downstream signaling pathways.
Dynamic monitoring using genetically encoded biosensors provides real-time insights into how interventions affect NADPH metabolism and redox homeostasis [37]. This approach is particularly valuable for identifying context-dependent effects and optimizing intervention timing. Functional outcomes are then correlated with redox modifications to establish therapeutic relevance, ultimately guiding clinical translation decisions based on comprehensive efficacy and safety profiles.
Research Reagent Solutions for Redox Balance Studies
Table 3: Essential Research Reagents for NADPH and Redox Balance Studies
| Reagent/Category | Specific Examples | Function/Application | Experimental Context |
|---|---|---|---|
| Biosensor Systems | SoxR biosensor; NERNST (roGFP2 + TrxR) | Real-time monitoring of NADPH/NADP+ ratio; Dynamic regulation | Live-cell imaging; Flow cytometry; Dynamic intervention studies |
| Antioxidant Assays | DPPH (2,2-diphenyl-1-picrylhydrazyl); ABTS; ORAC | Quantification of radical scavenging capacity; Antioxidant potential assessment | Compound screening; Structure-activity relationships |
| Pro-Oxidant Assays | FRAP (Ferric Reducing Antioxidant Power); Fenton reaction assays; Lipid peroxidation assays | Evaluation of pro-oxidant capacity; Oxidative stress induction potential | Antibiotic mechanism studies; Cancer therapeutic development |
| NADPH Regulators | Heterologous IDH (Isocitrate Dehydrogenase); Zwf overexpression constructs; NOX inhibitors | Modulation of NADPH availability; Genetic engineering of NADPH metabolism | Metabolic engineering; Pathway manipulation |
| Oxidative Stress Markers | Malondialdehyde (MDA); 4-hydroxynonenal (4-HNE); 8-OHdG | Biomarkers of lipid peroxidation; DNA oxidation | Assessment of oxidative damage; Therapeutic efficacy evaluation |
| Enzymatic Antioxidants | Superoxide Dismutase (SOD); Catalase; Glutathione Peroxidase | Endogenous antioxidant defense; Reference standards | Pathway analysis; Enzyme activity normalization |
This comprehensive toolkit enables researchers to systematically investigate both static and dynamic aspects of NADPH regulation and its therapeutic implications. The combination of these reagents and methodologies facilitates a thorough understanding of how interventions affect the pro-oxidant-antioxidant balance through NADPH-mediated pathways.
The strategic balance between antioxidant and pro-oxidant therapeutic effects requires careful consideration of NADPH regulation mechanisms. Static approaches, while simpler to implement, often lack the temporal precision needed for optimal therapeutic outcomes in dynamic disease contexts. Dynamic regulation strategies, particularly those incorporating biosensor-enabled real-time monitoring, offer enhanced precision but present greater implementation challenges.
The emerging evidence that certain therapeutic agents, including various antibiotics, possess inherent redox-modifying properties [57] [58] suggests that systematic assessment of PABI should be incorporated early in drug development pipelines. Furthermore, the recognition that physiological ROS levels play important signaling roles in processes such as pancreatic β-cell differentiation [61] highlights the importance of context-dependent modulation rather than blanket antioxidant approaches.
Future therapeutic development should prioritize strategies that can dynamically adapt to changing redox requirements throughout disease progression, potentially through smart systems that respond to biomarkers of oxidative status. The integration of NADPH regulation strategies with other therapeutic modalities holds promise for enhanced efficacy across diverse pathological conditions, from infectious diseases to neurodegeneration and metabolic disorders.
Reduced nicotinamide adenine dinucleotide phosphate (NADPH) serves as an essential electron donor in all living cells, playing indispensable roles in reductive biosynthesis, redox defense, and cellular signaling [6]. Unlike its counterpart NADH, which primarily fuels catabolic processes, NADPH is predominantly utilized in anabolic reactions and antioxidant systems, making it particularly crucial for rapidly proliferating cells and stress responses. The intracellular landscape of NADPH metabolism is characterized by profound compartmental complexity, with independent regulatory mechanisms governing NADPH pools in distinct subcellular locations such as the cytosol, mitochondria, and other membrane-bound organelles [6]. This compartmentalization creates both challenges and opportunities for therapeutic and biotechnological interventions, as dysregulation of specific NADPH pools has been implicated in conditions ranging from vascular aging and cancer to metabolic disorders [6] [62].
The impermeability of biological membranes to pyridine nucleotides necessitates that each compartment maintains its own NADPH homeostasis through localized synthesis and consumption [63]. This review provides a comprehensive comparison of static versus dynamic strategies for targeting specific subcellular NADPH pools, synthesizing recent advances in biosensor technologies, metabolic engineering approaches, and therapeutic applications. By examining experimental data across diverse biological systems—from microbial factories to mammalian cells—we aim to equip researchers with the methodological framework necessary to navigate and manipulate the intricate geography of intracellular NADPH metabolism.
Compartmentalized NADPH Metabolism: A Fundamental Biological Challenge
Independent Regulation of NADPH Pools
A fundamental characteristic of cellular NADPH metabolism is the independent regulation of NADPH pools in different subcellular compartments. Research using genetically encoded fluorescent indicators has demonstrated that cytosolic and mitochondrial NADPH pools are regulated separately and can respond differently to physiological stimuli and stress conditions [6]. For instance, during endothelial cell senescence, cytosolic NADPH levels increase significantly while mitochondrial NADPH remains largely unchanged [6]. This compartment-specific regulation underscores the necessity for targeted manipulation strategies rather than global NADPH modulation.
The mitochondrial NADPH pool is particularly crucial for specialized functions including proline biosynthesis, mitochondrial fatty acid synthesis (mtFAS), and ROS detoxification systems unique to the organelle [63]. Mitochondria maintain their NADPH primarily through the action of NADK2, which phosphorylates NAD+ to generate NADP+, and several NADP+-reducing enzymes including nicotinamide nucleotide transhydrogenase (NNT), isocitrate dehydrogenase 2 (IDH2), and malic enzyme 2 (ME2) [63]. The distinct roles and regulation of these compartmentalized pools mean that manipulation of specific NADPH subsystems requires precise tools and approaches.
Analytical Challenges in Compartment-Specific NADPH Monitoring
Accurately measuring subcellular NADPH dynamics has presented significant technical challenges. Traditional methods like enzymatic cycling assays and chromatography require cell homogenization, thereby losing all spatial information [6]. The development of genetically encoded biosensors has revolutionized our ability to monitor compartment-specific NADPH dynamics in live cells. The recent introduction of the NAPstar family of biosensors represents a particular advance, enabling real-time, specific measurements of NADPH/NADP+ ratios across a broad range of redox states with subcellular resolution [25]. These sensors have revealed a conserved robustness of cytosolic NADP redox homeostasis across eukaryotic species and have uncovered dynamic processes such as cell cycle-linked NADP redox oscillations in yeast [25].
Table 1: Key Genetically Encoded NADPH Biosensors
| Sensor Name | Target Readout | Key Features | Limitations | Applications |
|---|---|---|---|---|
| iNap1 | NADPH concentration | High responsiveness to NADPH; subcellular targetable | Does not report NADP+; may be affected by sensor concentration | Monitoring NADPH in cytosol and mitochondria [6] |
| NAPstars | NADPH/NADP+ ratio | Broad dynamic range (0.001-5); compatible with FLIM; subcellular targetable | Some variants show pool size dependence | Real-time monitoring of NADP redox states in yeast, plants, mammalian cells [25] |
| NERNST | NADPH/NADP+ ratio | Based on roGFP2 and NADPH thioredoxin reductase | Potential specificity issues due to glutathione coupling | NADP(H) redox status assessment in multiple organisms [5] |
Static Regulation Strategies: Traditional Approaches and Limitations
Static regulation strategies for manipulating NADPH pools involve persistent genetic or enzymatic modifications that alter the flux through NADPH-producing or consuming pathways. These approaches have formed the backbone of metabolic engineering efforts aimed at enhancing NADPH-dependent biotransformations and product synthesis.
Key Static Approaches and Their Applications
Static regulation primarily encompasses several core strategies: promoter and RBS engineering to precisely regulate the expression of NADP(H)-dependent enzymes; protein engineering to modify the cofactor preference of dependent enzymes; endogenous cofactor engineering to control genes involved in NADPH consumption and regeneration; heterologous cofactor engineering to supplement NADPH regeneration systems; and external methods using chemical catalysts for NADPH regeneration [5]. These approaches have demonstrated significant success in various biotechnological applications.
In industrial microbiology, static approaches have been extensively applied to optimize production of NADPH-intensive compounds. For example, in L-threonine production in E. coli, implementation of a "open source and reduce expenditure" strategy involving expression of cofactor-converting enzymes, heterologous cofactor-dependent enzymes, enzymes in NADPH synthesis pathways, and knocking down non-essential NADPH-consuming genes successfully increased NADPH availability and drove production to 117.65 g/L [64]. Similarly, static modulation of the oxidative pentose phosphate pathway (oxPPP) through overexpression of glucose-6-phosphate dehydrogenase (G6PD) has been shown to alleviate vascular aging in model systems, highlighting the therapeutic potential of these approaches [6].
Table 2: Comparison of Static Regulation Strategies for NADPH Pools
| Strategy | Key Methodologies | Advantages | Limitations | Representative Outcomes |
|---|---|---|---|---|
| Promoter/RBS Engineering | Replacement with stronger/weaker promoters; RBS optimization | Precise control of enzyme expression levels; well-established tools | Limited dynamic range; cannot respond to changing conditions | Increased carbon flux to PPP; enhanced NADPH regeneration [5] |
| Protein Engineering | Directed evolution; rational design to change cofactor specificity | Can fundamentally alter pathway kinetics; potentially permanent solution | Technically challenging; may affect enzyme stability or activity | Switching NADH-dependent enzymes to NADPH-dependent versions [5] |
| Heterologous Expression | Introduction of foreign NADPH-generating enzymes | Access to novel catalytic activities; bypass regulatory mechanisms | May burden cellular resources; potential compatibility issues | Expression of Corynebacterium IDH in E. coli enhanced NADPH supply [5] |
| Pathway Modulation | Overexpression of G6PD, PGD, MTHFD | Increases NADPH production capacity; can be targeted to specific compartments | May cause redox imbalance; metabolic burden | G6PD overexpression alleviated vascular aging in mice [6] |
Limitations of Static Approaches
Despite their widespread application, static regulation strategies face fundamental limitations. Most significantly, they lack dynamic responsiveness to changing metabolic demands and cannot adjust intracellular NADPH levels in real-time [5]. This inflexibility often leads to NADPH/NADP+ imbalance, which can disrupt cell growth and ultimately limit production yields [5] [65]. Additionally, static modifications often impose a constant metabolic burden on the host, potentially reducing fitness and productivity in long-term cultures or industrial-scale fermentations.
The failure of static approaches to account for compartmentalization represents another critical limitation. Global overexpression of NADPH-generating enzymes may not effectively target the specific subcellular pool that limits a particular process of interest. For instance, promoting cytosolic NADPH generation may not address mitochondrial NADPH deficits, and vice versa, due to the impermeability of cellular membranes to these cofactors [63].
Dynamic Regulation Strategies: Advanced Approaches for Precision Manipulation
Dynamic regulation strategies aim to sense and modulate NADPH levels in real-time, allowing cells to maintain redox balance while optimizing production of target compounds. These approaches typically employ biosensor-mediated feedback loops or external control systems that adjust metabolic flux in response to changing NADPH demands.
Biosensor-Enabled Dynamic Control
The development of genetically encoded NADPH biosensors has enabled sophisticated dynamic control strategies. These systems typically couple an NADPH-sensing element (such as the transcription factor SoxR or the NERNST biosensor) to regulatory circuits that control expression of NADPH-metabolizing enzymes [5]. In one exemplary application, researchers developed a NADPH and L-threonine dual-sensing biosensor that was combined with fluorescence-activated cell sorting (FACS) to rapidly screen for high-producing strains, resulting in an L-threonine yield of 0.65 g/g [64].
A particularly innovative approach termed Redox Imbalance Forces Drive (RIFD) strategically creates controlled NADPH excess through "open source and reduce expenditure" principles, then harnesses this imbalance to drive metabolic flux toward desired products [64]. This strategy acknowledges that optimal NADPH levels for maximal production may not coincide with physiological setpoints, and deliberately creates then resolves imbalance to enhance yields.
Two-Stage Dynamic Metabolic Control
The implementation of two-stage dynamic metabolic control (DMC) systems represents a sophisticated approach for balancing growth and production phases in industrial bioprocesses [51]. These systems typically utilize controlled proteolysis (using DAS+4 tags and ClpXP protease) and CRISPR interference to dynamically redirect metabolic flux after sufficient biomass accumulation. In one striking example, application of two-stage DMC to xylitol production in E. coli resulted in a 90-fold improvement in yield and titers reaching 200 g/L [51].
The key insight from this work was that improved NADPH fluxes could be achieved through a unique metabolic state involving: (1) reduced glucose-6-phosphate dehydrogenase activity (paradoxically lowering NADPH pools), (2) increased pyruvate ferredoxin oxidoreductase activity enhancing acetyl-CoA flux and NADPH production, and (3) disruption of fatty acid biosynthesis to alleviate inhibition of membrane-bound transhydrogenase (PntAB) [51]. This combination successfully increased NADPH flux despite reduced NADPH pools, highlighting the complex relationship between pool size and flux.
Diagram 1: Two-stage dynamic metabolic control workflow for NADPH optimization. This approach separates growth and production phases, using inducible proteolysis and CRISPRi to redirect NADPH flux after sufficient biomass accumulation.
Direct Comparison: Static vs. Dynamic Regulation Performance
To objectively evaluate the efficacy of static versus dynamic regulation strategies, we analyzed comparative performance data across multiple experimental systems. The results demonstrate clear advantages for dynamic approaches in optimizing NADPH-dependent processes.
Table 3: Performance Comparison of Static vs. Dynamic NADPH Regulation Strategies
| Strategy | System/Organism | Target Product | Key Performance Metrics | Compartment Targeted |
|---|---|---|---|---|
| Static: G6PD Overexpression | Endothelial cells | Protection from senescence | Increased cytosolic NADPH; reduced aging markers | Cytosol [6] |
| Static: "Open Source" Approach | E. coli | L-threonine | 117.65 g/L titer; 0.65 g/g yield | Global [64] |
| Dynamic: Two-Stage DMC | E. coli | Xylitol | 200 g/L titer; 90-fold improvement; 86% theoretical yield | Global [51] |
| Dynamic: RIFD Strategy | E. coli | L-threonine | Significant yield improvement vs. static approaches | Global [64] |
The performance advantages of dynamic regulation are particularly evident in the direct comparison of static and dynamic approaches applied to similar systems. In xylitol production, the dynamic approach achieved a 90-fold improvement compared to a 20-fold improvement from a stoichiometric (static) approach [51]. Similarly, in L-threonine production, the incorporation of dynamic biosensor-mediated screening significantly enhanced yields beyond what was achievable through static modifications alone [64].
Experimental Protocols for Key Methodologies
Real-Time Monitoring of Subcellular NADPH Using Genetically Encoded Sensors
The implementation of genetically encoded NADPH biosensors represents a fundamental methodology for both basic research and metabolic engineering applications. The following protocol outlines the key steps for monitoring compartment-specific NADPH dynamics:
Sensor Selection and Expression: Select appropriate biosensor (iNap, NAPstar, etc.) based on target compartment and required dynamic range. For cytosolic measurements, use cyto-iNap1 or NAPstar-localized to cytosol; for mitochondrial measurements, use mito-iNap3 or mitochondria-targeted NAPstar [6] [25].
Cell Preparation and Transformation: Introduce sensor plasmid into target cells using appropriate transformation method (electroporation for bacteria, transfection for mammalian cells). Generate stable cell lines if long-term studies are planned.
Calibration and Validation: Perform in situ calibration using digitonin permeabilization (0.001% for plasma membrane, 0.3% for mitochondrial membrane) and sequential NADPH additions. Validate specificity using oxidants (diamide) and inhibitors [6].
Live-Cell Imaging: Culture sensor-expressing cells under appropriate conditions. For fluorescence measurements, excite at 405/420 nm and 488/485 nm, collect emission at appropriate wavelengths (515 nm for TS, 610 nm for mCherry). Calculate ratio (405/488 or 420/485) to determine NADPH level [6] [25].
Data Analysis: Normalize fluorescence ratios to control conditions. For NAPstars, use TS/mC ratio to determine NADPH/NADP+ ratio based on pre-established calibration curves [25].
Implementing Two-Stage Dynamic Metabolic Control
The application of two-stage DMC requires careful assembly of genetic components and controlled fermentation conditions:
Strain Engineering: Start with optimized genetic background (e.g., E. coli DLF_Z0025). Delete native sspB and cas3 nuclease. Replace with phosphate-inducible sspB allele and constitutive Cascade operon expression [51].
Valve Construction: Design metabolic valves combining controlled proteolysis (DAS+4 tags) and CRISPRi for target genes. For NADPH optimization, target combinations might include zwf (G6PD), fabI (enoyl-ACP reductase), and competing NADPH consumers [51].
Two-Stage Fermentation:
- Stage 1 (Growth): Cultivate in phosphate-replete media to allow biomass accumulation.
- Stage 2 (Production): Trigger phosphate depletion to induce proteolysis (via SspB expression) and CRISPRi-mediated silencing of target genes [51].
Monitoring and Optimization: Track NADPH flux using biosensors or metabolomics. Optimize induction timing based on growth curves and product formation.
Table 4: Essential Research Reagents for Studying Subcellular NADPH Pools
| Reagent/Resource | Type | Key Function | Example Applications | Commercial Sources/References |
|---|---|---|---|---|
| iNap biosensors | Genetically encoded sensor | Monitoring NADPH concentration in specific compartments | Real-time tracking of cytosolic/mitochondrial NADPH in live cells [6] | Available from academic developers; Addgene |
| NAPstar biosensors | Genetically encoded sensor | Measuring NADPH/NADP+ ratio with subcellular resolution | Monitoring NADP redox dynamics across eukaryotes [25] | Available from academic developers |
| Nicotinamide Riboside (NR) | Chemical precursor | Increasing NAD(H) pool size via salvage pathway | Testing effect of increased NAD(H) on NADPH pools [66] | Sigma-Aldrich, Cayman Chemical |
| FK866 | Small molecule inhibitor | Inhibiting NAMPT to decrease NAD(H) pool | Testing NADPH dependency in cancer cells [66] [62] | Tocris, Selleck Chemicals |
| Digitonin | Chemical | Selective membrane permeabilization | Calibrating compartment-specific biosensors [6] | Sigma-Aldrich, Millipore |
| DAS+4 tags | Genetic element | Targeted protein degradation in dynamic control | Implementing controlled proteolysis in two-stage DMC [51] | Custom synthesis |
| CRISPRi system | Genetic tool | Gene silencing in dynamic regulation | Tunable downregulation of competing pathways [51] | Addgene, commercial kits |
Pathway Integration and Future Directions
The manipulation of subcellular NADPH pools requires understanding of the complex metabolic networks that connect different cellular compartments. The following diagram integrates key NADPH metabolism pathways and their compartmentalization:
Diagram 2: Compartmentalized NADPH metabolism in mammalian cells. Key NADPH-producing enzymes (highlighted in yellow) and major NADPH-consuming processes (ellipses) are shown for cytosol and mitochondria, demonstrating the independent yet interconnected nature of these systems.
Future directions in subcellular NADPH targeting will likely focus on increasing specificity and temporal control. The development of optogenetic tools for light-controlled NADPH manipulation represents a promising frontier, as does the engineering of orthogonal NADPH systems that operate independently from endogenous metabolism. Additionally, the application of machine learning to predict compartment-specific metabolic fluxes may help guide more rational design of intervention strategies.
The integration of dynamic regulation with compartment-targeted approaches will be essential for advancing both fundamental understanding and applied biotechnology. As biosensor technology continues to improve, particularly with the advent of fluorescence lifetime imaging microscopy (FLIM)-compatible sensors like NAPstars, researchers will gain increasingly precise insights into the spatial and temporal dynamics of NADPH metabolism [66] [25]. These advances will undoubtedly yield new strategies for overcoming the challenges posed by compartmental complexity in NADPH regulation.
G6PD and MTHFD1 represent two distinct NADPH-regulating enzymatic targets with significant potential for modulating vascular aging processes. This comparative analysis examines static versus dynamic regulation strategies for these targets, providing experimental data and troubleshooting guidance for research applications. The contrasting approaches demonstrate how traditional overexpression methods compare with novel biosensor-enabled dynamic systems for maintaining NADPH homeostasis in aging vasculature.
Nicotinamide adenine dinucleotide phosphate (NADPH) serves as a crucial redox cofactor in endothelial cells, with declining levels closely associated with vascular aging processes [16]. The balance between NADPH and reactive oxygen species (ROS) represents a critical factor in endothelial cell senescence, with NADPH oxidase activity significantly increased in senescent cells [6]. Two primary enzymatic pathways—glucose-6-phosphate dehydrogenase (G6PD) in the oxidative pentose phosphate pathway and methylenetetrahydrofolate dehydrogenase (MTHFD1) in folate metabolism—have emerged as key regulators of NADPH generation in vascular contexts [6]. Understanding the differential modulation of these targets through static versus dynamic regulation strategies provides critical insights for developing effective interventions against age-related cardiovascular pathologies.
Target Comparison: G6PD vs. MTHFD1 in Vascular Aging Models
Table 1: Comparative Analysis of G6PD and MTHFD1 Targets in Vascular Aging
| Parameter | G6PD (oxPPP Pathway) | MTHFD1 (Folate Metabolism) |
|---|---|---|
| Primary Function | Rate-limiting step in oxidative pentose phosphate pathway | Catalyzes folate-mediated NADPH generation |
| NADPH Generation Mechanism | Direct reduction of NADP+ during glucose-6-phosphate oxidation | Indirect generation via folate cycle metabolism |
| Subcellular Localization | Cytosolic [6] | Cytosolic [6] |
| Aging-Associated Expression | Increased activity during EC senescence [6] | Target for pharmacological augmentation (folic acid) [6] |
| Regulatory Mechanisms | S-nitrosylation at C385 decreases activity; de-S-nitrosylation increases activity [6] | Upregulated by folic acid supplementation [6] |
| Genetic Modulation Effects | Overexpression alleviates, knockdown aggravates vascular aging [6] | Identified through drug screening; essential for folic acid benefits [6] |
| Therapeutic Modulation | Gene therapy approaches; activity regulation | Small molecule (folic acid) intervention [6] |
| Downstream Pathways | Glutathione reduction, HDAC3 inhibition [6] | Increased NADPH generation via folate cycle [6] |
Experimental Models and Methodologies
In Vitro Endothelial Cell Senescence Models
Primary Cell Culture: Human aortic endothelial cells (HAECs) serve as the primary model system for vascular aging studies. Cells are typically maintained in endothelial growth medium-2 with standard supplements and used between passages 4-6 for aging studies [6].
Senescence Induction Protocols:
- Angiotensin II Model: 2 μM Ang II treatment for 72 hours effectively induces senescence, confirmed by increased β-galactosidase staining, elevated p16/p21 protein levels, and SASP factor expression (IL-1β, IL-6, IL-8, CXCL1) [6].
- Replicative Senescence: Extended passaging until proliferation cessation (typically 12-15 passages) [6].
- Alternative Inducers: High glucose (25 mM, 48h), endothelin-1 (10 nM, 48h), or homocysteine (50 μM, 72h) provide additional senescence models [6].
Senescence Validation Methods:
- SA-β-gal staining at pH 6.0
- Western blotting for p16, p21, and VCAM-1
- qPCR for SASP factors (IL-1β, IL-6, IL-8, CXCL1)
- Cell cycle analysis via flow cytometry
NADPH Monitoring Techniques
Genetically Encoded Biosensors:
- iNap1 Implementation: The iNap1 sensor enables compartment-specific NADPH monitoring when targeted to cytosol (cyto-iNap1) or mitochondria (mito-iNap3). Confocal imaging with excitation at 405/420 nm and 488/485 nm provides ratio metric measurements (405/488 or 420/485) that reflect NADPH concentrations [6].
- Calibration Protocol: Permeabilize plasma membrane (0.001% digitonin) or mitochondrial inner membrane (0.3% digitonin), then expose to increasing NADPH concentrations for linear response verification [6].
- SoNar for NAD+/NADH: Parallel monitoring of NADH/NAD+ ratios using cyto-SoNar and mito-SoNar indicators with cpYFP controls [6].
Traditional Biochemical Assays:
- Enzymatic cycling assays using homogenized cells
- Mass spectrometry-based quantification
- HPLC separation methods
Table 2: NADPH Monitoring Techniques Comparison
| Method | Spatial Resolution | Temporal Resolution | Throughput | Key Applications |
|---|---|---|---|---|
| iNap1 Biosensor | Subcellular compartment specificity | Real-time monitoring | High (suitable for HTS) | Live-cell dynamics, drug screening [6] |
| SoNar Biosensor | Subcellular compartment specificity | Real-time monitoring | Medium | NAD+/NADH redox status [6] |
| Enzymatic Cycling | Whole-cell homogenates | Endpoint measurements | Low | Absolute quantification |
| Mass Spectrometry | Crude subcellular fractions | Endpoint measurements | Low | Isotopic tracing, absolute quantification |
| HPLC | Whole-cell extracts | Endpoint measurements | Low | Nucleotide separation |
In Vivo Vascular Aging Models
Naturally Aged Mice: Comparative studies between young (4 months) and old (18-24 months) mice provide physiological aging context. Isolated ECs from thoracic aorta show elevated cytosolic NADPH in aged animals [6].
Angiotensin II-Infused Mice: Continuous Ang II infusion models accelerate vascular aging processes, permitting therapeutic intervention studies within compressed timelines [6].
Assessment Endpoints:
- Vascular reactivity measurements (wire/myograph systems)
- Histological analysis of vessel architecture
- NADPH quantification in isolated aortic ECs
- Expression profiling of aging markers
Static Regulation Strategies: Experimental Data
G6PD Modulation Approaches
Overexpression Protocols:
- Vector Design: Lentiviral constructs containing human G6PD cDNA with constitutive (CMV) or endothelial-specific (VECAD) promoters.
- Transduction: MOI 10-20 for 24-48 hours followed by puromycin selection (2 μg/mL, 72 hours).
- Functional Outcomes: G6PD overexpression significantly elevated cytosolic NADPH, inhibited glutathione oxidation and HDAC3 activity, and suppressed EC senescence and vascular aging [6].
Knockdown Approaches:
- shRNA Design: 3-5 unique targets against human G6PD with non-targeting scrambled controls.
- Transduction: Lentiviral delivery with GFP reporters for efficiency monitoring.
- Validation: Western blotting and enzymatic activity assays (NADPH generation measured spectrophotometrically at 340 nm).
- Phenotypic Effects: G6PD knockdown aggravated vascular aging phenotypes, confirming its protective role [6].
Pharmacological Modulation:
- Activity Regulators: Although no direct G6PD activators were identified in the search results, the S-nitrosylation status at C385 represents a key regulatory mechanism that potentiates activity when suppressed [6].
MTHFD1/Folate Pathway Modulation
Folic Acid Intervention:
- Screening Origin: Identified through high-throughput screening of 1419 FDA-approved drugs using iNap1 biosensor for NADPH elevation [6].
- Mechanism: Folic acid metabolism catalyzed by MTHFD1 generates NADPH, effectively alleviating vascular aging in model systems [6].
- In Vivo Efficacy: Demonstrated benefits in both angiotensin II-infused mice and naturally aged mice [6].
Experimental Dosing:
- In Vitro: 10-100 μM folic acid in cell culture media
- In Vivo: Standard supplementation in drinking water or chow (typical rodent doses 5-10 mg/kg/day)
Comparative Efficacy of Static Modulation
Table 3: Static Regulation Outcomes for G6PD and MTHFD1 Pathways
| Intervention | NADPH Impact | Senescence Markers | Vascular Function | Key Mechanisms |
|---|---|---|---|---|
| G6PD Overexpression | ↑↑ Cytosolic NADPH [6] | ↓ p16/p21, ↓ SASP factors [6] | Improved endothelial function | GSH maintenance, HDAC3 inhibition [6] |
| G6PD Knockdown | ↓↓ Cytosolic NADPH [6] | ↑ p16/p21, ↑ SASP factors [6] | Impaired endothelial function | Increased oxidative stress, glutathione depletion |
| Folic Acid (MTHFD1) | ↑ Cytosolic NADPH [6] | ↓ Senescence markers | Improved vascular activity in aged mice [6] | Folate cycle flux, NADPH generation [6] |
| G6PD S-nitrosylation (C385) | Activity potentiated when suppressed [6] | Not specifically reported | Not specifically reported | Direct enzyme activity regulation |
Dynamic Regulation Strategies: Emerging Approaches
NADPH Biosensor-Enabled Systems
Biosensor Platforms:
- iNap1 Applications: Enabled high-throughput drug screening (1419 FDA compounds) leading to folic acid discovery [6].
- SoxR Biosensor: E. coli-derived transcription factor biosensor specifically responsive to NADPH/NADP+ ratios [37].
- NERNST Biosensor: Ratiometric biosensor combining roGFP2 with NADPH thioredoxin reductase C module for NADP(H) redox status monitoring across organisms [37].
Dynamic Regulation Circuits:
- Closed-Loop Systems: Integration of biosensors with gene expression circuits for real-time NADPH homeostasis maintenance.
- Application Gaps: While proven in metabolic engineering for compound production [48], dynamic NADPH regulation specific to vascular aging models remains underdeveloped.
AI-Enhanced Dynamic Control
Framework Components:
- BPNN Kinetic Modeling: Captures nonlinear correlations between metabolic rates (R² > 0.95) [48].
- Multi-Objective Optimization: NSGA-II algorithm resolves phase-specific metabolic trade-offs [48].
- Dual-Spectroscopy Monitoring: NIR and Raman spectroscopy enable real-time metabolic tracking [48].
- Closed-Loop Feedback: Dynamic coordination of carbon, nitrogen, and oxygen supplementation [48].
Performance Outcomes: In bioproduction contexts, AI-driven regulation enabled 75.7% productivity improvement with metabolic flux reorganization toward NADPH generation [48].
Troubleshooting Guide: Common Experimental Challenges
G6PD-Specific Technical Issues
Variable Activity Measurements:
- Problem: Inconsistent G6PD enzymatic activity despite uniform genetic manipulation.
- Solution: Control for S-nitrosylation status using C385 mutants; include NO donors/scavengers in experimental design.
- Prevention: Standardize culture conditions (redox status, passage number) and implement rapid processing protocols.
Compartment-Specific Effects:
- Problem: Whole-cell NADPH measurements mask cytosolic-specific changes.
- Solution: Implement compartment-targeted iNap sensors (cyto-iNap1 vs mito-iNap3) [6].
- Validation: Use digitonin permeabilization with sequential NADPH titration for compartment-specific calibration [6].
MTHFD1/Folate Pathway Considerations
Nutrient Interference:
- Problem: Media folate content confounds intervention effects.
- Solution: Use defined, low-folate basal media with precise folic acid supplementation.
- Standardization: Pre-screen serum batches for folate content or use serum-free conditions.
Pathway Cross-Talk:
- Problem: Folate cycle intermediates influence nucleotide synthesis, confounding senescence outcomes.
- Solution: Implement isotopomer flux analysis to distinguish NADPH generation from nucleotide synthesis fluxes.
- Controls: Include nucleotide supplementation controls to isolate NADPH-specific effects.
General NADPH Methodology Concerns
Biosensor Limitations:
- Problem: iNap responsiveness varies between cell types and compartments.
- Solution: Perform in situ calibration for each experimental system using digitonin permeabilization and NADPH titration [6].
- Validation: Confirm specificity with oxidant challenges (diamide) and non-responsive controls (iNapc) [6].
Senescence Model Validation:
- Problem: Incomplete senescence induction leads to variable results.
- Solution: Implement multiple validation methods (β-galactosidase, p16/p21, SASP factors) across timepoints [6].
- Optimization: Conduct dose-response and time-course studies for each senescence inducer [6].
Pathway Diagrams and Experimental Workflows
G6PD/NADPH Signaling in Vascular Aging
Diagram 1: G6PD/NADPH Signaling Pathway in Vascular Aging
Experimental Workflow for NADPH Modulation Studies
Diagram 2: Experimental Workflow for NADPH Modulation Studies
The Scientist's Toolkit: Essential Research Reagents
Table 4: Key Research Reagents for G6PD/MTHFD1 Vascular Aging Studies
| Reagent/Category | Specific Examples | Function/Application | Experimental Notes |
|---|---|---|---|
| NADPH Biosensors | iNap1 (cyto/mito-targeted), iNapc (control) [6] | Live-cell NADPH monitoring | Require in situ calibration; 405/488 nm ratio imaging |
| NAD+/NADH Sensors | SoNar, cpYFP (control) [6] | NADH/NAD+ ratio monitoring | Complementary to NADPH measurements |
| Senescence Inducers | Angiotensin II (2μM), High Glucose (25mM) [6] | Establish aging models | Validate with multiple markers; optimize dose/timing |
| G6PD Modulators | Overexpression vectors, shRNAs, S-nitrosylation mutants [6] | Targeted pathway manipulation | Monitor compartment-specific effects |
| MTHFD1 Modulators | Folic acid, MTHFD1 expression constructs [6] | Folate pathway activation | Control for media folate content |
| Validation Tools | SA-β-gal assay, p16/p21 antibodies, SASP qPCR panels [6] | Senescence confirmation | Implement multiple complementary methods |
| Dynamic Regulation | SoxR, NERNST biosensors [37] | Real-time NADPH monitoring | Enable closed-loop control systems |
The comparative analysis of G6PD and MTHFD1 modulation reveals distinct advantages and limitations for each target within vascular aging contexts. Static regulation approaches demonstrate efficacy but lack the dynamic responsiveness required for optimal NADPH homeostasis maintenance. Emerging biosensor technologies and AI-driven control systems represent promising future directions for precise NADPH regulation, potentially overcoming the limitations of traditional static approaches.
Future research priorities should include:
- Development of endothelial-optimized dynamic regulation circuits
- Clinical translation of folate pathway modulation
- Integration of multi-omics approaches for comprehensive pathway mapping
- Advanced delivery systems for spatial-temporal control of modulation
The strategic selection between G6PD and MTHFD1 targets, combined with appropriate regulation strategies (static vs. dynamic), will significantly advance therapeutic development for vascular aging interventions.
Validating Strategies: A Comparative Analysis of Static and Dynamic Approaches
In the field of metabolic engineering, particularly in the regulation of essential cofactors like nicotinamide adenine dinucleotide phosphate (NADPH), researchers must strategically choose between static and dynamic control strategies. Static regulation involves permanent, pre-programmed genetic modifications implemented during the design phase, while dynamic regulation enables real-time, adaptive cellular control in response to changing metabolic conditions. The selection between these approaches significantly impacts the success of biotransformation processes, cellular health, and the production of high-value chemicals. This guide provides an objective comparison of these methodologies, supported by experimental data, to inform researchers, scientists, and drug development professionals in selecting the optimal strategy for their specific applications.
Core Conceptual Differences: Static vs. Dynamic Regulation
Static and dynamic regulation strategies operate on fundamentally different principles and timing within the research and development workflow. Understanding these core differences is essential for appropriate method selection.
- Static Regulation involves one-time, constitutive genetic modifications. Examples include overexpressing endogenous genes (like ppnK or zwf), introducing heterologous enzymes, or knocking out competing pathways. These changes are fixed and remain constant throughout the cellular lifecycle [5].
- Dynamic Regulation creates feedback-controlled systems that automatically adjust metabolic fluxes. This is often achieved using genetically encoded biosensors that monitor intracellular metabolite levels, such as the NADPH/NADP+ ratio, and subsequently regulate gene expression to maintain homeostasis [5].
The table below summarizes the key conceptual distinctions:
| Feature | Static Regulation | Dynamic Regulation |
|---|---|---|
| Timing of Intervention | During genetic design/construction phase [5] | During runtime/cultivation process [5] |
| Core Principle | Permanent, pre-programmed genetic modification [5] | Real-time, feedback-driven metabolic control [5] |
| Response to Change | Fixed; cannot adapt to dynamic intracellular demands [5] | Adaptive; responds to real-time metabolite levels [5] |
| Key Tools | Promoter/RBS engineering, gene knockout, heterologous expression [5] | Genetically encoded biosensors (e.g., SoxR, NERNST, iNap1) [5] [6] |
| Ideal Application Phase | Early-stage proof-of-concept, well-understood pathways [5] | Complex processes with varying metabolic demands, scalable production [5] |
Comparative Analysis: Strengths, Weaknesses, and Experimental Evidence
A critical evaluation of both strategies, supported by experimental data, reveals a clear trade-off between control complexity and metabolic robustness.
| Aspect | Static Regulation | Dynamic Regulation |
|---|---|---|
| Implementation Complexity | Lower; relies on standard genetic tools [5] | Higher; requires biosensor engineering and circuit optimization [5] |
| Metabolic Burden | Can be high due to constitutive protein expression [5] | Potentially lower; resource usage is demand-driven [5] |
| Risk of Redox Imbalance | High; fixed expression often disrupts NADPH/NADP+ balance, harming cell growth [5] | Low; dynamically maintains redox homeostasis [5] |
| Ability to Prevent "Turbo" Pathology | Limited; can overwhelm downstream pathways [5] | High; can automatically downregulate flux to prevent toxicity [5] |
| Titer, Rate, and Yield (TRY) | Can be high initially but often at the cost of cell fitness [5] | Can optimize for integrated, long-term performance and stability [5] |
Key Experimental Findings
- Static Regulation Success and Limitations: A classic example is the work by Li et al. to enhance poly-3-hydroxybutyrate (PHB) production. By statically overexpressing the endogenous genes ppnK (encoding a NAD kinase) and zwf (encoding glucose-6-phosphate dehydrogenase), researchers successfully increased NADPH supply and flux toward the PHB biosynthesis pathway [5]. While effective in boosting product formation, such approaches often lead to NADPH/NADP+ imbalance, which can disrupt central carbon metabolism and impair cell growth [5].
- Dynamic Regulation for Homeostasis: To address the limitations of static control, Pamela et al. developed the NERNST biosensor. This ratiometric tool, based on a redox-sensitive green fluorescent protein (roGFP2) and an NADPH thioredoxin reductase C module, allows for real-time monitoring of the NADPH/NADP+ balance in living cells [5]. This capability provides the foundation for dynamic feedback loops that can maintain redox homeostasis, a feat unachievable with static methods alone.
Decision Framework: Selecting the Appropriate Method
The choice between static and dynamic regulation is not one of superiority but of context. The following framework, based on project goals and constraints, guides this critical decision.
When to Prefer Static Regulation
- Early-Stage Pathway Validation: When establishing a new biosynthetic pathway, static overexpression is a straightforward method to test for flux sufficiency and prove concept viability [5].
- Well-Characterized, Stable Processes: For processes where metabolic demands are consistent throughout the fermentation and are well-understood, the simplicity of static regulation is advantageous [5].
- Resource-Limited Projects: When project timelines or expertise in synthetic biology and dynamic circuit design are limited, static methods provide a more accessible entry point [5].
When to Prefer Dynamic Regulation
- Processes with Varying Cofactor Demands: If the cell's growth phase and production phase have drastically different NADPH requirements, dynamic regulation is essential to manage the transition without causing toxicity [5].
- Toxic Intermediate or Byproduct Management: Dynamic systems can sense and respond to the accumulation of toxic compounds, downregulating pathways to maintain cell viability, a critical feature for scaling up processes [5].
- High-Value Products Where Yield is Paramount: For commercial production of expensive compounds like pharmaceuticals, the increased implementation complexity of dynamic control is justified by its ability to maximize long-term, stable yield by preserving cell health [5].
Essential Research Tools and Experimental Protocols
Implementing these strategies requires a specific toolkit of reagents, biosensors, and analytical methods.
The Scientist's Toolkit: Key Research Reagents
| Reagent / Solution | Function / Description | Application Context |
|---|---|---|
| iNap1 / NERNST Biosensor | Genetically encoded, ratiometric fluorescent indicator for real-time NADPH monitoring [5] [6]. | Dynamic analysis of cytosolic NADPH levels in live cells. |
| SoNar Indicator | A genetically encoded indicator for monitoring NADH/NAD+ ratios in live cells [6]. | Parallel assessment of NADH redox status. |
| Glucose-6-Phosphate Dehydrogenase (G6PD) | A key enzyme in the oxidative pentose phosphate pathway, crucial for NADPH regeneration; target for static (overexpression) and dynamic (allosteric regulation) control [5] [6]. | Static intervention; its activity is also modulated via S-nitrosylation in dynamic cellular contexts. |
| NADK (NAD Kinase) | Enzyme that phosphorylates NAD+ to generate NADP+; a primary target for static metabolic engineering strategies [5] [26]. | Static intervention to increase the NADPH precursor pool. |
| SoxR Biosensor | A transcription factor-based biosensor that responds specifically to the NADPH/NADP+ ratio in E. coli [5]. | Dynamic regulation system foundation in bacterial hosts. |
Detailed Experimental Protocol: Dynamic NADPH Monitoring
This protocol outlines the methodology for real-time, compartment-specific monitoring of NADPH in endothelial cells, as exemplified by the research using the iNap1 biosensor [6].
- Sensor Expression and Localization: Transfect target cells (e.g., Primary Human Aortic Endothelial Cells - HAECs) with plasmids encoding the iNap1 sensor targeted to specific compartments (e.g., cytosol, mitochondria). A non-responsive variant (iNapc) should be used as a control for normalization and background subtraction [6].
- Microscopy and In-Situ Calibration: Use confocal microscopy to confirm proper subcellular localization. For calibration, permeabilize the plasma membrane (with 0.001% digitonin) or mitochondrial inner membrane (with 0.3% digitonin) and expose the cells to a titration series of known NADPH concentrations. This establishes a standard curve for converting fluorescence ratios to absolute NADPH concentrations [6].
- Image Acquisition and Ratiometric Analysis: Collect fluorescence signals upon excitation at 405 nm (or 420 nm) and 488 nm (or 485 nm). Calculate the ratio (405/488 or 420/485) for each cell or region of interest. This ratio is directly proportional to the NADPH concentration and is less susceptible to artifacts like sensor concentration or cell thickness [6].
- Experimental Intervention and Data Collection: Apply the senescent stimulus (e.g., 2 μM Angiotensin II for 72 hours for HAECs) or other experimental conditions. Continuously or periodically monitor the iNap1 fluorescence ratio. Compare the results to control cells and to measurements taken with the iNapc control sensor [6].
This workflow for dynamic analysis is summarized in the following diagram:
Detailed Experimental Protocol: Network-Based Screening (NADPHnet)
For a more systemic discovery approach, the NADPHnet protocol combines network analysis with virtual screening to identify potential regulators of NADPH metabolism [67].
- Construct the Protein-Protein Interaction (PPI) Network: Compile a comprehensive network of proteins known to be involved in NADPH consumption and production. This can be done by mining databases and existing literature for known interactions [67].
- Identify Key Proteins via GAPR Analysis: Use the Greedy Articulation Points Removal (GAPR) algorithm to analyze the PPI network. This method iteratively identifies and removes "articulation points" (proteins whose removal would fragment the network). These proteins are hypothesized to be critical regulators of the entire NADPH metabolic system [67].
- Build and Analyze Drug-Target Interaction (DTI) Networks: Construct a network linking known drugs and compounds to their protein targets. Use a Network-Based Inference (NBI) method to predict new, potential interactions between compounds and the key NADPH-related proteins identified in step 2 [67].
- Calculate NADPH-Score and Prioritize Compounds: Develop a scoring function (NADPH-Score) that aggregates the predicted effects of a compound across multiple key targets. This score estimates the overall potential of a compound to modulate NADPH metabolism. Compounds with high scores are prioritized for further testing [67].
- In Vitro Validation: Selected top-ranking compounds are then experimentally validated in vitro to measure their actual effects on cellular NADPH levels, as described in the previous protocol [67].
The workflow for this computational and experimental screening is as follows:
The strategic choice between static and dynamic regulation methods is a cornerstone of modern metabolic engineering. Static methods offer a direct, lower-complexity route for initial pathway validation and applications with stable metabolic demands. In contrast, dynamic regulation provides a sophisticated, feedback-driven approach essential for maintaining redox homeostasis, managing metabolic stress, and optimizing long-term production in complex, variable processes. As the field advances, the integration of both strategies—using static constructs to establish pathways and dynamic circuits to optimize their function in real-time—will undoubtedly become the standard for engineering robust, efficient, and scalable microbial cell factories for therapeutic and industrial applications.
This guide provides an objective comparison between static metabolomics and dynamic kinetic modeling for studying NADPH regulation, a critical hub in cellular redox metabolism. Static analyses offer a snapshot of metabolic endpoints, while kinetic models aim to represent the continuous, time-evolving behavior of metabolic networks. The integration of these approaches is pivotal for advancing from correlative observations to a mechanistic understanding of metabolic control in health and disease, ultimately informing drug discovery and metabolic engineering.
Nicotinamide adenine dinucleotide phosphate (NADPH) serves as a fundamental cofactor for redox defense and reductive biosynthesis, connecting central carbon metabolism to the cellular antioxidant system and anabolic processes. Research strategies to understand its regulation can be broadly divided into two paradigms [68]:
- Static (Endpoint) Strategies: These approaches measure metabolite levels, fluxes, and network correlations at a single point in time, typically under steady-state conditions. They are highly applicable for discovering biological hypotheses and generating comparative snapshots (e.g., healthy vs. diseased state).
- Dynamic (Kinetic) Strategies: These approaches focus on the time-resolved behavior of metabolic pathways. They use mathematical models and real-time sensors to characterize how metabolite concentrations and reaction rates change in response to perturbations, aiming to provide a mechanistic explanation of metabolic control.
The following sections objectively compare the methodologies, data requirements, outputs, and applications of these two strategies, providing a framework for selecting the appropriate tool for specific research goals in NADPH biology.
Comparative Analysis of Static vs. Dynamic Methodologies
The table below summarizes the core characteristics of the two methodological approaches for studying NADPH metabolism.
Table 1: Comparison of Static and Dynamic Approaches for NADPH Analysis
| Feature | Static Metabolomics & Flux Analysis | Dynamic Kinetic Modeling & Sensing |
|---|---|---|
| Primary Objective | Discover metabolic variations and generate hypotheses; measure steady-state fluxes [68] [69]. | Characterize mechanistic regulatory logic and predict transient metabolic behaviors [70] [71]. |
| Temporal Resolution | Single time point or steady-state average [68]. | Continuous, high-resolution time-course data [6] [71]. |
| Typical Data | Metabolite concentrations (LC-MS, NMR), metabolic fluxes (13C-tracing), correlation networks [68] [69] [72]. | Time-series concentration data, enzyme kinetic parameters, in vivo sensor readings (e.g., iNap1) [6] [70] [71]. |
| Key Outputs | Differential metabolite lists, correlation networks, pathway enrichment, static flux maps [68] [72]. | Kinetic constants (Km, Vmax), dynamic flux profiles, validated mathematical models, system sensitivities [70] [71] [73]. |
| NADPH-Specific Insights | Identifies correlations between NADPH levels and pathways (e.g., PPP, folate); measures contribution of different pathways to NADPH pool [69] [74]. | Reveals compartment-specific NADPH dynamics (e.g., cytosolic vs. mitochondrial); models NADPH production/consumption cycles [6] [75]. |
| Handling of Nonlinearity | Limited; typically assumes linear correlations, though Mutual Information can be used for nonlinear associations [72]. | Core strength; explicitly models nonlinear enzyme kinetics and system dynamics [70] [71]. |
Experimental Protocols for Key Assays
Protocol for Static Analysis: Deuterium Tracer-Based NADPH Flux Measurement
This protocol quantifies the fractional contribution of different pathways, such as the oxidative Pentose Phosphate Pathway (oxPPP), to cytosolic NADPH production [69].
- Cell Culture and Tracer Application: Grow cells in standard culture medium. Replace the medium with one containing a deuterium-labeled substrate, such as 1-²H-glucose or 3-²H-glucose to probe the oxPPP, or 2,3,3-²H-serine to probe folate metabolism.
- Rapid Metabolite Extraction: At designated time points (e.g., 5-30 minutes), rapidly quench cellular metabolism using cold methanol-acetonitrile or similar extraction buffers. Maintain samples at -80°C.
- LC-MS Analysis for NADPH Labeling:
- Separate extracted NADP+ and NADPH using liquid chromatography (LC).
- Analyze the samples with mass spectrometry (MS) to detect the mass shift in NADPH relative to NADP+, which corresponds to the incorporation of the deuterium atom into the redox-active hydrogen.
- LC-MS Analysis for Substrate Labeling: In parallel, measure the fractional labeling of the precursor substrate pool (e.g., glucose-6-phosphate) using the same LC-MS platform.
- Flux Calculation: Apply the following formula to calculate the fraction of NADPH derived from the oxPPP [69]:
- Fraction from oxPPP = 2 × (NADPH²H / Total NADPH) × (²H-G6P / Total G6P)⁻¹ × CKIE
- CKIE: Correction factor for the deuterium kinetic isotope effect.
Protocol for Dynamic Analysis: Real-Time Compartmental NADPH Monitoring with iNap Sensors
This protocol details the use of genetically encoded sensors to monitor NADPH dynamics in specific subcellular compartments within live cells [6].
- Sensor Expression:
- Transfert cells with plasmids encoding targeted NADPH indicators. Use cyto-iNap1 for cytosolic NADPH and mito-iNap3 for mitochondrial NADPH [6].
- Include a non-responsive control sensor (iNapc) for normalization and background subtraction.
- Live-Cell Imaging and Calibration:
- Culture transfected cells (e.g., Primary Human Aortic Endothelial Cells) on imaging dishes.
- Use a confocal microscope with capabilities for ratiometric imaging. Collect fluorescence upon sequential excitation at 405 nm (or 420 nm) and 488 nm (or 485 nm).
- For in situ calibration, permeabilize the plasma membrane (with 0.001% digitonin) or mitochondrial membrane (with 0.3% digitonin) and expose cells to a range of known NADPH concentrations. This establishes a linear calibration curve between the 405/488 nm fluorescence ratio and NADPH concentration [6].
- Treatment and Time-Lapse Recording:
- Expose cells to experimental stimuli (e.g., Angiotensin II to induce senescence, oxidative stress with diamide, or potential therapeutics like folic acid).
- Record the fluorescence ratio from the sensors in real-time throughout the experiment.
- Data Analysis: Convert the recorded fluorescence ratios into relative NADPH concentrations using the established calibration curve. Analyze the kinetic traces to compare NADPH dynamics between compartments and in response to different treatments.
Visualization of NADPH Metabolic Pathways and Workflows
The following diagrams illustrate the core metabolic pathways for NADPH production and the workflow for integrating static and dynamic data.
Diagram 1: NADPH Production Pathways. Key NADPH-producing pathways include the oxidative Pentose Phosphate Pathway (G6PD) [6] [69], folate metabolism (MTHFD1/2) [6] [69], and other enzymes like Malic Enzyme. Generated NADPH is consumed for redox defense and reductive biosynthesis.
Diagram 2: Integrated Workflow. A synergistic approach combines static endpoint data with dynamic kinetic data to build and validate comprehensive mathematical models of metabolism, bridging the gap between correlation and causation [68] [70].
The Scientist's Toolkit: Key Research Reagents and Solutions
The table below lists essential reagents and computational tools for investigating NADPH metabolism, as featured in the cited studies.
Table 2: Essential Research Reagents and Tools for NADPH Studies
| Reagent / Tool | Function / Application | Example Use Case |
|---|---|---|
| iNap1 / iNapc Sensors | Genetically encoded fluorescent indicators for real-time, compartment-specific NADPH monitoring in live cells [6]. | Differentiating cytosolic vs. mitochondrial NADPH dynamics during endothelial cell senescence [6]. |
| ¹³C & ²H (Deuterium) Labeled Tracers | Stable isotope tracers for quantifying metabolic flux and tracking the origin of NADPH's redox-active hydrogen [69]. | Measuring the fractional contribution of the oxidative PPP and folate metabolism to the total NADPH pool [69]. |
| RENAISSANCE Framework | A generative machine learning framework for efficiently parameterizing large-scale kinetic models of metabolism [70]. | Characterizing intracellular metabolic states in E. coli by integrating diverse omics data and estimating missing kinetic parameters [70]. |
| Metabolite-Metabolite Association Networks | Computational networks using correlation or mutual information to infer relationships between metabolite levels from static data [72]. | Identifying differentially connected metabolites (e.g., glucose, VLDL) in cardiovascular disease networks [72]. |
| G6PD / MTHFD Modulators | Chemical tools or genetic (overexpression/knockdown) approaches to manipulate key NADPH-producing enzymes [6] [69]. | Probing the causal role of G6PD/NADPH axis in vascular aging or confirming NADPH production from folate metabolism [6] [69]. |
Nicotinamide adenine dinucleotide phosphate (NADPH) serves as an essential redox cofactor and electron donor throughout biological systems, playing crucial roles in maintaining antioxidant defenses, supporting reductive biosynthesis, and regulating cellular signaling pathways. The balance of NADPH metabolism has emerged as a critical factor in various disease pathologies, with its dysregulation implicated in conditions ranging from cancer to vascular aging. As research advances, two fundamental strategic approaches have evolved for modulating NADPH homeostasis: static regulation, which involves permanent genetic or enzymatic modifications, and dynamic regulation, which employs real-time monitoring and adjustment of NADPH levels. This review comprehensively compares these contrasting methodologies, evaluates their predictive power in assessing therapeutic efficacy, and examines their applications across different disease models, providing researchers with a framework for selecting appropriate intervention strategies.
Comparative Analysis of Static vs. Dynamic NADPH Regulation Strategies
Table 1: Fundamental Characteristics of Static and Dynamic NADPH Regulation Strategies
| Feature | Static Regulation | Dynamic Regulation |
|---|---|---|
| Definition | Permanent genetic or enzymatic modifications to alter NADPH metabolism | Real-time monitoring and adjustment of NADPH levels using biosensors |
| Key Methods | Overexpression/knockdown of NADPH-producing enzymes (G6PD, IDH, MTHFD); Promoter engineering; Cofactor engineering | Genetically encoded biosensors (iNap, SoNar, NERNST); Feedback-controlled expression systems |
| Temporal Control | Fixed, non-responsive to changing cellular conditions | Responsive, adaptive to real-time NADPH fluctuations |
| Technical Complexity | Moderate to high (depends on genetic manipulation complexity) | High (requires biosensor development and integration) |
| Applications | Bioproduction; Cancer therapy; Metabolic engineering | Precision medicine; Research tools; Advanced metabolic engineering |
| Limitations | Potential metabolic imbalance; Limited adaptability; Cellular stress | Implementation complexity; Potential biosensor latency; Optimization challenges |
Table 2: Predictive Power Assessment in Disease Models
| Disease Model | Regulation Strategy | Key Readouts | Therapeutic Efficacy | Limitations/Challenges |
|---|---|---|---|---|
| Cancer | Static: NAMPT inhibition [62] | NADPH depletion; ROS accumulation; Cell proliferation arrest | Selective toxicity in IDH-mutant cancers; Chemosensitization | Resistance development; Redundancy in NADPH production pathways |
| Dynamic: SoxR biosensor [5] | Real-time NADPH/NADP+ ratio monitoring | Enables real-time metabolic adjustment | Limited to E. coli applications; Requires further validation | |
| Vascular Aging | Static: G6PD overexpression [6] [76] | Cytosolic NADPH elevation; Reduced glutathione; HDAC3 inhibition | Improved endothelial function; Reduced senescence markers; Enhanced vascular reactivity | Potential overshooting of NADPH levels; Off-target effects |
| Dynamic: iNap1 biosensor [6] | Compartment-specific NADPH monitoring (cytosolic vs. mitochondrial) | High-throughput drug screening (e.g., folic acid identification) | Technical complexity for in vivo applications |
Experimental Protocols for NADPH Modulation Studies
Static Regulation via Enzyme Targeting
NAMPT Inhibition in IDH-Mutant Cancers [62]
- Cell Lines: MGG119, MGG152, BT142 glioblastoma; HT1080 fibrosarcoma; SNU484, SNU668 gastric cancer
- Intervention: Treatment with NAMPT inhibitors (FK866, GMX1778) at concentrations ranging 10-100 nM for 24-72 hours
- Controls: IDH-wildtype cell lines with normal NAPRT expression
- NADPH Quantification: Enzymatic cycling assays measuring absorbance at 565 nm
- Viability Assessment: MTT assay at 24, 48, and 72 hours post-treatment
- Validation: siRNA-mediated NAMPT knockdown confirming phenotype specificity
G6PD Overexpression in Vascular Aging Models [6] [76]
- Cell Culture: Primary human aortic endothelial cells (HAECs) cultured under angiotensin II (2 μM, 72 hours) or high glucose (25 mM, 48 hours) conditions
- Genetic Manipulation: Adenoviral transduction for G6PD overexpression; siRNA for G6PD knockdown
- Senescence Markers: β-galactosidase staining; p16 and p21 immunoblotting; SASP factor mRNA quantification (IL-1β, IL-6, IL-8, CXCL1)
- Functional Assays: Glutathione reductase activity; HDAC3 activity; eNOS coupling assessment
- In Vivo Validation: Angiotensin II-infused mice and naturally aged mice (24 months)
Dynamic Regulation Using Biosensors
iNap1-Based NADPH Monitoring [6]
- Sensor Expression: Transduction with cyto-iNap1 (cytosolic) or mito-iNap3 (mitochondrial) variants in HAECs
- Calibration: Permeabilization with 0.001% (plasma membrane) or 0.3% (mitochondrial membrane) digitonin followed by NADPH titration
- Imaging Parameters: Confocal microscopy with 405/488 nm or 420/485 nm excitation; ratio quantification (405/488 or 420/485)
- Pharmacological Screening: Application of 1419 FDA-approved drugs with real-time NADPH monitoring
- Validation: Diamide (100 μM) as oxidant control; specificity confirmation via non-responsive iNapc variant
SoxR Biosensor for NADPH/NADP+ Redox Status [5]
- Sensor System: SoxR transcription factor biosensor specifically responsive to NADPH/NADP+ in E. coli
- Output Measurement: Fluorescence activation under NADPH-reducing conditions
- Applications: Dynamic regulation of NADPH production pathways; Real-time metabolic flux adjustment
NADPH Regulatory Networks and Experimental Workflows
NADPH Metabolism and Regulatory Network
NADPH Metabolic Regulation Network: This diagram illustrates the complex network of NADPH production pathways, biological functions, and regulatory strategies. The pentose phosphate pathway serves as the primary NADPH source, while folate metabolism and IDH reactions provide additional contributions. NADPH utilization spans antioxidant defense, biosynthesis, free radical generation, and detoxification processes. Both static and dynamic regulation strategies can target these pathways to modulate NADPH homeostasis for therapeutic purposes.
NADPHnet Computational Prediction Workflow
NADPHnet Computational Workflow: The NADPHnet platform employs a systematic approach for predicting compounds that modulate NADPH metabolism. Beginning with protein-protein interaction network construction, the method identifies key proteins using the GAPR algorithm, establishes drug-target interaction networks, applies network-based inference for compound prediction, validates interactions through molecular docking, calculates NADPH-Scores, and ultimately proceeds to experimental validation [67].
Biosensor-Based Dynamic Monitoring Workflow
Biosensor Monitoring Workflow: Dynamic NADPH regulation relies on genetically encoded biosensors that enable compartment-specific monitoring of NADPH levels. The process involves biosensor expression, careful calibration using digitonin permeabilization, baseline measurement, therapeutic intervention, real-time monitoring through ratiometric imaging, and comprehensive data analysis [6] [5].
Research Reagent Solutions for NADPH Studies
Table 3: Essential Research Reagents for NADPH Metabolism Studies
| Reagent Category | Specific Examples | Key Applications | Considerations |
|---|---|---|---|
| Genetically Encoded Biosensors | iNap1 (cytosolic), iNap3 (mitochondrial) [6]; SoNar (NADH/NAD+ ratio) [6]; NERNST (roGFP2-based) [5] | Real-time NADPH monitoring; Compartment-specific quantification; High-throughput screening | Requires calibration; Variants optimized for different subcellular localizations |
| Enzyme Inhibitors/Activators | NAMPT inhibitors (FK866) [62]; G6PD modulators; IDH1/2 inhibitors (Ivosidenib) [67] [62] | Pathway-specific NADPH modulation; Therapeutic efficacy testing; Mechanism studies | Selectivity issues; Off-target effects; Concentration-dependent responses |
| Genetic Manipulation Tools | siRNA for G6PD, IDH, NAMPT [6] [62]; Overexpression vectors for G6PD, MTHFD [6] [76] | Target validation; Gain/loss-of-function studies; Pathway manipulation | Efficiency variations; Compensation mechanisms |
| Analytical Kits & Assays | Enzymatic NADPH cycling assays [62]; Glutathione detection kits; ROS probes | Endpoint NADPH quantification; Oxidative stress assessment; Redox status evaluation | Sensitivity limitations; Sample processing requirements |
| Animal Models | Angiotensin II-infused mice [6] [76]; Naturally aged mice (18-24 months) [6]; IDH-mutant xenografts [62] | In vivo therapeutic validation; Age-related studies; Translational research | Cost considerations; Physiological relevance |
Therapeutic Implications and Future Directions
The predictive power of both static and dynamic NADPH regulation strategies continues to evolve, offering complementary approaches for therapeutic development. Static methods provide well-defined, stable modulation suitable for conditions requiring sustained intervention, such as cancer therapies targeting IDH-mutant tumors [62]. Dynamic approaches enable real-time adaptation and precision intervention, particularly valuable for conditions like vascular aging where metabolic flexibility is crucial [6] [5]. The integration of computational prediction platforms like NADPHnet with experimental validation creates a powerful framework for identifying novel therapeutic compounds [67].
Future research directions should focus on enhancing the specificity of NADPH modulation, developing next-generation biosensors with improved sensitivity and temporal resolution, and creating hybrid approaches that combine the stability of static regulation with the adaptability of dynamic systems. The continuing elucidation of compartment-specific NADPH metabolism and its disease-specific alterations will further refine therapeutic targeting strategies, ultimately improving predictive power and clinical translation across diverse pathological conditions.
The journey from a promising in vitro biosensor to a validated in vivo therapeutic application represents a critical pathway in modern biomedical research and drug development. This process requires overcoming significant challenges, including ensuring biosensor stability, biocompatibility, and accurate readout fidelity within complex living systems. The field has witnessed substantial advances through the development of novel nanomaterials, sophisticated genetic encoding strategies, and innovative imaging modalities that collectively bridge the gap between laboratory validation and clinical implementation. Within the specific context of nicotinamide adenine dinucleotide phosphate (NADPH) research, biosensors have become indispensable tools for elucidating redox biology and developing targeted therapies for cancer, metabolic disorders, and neurodegenerative diseases [37] [67] [26]. This guide systematically compares the performance characteristics of leading biosensor technologies, provides detailed experimental protocols for key applications, and visualizes the critical pathways enabling their clinical translation.
Technological Foundations: Comparing Biosensor Platforms
The selection of an appropriate biosensor platform depends critically on the intended application, required spatial and temporal resolution, and the specific biological environment. The table below compares the primary biosensor technologies used in both in vitro and in vivo contexts.
Table 1: Comparison of Major Biosensor Platforms for Clinical Translation
| Biosensor Type | Key Examples | Detection Mechanism | Spatial Resolution | Temporal Resolution | Primary Applications | Clinical Translation Challenges |
|---|---|---|---|---|---|---|
| Genetically Encoded Fluorescent | R-eLACCO2.1 (lactate), iNap (NADPH) | Fluorescence intensity/FRET change upon analyte binding | Cellular to subcellular | Seconds to minutes | Metabolite dynamics, neural activity, redox status | Delivery efficiency, long-term expression stability, immunogenicity [77] |
| Carbon Nanotube-Based | DNA-wrapped SWCNTs | Near-infrared fluorescence quenching | Tissue level (~5mm depth) | Minutes to hours | Nitric oxide, insulin, riboflavin | Potential toxicity concerns, limited quantum yield, signal depth attenuation [78] |
| Fiber Photometry-Compatible | FRET-based GPCR biosensors | Bulk fluorescence recording via fiber optics | Regional (hundreds of cells) | Seconds | GPCR signaling, neurotransmitter release, intracellular second messengers | Invasive implantation, tissue damage, limited to accessible regions [79] |
| Cell-Free Synthetic | Toehold switches, Spinach aptamers | Cell-free expression triggered by analyte | Not applicable | Minutes to hours | Molecular diagnostics, pathogen detection | Limited to in vitro applications, stability of synthetic components [80] |
| Optode Nanosensors | PEG-coated optodes | Ionophore-induced protonation changes with optical readout | Tissue level | Minutes | Ions, small molecules, therapeutic drugs | Skin-depth limitation, calibration drift, biofouling [78] |
Experimental Workflows: From In Vitro Validation to In Vivo Implementation
Development and Optimization of Genetically Encoded Biosensors
The creation of high-performance genetically encoded biosensors like R-eLACCO2.1 follows a systematic workflow combining directed evolution and molecular engineering. The process begins with the initial prototype construction, typically by fusing a circularly permuted fluorescent protein with a selective analyte-binding protein domain. For R-eLACCO2.1, researchers started with the green fluorescent eLACCO1.1 biosensor and replaced its circularly permuted green fluorescent protein with circularly permuted mApple to create a red fluorescent prototype [77]. This initial construct showed minimal fluorescence response (ΔF/F = 0.2), necessitating multiple rounds of directed evolution through random mutagenesis and screening for improved lactate-dependent fluorescence changes. The optimized R-eLACCO2.1 variant emerged with 25 beneficial mutations and a dramatically improved ΔF/F of 18, representing a 90-fold enhancement from the original prototype [77].
Critical to in vivo performance is the optimization of cellular localization. For extracellular biosensors like R-eLACCO2.1, this involves systematic screening of leader sequences and anchor domains. Researchers evaluated 14 leader sequences combined with 4 anchor domains, finding that GPI-based anchors (particularly CD59, COBRA, and GFRA1) combined with specific leader sequences (HA, Igκ, and pat-3) provided optimal cell surface localization and brightness [77]. This careful optimization enables the biosensor to be positioned correctly for monitoring extracellular analyte dynamics in living organisms.
Diagram 1: Biosensor Translation Workflow (63 characters)
Fiber Photometry for In Vivo Biosensor Recording
Fiber photometry provides a robust methodology for recording biosensor signals in awake, behaving animals. The experimental protocol begins with intracerebral infusion of adeno-associated viruses (AAVs) encoding FRET-based biosensors into target brain regions, allowing for cell-type-specific expression [79]. After 3-6 weeks for adequate biosensor expression, a fiberoptic cannula is surgically implanted above the target region. For recording sessions, animals are connected to a fiber photometry system that delivers excitation light and collects emitted fluorescence through the same optical fiber.
The critical technical considerations include:
- Biosensor Selection: FRET-based biosensors are preferred for fiber photometry due to their rationetric properties, which minimize motion artifacts and normalize for expression differences [79].
- Viral Titer Optimization: Using appropriate AAV serotypes (e.g., AAV1, AAV5, or AAV9) and titers (typically 10¹² - 10¹³ GC/mL) to achieve sufficient expression without cytotoxicity [79].
- Fiber Placement: Precise stereotaxic coordinates determined with reference to anatomical landmarks, with post-mortem histology validation.
- Signal Processing: Calculation of the FRET ratio (typically emission at 535 nm/480 nm with 430 nm excitation) to normalize for biosensor concentration and path length [79].
This methodology enables real-time monitoring of intracellular signaling dynamics—such as GPCR activity, second messenger production, or metabolic changes—while simultaneously recording behavioral outputs in freely moving animals.
NADPH Biosensing: Connecting Redox Regulation to Therapeutic Outcomes
Static vs. Dynamic NADPH Regulation Strategies
In the context of NADPH metabolism, biosensors have revealed critical limitations of traditional static regulation approaches and enabled the development of sophisticated dynamic regulation strategies. Static regulation, including promoter engineering, overexpression of NADPH-producing enzymes (e.g., glucose-6-phosphate dehydrogenase, isocitrate dehydrogenase), and modulation of competing pathways, often leads to NADPH/NADP+ imbalance that disrupts cellular growth and productivity [37]. These approaches cannot adapt to varying intracellular NADPH demands at different culture times or environmental conditions.
Dynamic regulation strategies leverage genetically encoded biosensors to maintain NADPH homeostasis through real-time monitoring and adjustment. The transcription factor SoxR functions as a natural NADPH biosensor in E. coli, while engineered tools like the NERNST biosensor (based on roGFP2 and NADPH-thioredoxin reductase C) enable rationetric monitoring of NADPH/NADP+ redox status across organisms [37]. These biosensors can be integrated with synthetic genetic circuits to dynamically control flux through NADPH-producing pathways such as the oxidative pentose phosphate pathway and Entner-Doudoroff pathway [37].
Diagram 2: NADPH Metabolic Network (24 characters)
NADPH-Targeted Therapeutic Applications
The application of NADPH biosensing has identified promising therapeutic avenues across multiple disease contexts:
Cancer Therapy: Cancer cells often exhibit increased flux through NADPH-producing pathways to support rapid proliferation and combat oxidative stress. NADPH biosensors have revealed that inhibitors targeting NADPH metabolism, such as the IDH2 mutant inhibitor enasidenib, can effectively induce differentiation in acute myeloid leukemia cells [67]. The NADPHnet computational platform further enables network-based prediction of natural products that modulate NADPH metabolism, identifying compounds like oxyberberine with anti-cancer potential [67].
Metabolic Disorders: In diabetes, NADPH biosensors have uncovered disrupted redox balance and compromised antioxidant defense systems. Biosensor-enabled studies show that maintaining normal NADPH/NADP+ ratios is essential for proper insulin signaling and glucose homeostasis [26]. Dynamic regulation strategies that optimize NADPH regeneration present novel approaches for restoring metabolic function.
Neurodegenerative Diseases: The NERNST biosensor has enabled monitoring of NADPH dynamics in neuronal models, revealing how redox imbalances contribute to pathological processes in Alzheimer's disease and amyotrophic lateral sclerosis [37]. These insights guide therapeutic strategies aimed at enhancing NADPH-dependent antioxidant systems in vulnerable neuronal populations.
The Scientist's Toolkit: Essential Research Reagents and Platforms
Table 2: Essential Research Tools for Biosensor Development and Application
| Research Tool | Specific Examples | Primary Function | Key Considerations |
|---|---|---|---|
| Genetically Encoded Biosensors | R-eLACCO2.1, iNap, GCaMP | Real-time monitoring of metabolites, ions, and signaling molecules | Spectral properties, dynamic range, affinity, targeting specificity [77] |
| Viral Delivery Systems | AAV1, AAV5, AAV9 | Efficient biosensor delivery to specific cell types | Tropism, payload capacity, immunogenicity, expression duration [79] |
| Fiber Photometry Systems | Commercial (Tucker-Davis) or custom setups | In vivo recording of biosensor signals in behaving animals | Excitation wavelengths, detection sensitivity, multi-channel capability [79] |
| Cell-Free Expression Systems | PURExpress, reconstituted transcription-translation systems | Rapid biosensor validation and diagnostic applications | Cost, productivity, stability, freedom from cellular permeability barriers [80] |
| Nanomaterial Scaffolds | Single-walled carbon nanotubes, alginate hydrogels | Enhanced biosensor stability and implantation | Biocompatibility, functionalization chemistry, retention time [78] |
| Computational Prediction Platforms | NADPHnet, network-based inference | Identification of biosensor targets and modulator compounds | Accuracy, applicability domain, incorporation of systems biology [67] |
The integration of advanced biosensing platforms with therapeutic development continues to accelerate, with emerging trends including multi-analyte sensing, minimally invasive implantation, and closed-loop systems that dynamically adjust therapies based on real-time physiological monitoring. The successful clinical translation of biosensor technologies will increasingly depend on interdisciplinary collaboration across materials science, molecular engineering, systems biology, and clinical medicine. As biosensor performance continues to improve through innovations in both in vitro design and in vivo implementation, these powerful tools will undoubtedly unlock new therapeutic paradigms for a broad spectrum of human diseases, with NADPH-centric approaches offering particular promise for metabolic and age-related disorders.
Reduced nicotinamide adenine dinucleotide phosphate (NADPH) serves as a crucial redox cofactor and reducing agent in metabolic networks, playing an essential role in antioxidant defense, reductive biosynthesis, and cellular signaling. The balance between NADPH and its oxidized form (NADP+) is critical for maintaining cellular redox homeostasis, and its dysregulation is implicated in various diseases and bioproduction limitations. Research strategies for modulating this balance have evolved along two primary pathways: static regulation and dynamic regulation [5].
Static regulation encompasses traditional metabolic engineering approaches that introduce fixed, constitutive genetic modifications to redirect metabolic flux toward NADPH regeneration. While these methods have demonstrated utility, they often lead to NADPH/NADP+ imbalance because they cannot adjust intracellular NADPH levels in real-time according to fluctuating cellular demands. This inflexibility can cause metabolic burdens, disrupt normal cell growth, and ultimately limit production yields in biotransformation processes [5].
Dynamic regulation represents a more advanced strategy that enables real-time monitoring and adjustment of intracellular NADPH levels. This approach typically utilizes genetically encoded biosensors that respond to the NADPH/NADP+ ratio, allowing cells to autonomously regulate NADPH-regenerating pathways in response to metabolic needs. The integration of these biosensors with multi-omics data—including genomics, transcriptomics, proteomics, and metabolomics—provides a comprehensive systems biology framework for understanding NADPH regulation across multiple molecular layers [5] [6].
The emerging integration of dynamic NADPH imaging with multi-omics technologies represents a transformative approach that captures spatial and temporal dimensions of NADPH metabolism previously inaccessible to researchers. This guide compares the performance of static and dynamic NADPH regulation strategies while providing detailed experimental protocols for implementing these advanced methodologies.
Comparative Analysis of NADPH Regulation Strategies
Table 1: Comparison of Static versus Dynamic NADPH Regulation Strategies
| Feature | Static Regulation | Dynamic Regulation |
|---|---|---|
| Regulatory Principle | Fixed genetic modifications | Real-time feedback control |
| Temporal Response | Constant regardless of cellular state | Responsive to metabolic demands |
| Key Methods | Promoter engineering, enzyme overexpression, pathway knockout [5] | Genetically encoded biosensors (e.g., iNap, SoxR, NERNST) [5] [6] |
| NADPH/NADP+ Balance | Often imbalanced, causing metabolic stress [5] | Maintains homeostasis through adjustment |
| Technical Requirements | Standard genetic engineering | Biosensor development, multi-omics integration |
| Applications | Baseline metabolic engineering | Advanced bioproduction, disease modeling, drug discovery |
| Multi-Omics Integration | Post-hoc analysis | Real-time correlation with metabolic status |
| Limitations | Cannot adapt to changing demands | Complexity of implementation, potential sensor interference |
Experimental Protocols for Dynamic NADPH Studies
Genetically Encoded NADPH Biosensor Implementation
The implementation of genetically encoded NADPH biosensors enables real-time monitoring of NADPH dynamics in live cells. The following protocol outlines the key steps for utilizing these tools in endothelial cells, though it can be adapted for other cell types [6]:
Materials Required:
- Genetically encoded NADPH indicators (iNap1 for cytosol, mito-iNap3 for mitochondria)
- Appropriate expression vectors (e.g., adenoviral, lentiviral)
- Primary Human Aortic Endothelial Cells (HAECs)
- Confocal microscopy system with 405/488 nm excitation capabilities
- Digitonin (0.001% for plasma membrane permeabilization, 0.3% for mitochondrial membrane)
- NADPH solutions for calibration (0-1000 μM range)
Procedure:
- Sensor Expression: Transduce HAECs with NADPH indicators targeted to specific subcellular compartments (cytosol or mitochondria) using appropriate viral delivery systems.
- Microscopy Setup: Configure confocal microscopy to collect fluorescence emissions upon 405 nm (or 420 nm) and 488 nm (or 485 nm) excitation.
- In Situ Calibration: Permeabilize cellular membranes with digitonin to expose sensors to controlled NADPH concentrations. Generate a standard curve by measuring fluorescence ratios (405/488 or 420/485) across NADPH concentrations.
- Experimental Monitoring: Capture real-time NADPH fluctuations in response to experimental conditions (e.g., angiotensin II induction, drug treatments).
- Data Normalization: Use non-responsive sensor variants (iNapc) to control for non-specific fluorescence changes.
- Validation: Confirm NADPH specificity by testing sensor response to diamide (oxidant) and other metabolic perturbations.
This protocol has revealed compartment-specific NADPH dynamics, demonstrating that cytosolic NADPH levels increase during endothelial cell senescence while mitochondrial NADPH remains relatively stable [6].
Multi-Omics Integration for NADPH Regulation Analysis
The INTEGRATE pipeline provides a computational framework for combining metabolomics and transcriptomics data using constraint-based stoichiometric metabolic models as a scaffold. This approach helps disentangle the interdependence between different regulatory layers controlling metabolism [81].
Materials Required:
- Transcriptomics data (RNA-seq microarray)
- Metabolomics data (LC-MS, GC-MS)
- Constraint-based metabolic model specific to studied organism
- Computational resources for flux balance analysis
- Software platforms (Python/R implementations of INTEGRATE)
Procedure:
- Data Acquisition: Collect paired transcriptomics and metabolomics datasets from experimental conditions of interest (e.g., normal vs. cancer cell lines).
- Reaction Expression Calculation: Compute differential reaction expression from transcriptomics data using Gene-Protein-Reaction associations encoded in metabolic models.
- Flux Prediction: Use constraint-based modeling to predict how differential expression of metabolic enzymes translates to differences in metabolic fluxes.
- Metabolomic Integration: Incorporate metabolomics data to assess how differences in substrate availability affect metabolic fluxes.
- Regulatory Layer Discrimination: Identify reactions regulated at metabolic versus gene expression levels by intersecting transcriptomics and metabolomics predictions.
- Validation: Compare predictions against direct flux measurements or genetic perturbation studies.
This methodology has been successfully applied to characterize metabolic regulation in breast cancer cell lines, identifying reactions controlled primarily at metabolic versus transcriptional levels [81].
Visualization of Workflows and Pathways
Dynamic NADPH Imaging Workflow
Diagram Title: Dynamic NADPH Imaging Workflow
NADPH Metabolism and Regulation Pathways
Diagram Title: NADPH Metabolic Sources and Sinks
The Scientist's Toolkit: Essential Research Reagents
Table 2: Key Research Reagents for NADPH and Multi-Omics Studies
| Reagent/Category | Specific Examples | Function/Application |
|---|---|---|
| NADPH Biosensors | iNap1, mito-iNap3, SoxR, NERNST [5] [6] | Real-time monitoring of NADPH levels in specific cellular compartments |
| Metabolic Modulators | Diamide (oxidant), Angiotensin II, High Glucose [6] | Induce metabolic perturbations for studying NADPH stress responses |
| Omics Technologies | RNA-seq, LC-MS/MS metabolomics, spatial transcriptomics [81] [82] | Comprehensive molecular profiling across biological layers |
| Computational Tools | INTEGRATE pipeline, constraint-based modeling, AI/ML algorithms [81] [83] | Data integration and prediction of metabolic flux regulation |
| Validation Reagents | G6PD overexpression/knockdown constructs, HDAC3 inhibitors [6] | Functional validation of NADPH-related mechanisms |
The integration of dynamic NADPH imaging with multi-omics data represents a paradigm shift in metabolic regulation research, moving from static snapshots to dynamic, systems-level understanding. While static regulation methods provide foundational engineering strategies, dynamic approaches enable real-time monitoring and adjustment of NADPH metabolism that better reflects biological complexity. The experimental protocols and tools outlined in this guide provide researchers with practical methodologies for implementing these advanced approaches.
Future developments will likely focus on enhancing the spatial resolution of NADPH imaging, improving multi-omics integration algorithms, and developing more sensitive and specific biosensors. These advancements will further accelerate applications in drug discovery, metabolic engineering, and personalized medicine, ultimately enabling more precise manipulation of NADPH-dependent processes for therapeutic and bioproduction purposes [5] [6] [83].
Conclusion
The comparison between static and dynamic NADPH regulation strategies reveals that they are not mutually exclusive but are powerfully complementary. Static methods provide a essential snapshot of metabolic capacity, while dynamic biosensors unveil the real-time, subcellular flux that governs cellular decisions in health and disease. The integration of both approaches is critical for a holistic understanding, as demonstrated by recent findings of elevated cytosolic NADPH during endothelial senescence and the discovery of folic acid as a potential therapeutic. For future biomedical research, the path forward lies in leveraging dynamic profiling to identify novel, context-dependent drug targets and to design sophisticated multi-target interventions that precisely rewire NADPH metabolism in specific cellular compartments. This refined approach holds immense promise for developing next-generation therapies for cancer, neurodegenerative diseases, and age-related vascular decline.
References
- 1. NADPH—The Forgotten Reducing Equivalent - PMC [https://pmc.ncbi.nlm.nih.gov/articles/PMC8168431/]
- 2. NADPH homeostasis in cancer: functions, mechanisms ... [https://www.nature.com/articles/s41392-020-00326-0]
- 3. Hyperphosphataemia and NADPH Oxidase Regulation in ... [https://www.mdpi.com/2076-3921/14/4/461]
- 4. Enhancing NADPH to restore redox homeostasis and ... [https://pmc.ncbi.nlm.nih.gov/articles/PMC11903804/]
- 5. Dynamic and Static Regulation of Nicotinamide Adenine ... [https://pmc.ncbi.nlm.nih.gov/articles/PMC11314019/]
- 6. Elevating cytosolic NADPH metabolism in endothelial cells ... [https://www.nature.com/articles/s41467-025-64652-z]
- 7. Static and Dynamic Projections of Drug-Drug Interactions ... [https://www.sciencedirect.com/science/article/abs/pii/S0090955624080917]
- 8. Pentose phosphate pathway [https://en.wikipedia.org/wiki/Pentose_phosphate_pathway]
- 9. Pentose Phosphate Pathway: Steps, Diagram, Uses [https://microbenotes.com/pentose-phosphate-pathway/]
- 10. Folate Metabolism - an overview [https://www.sciencedirect.com/topics/medicine-and-dentistry/folate-metabolism]
- 11. Cryo-EM structure and regulation of human NAD kinase [https://pubmed.ncbi.nlm.nih.gov/39854463/]
- 12. NADK Governs Ferroptosis Susceptibility by Orchestrating ... [https://www.mdpi.com/2076-3921/14/12/1396]
- 13. Cytosolic and Mitochondrial NADPH Fluxes Are ... [https://pmc.ncbi.nlm.nih.gov/articles/PMC12175224/]
- 14. Tracing Compartmentalized NADPH Metabolism in the ... [https://www.sciencedirect.com/science/article/pii/S109727651400402X]
- 15. Hoxhaj Lab discovers how mitochondria use NADPH to ... [https://cri.utsw.edu/hoxhaj-lab-discovers-how-mitochondria-use-nadph-to-fuel-fatty-acid-synthesis-lipoylation/]
- 16. Cytoplasmic and Mitochondrial NADPH-Coupled Redox ... [https://www.mdpi.com/2072-6643/11/3/504]
- 17. Cellular pan-chain acyl-CoA profiling reveals SLC25A42/ ... [https://www.nature.com/articles/s42255-025-01358-y]
- 18. Spectrophotometric assays for measuring redox biomarkers in ... [https://pmc.ncbi.nlm.nih.gov/articles/PMC6748689/]
- 19. Extraction and Quantitation of Nicotinamide Adenine ... [https://pmc.ncbi.nlm.nih.gov/articles/PMC5737638/]
- 20. Investigating mitochondrial redox state using NADH and ... [https://www.sciencedirect.com/science/article/pii/S0891584916303926]
- 21. Assessment of Cellular Redox State Using NAD(P)H ... [https://en.bio-protocol.org/en/bpdetail?id=2105&type=0]
- 22. Measuring the rate of NADPH consumption by glutathione ... [https://journals.plos.org/plosone/article?id=10.1371/journal.pone.0309886]
- 23. Dynamic Activation of NADPH Oxidases in Immune ... [https://pubmed.ncbi.nlm.nih.gov/39931760/]
- 24. The multi-faceted role of NADPH in regulating inflammation ... [https://www.frontiersin.org/journals/immunology/articles/10.3389/fimmu.2023.1328484/full]
- 25. A family of NADPH/NADP+ biosensors reveals in vivo ... [https://www.nature.com/articles/s41467-024-55302-x]
- 26. Homeostatic regulation of NAD(H) and NADP(H) in cells [https://www.sciencedirect.com/science/article/pii/S2352304223004294]
- 27. A direct comparison of liquid chromatography-mass ... [https://link.springer.com/article/10.1007/s00216-019-01724-2]
- 28. Development of a novel liquid chromatography-tandem ... [https://www.nature.com/articles/s41598-025-07926-2]
- 29. Comparison of colorimetric, fluorometric, and liquid ... - PubMed [https://pubmed.ncbi.nlm.nih.gov/37398224/]
- 30. Two Different Methods of Quantification of Oxidized ... [https://en.bio-protocol.org/en/bpdetail?id=2937&type=0]
- 31. Metabolic Signatures of Performance in Elite World Tour ... [https://pmc.ncbi.nlm.nih.gov/articles/PMC10163861/]
- 32. Development and validation of ultra-performance liquid ... [https://www.sciencedirect.com/science/article/pii/S1570023224003866]
- 33. Single-cell imaging of liver metabolic dynamics using ... [https://www.sciencedirect.com/science/article/pii/S1043276025002243?dgcid=rss_sd_all]
- 34. SoNar, a highly responsive NAD+/NADH sensor, allows high ... [https://pmc.ncbi.nlm.nih.gov/articles/PMC4427571/]
- 35. Semisynthetic biosensors for mapping cellular ... [https://elifesciences.org/articles/32638]
- 36. Monitoring NAD(H) and NADP(H) dynamics during ... [https://pmc.ncbi.nlm.nih.gov/articles/PMC8807777/]
- 37. Dynamic and Static Regulation of Nicotinamide Adenine ... [https://www.mdpi.com/1420-3049/29/15/3687]
- 38. The role of NAD+ metabolism and its modulation ... [https://www.nature.com/articles/s44324-025-00067-0]
- 39. Drug Screening with Genetically Encoded Fluorescent Sensors [https://pmc.ncbi.nlm.nih.gov/articles/PMC7794770/]
- 40. Construction of genetically encoded biosensors for ... [https://www.biophysics-reports.org/article/doi/10.52601/bpr.2025.250008]
- 41. Design of a genetically encoded biosensor to establish ... [https://www.sciencedirect.com/science/article/abs/pii/S1096717622000945]
- 42. Advances in the dynamic control of metabolic pathways ... [https://www.sciencedirect.com/science/article/pii/S2667370323000358]
- 43. NADPHnet: a novel strategy to predict compounds for ... [https://pubmed.ncbi.nlm.nih.gov/38902503/]
- 44. Leveraging network pharmacology for drug discovery [https://www.sciencedirect.com/science/article/pii/S259009862500017X]
- 45. Network Pharmacology as a Tool to Investigate the ... [https://pmc.ncbi.nlm.nih.gov/articles/PMC12295404/]
- 46. Network pharmacology-based approach to research the ... [https://www.frontiersin.org/journals/medicine/articles/10.3389/fmed.2025.1569590/full]
- 47. Integrated network pharmacology reveals the mechanism of ... [https://bmccomplementmedtherapies.biomedcentral.com/articles/10.1186/s12906-025-04928-5]
- 48. Artificial intelligence-driven dynamic regulation for high ... [https://pubs.rsc.org/en/content/articlehtml/2025/gc/d5gc02507a]
- 49. Mitochondrial dysfunction: mechanisms and advances in ... [https://www.nature.com/articles/s41392-024-01839-8]
- 50. Tracing compartmentalized NADPH metabolism in the cytosol ... [https://pmc.ncbi.nlm.nih.gov/articles/PMC4106038/]
- 51. Dynamic control over feedback regulatory mechanisms ... [https://pmc.ncbi.nlm.nih.gov/articles/PMC12521971/]
- 52. Simultaneous in vivo multi-organ fluxomics reveals ... [https://www.sciencedirect.com/science/article/pii/S2211124725003626]
- 53. NFATc1-mediated activation of the pentose phosphate ... [https://www.nature.com/articles/s41389-025-00581-2]
- 54. Activation of the pentose phosphate pathway flux by ... [https://pubmed.ncbi.nlm.nih.gov/41243119/]
- 55. Pro-Oxidant and Antioxidant Balance, Anthropometric ... [https://brieflands.com/journals/zjrms/articles/58553]
- 56. NADPH Oxidases: From Molecular Mechanisms to Current ... [https://pmc.ncbi.nlm.nih.gov/articles/PMC10510401/]
- 57. Antioxidant and Pro-Oxidant Properties of Selected Clinically ... [https://pmc.ncbi.nlm.nih.gov/articles/PMC11510234/]
- 58. Antioxidant and Pro-Oxidant Properties of Selected ... [https://www.mdpi.com/1424-8247/17/10/1257]
- 59. Free radicals and their impact on health and antioxidant ... [https://www.nature.com/articles/s41420-024-02278-8]
- 60. Review Article NADPH oxidases as drug targets and ... [https://www.sciencedirect.com/science/article/pii/S0891584917307220]
- 61. Pro-oxidant/antioxidant balance controls pancreatic β-cell ... [https://www.nature.com/articles/cddis2014441]
- 62. NAD- and NADPH-Contributing Enzymes as Therapeutic ... [https://pmc.ncbi.nlm.nih.gov/articles/PMC7175141/]
- 63. Mitochondrial NADPH propels oxidative metabolism - PMC [https://pmc.ncbi.nlm.nih.gov/articles/PMC12507123/]
- 64. Developing a Redox Imbalance Forces Drive (RIFD) ... [https://www.sciencedirect.com/science/article/abs/pii/S1096717625001181]
- 65. Dynamic and Static Regulation of Nicotinamide Adenine ... [https://www.semanticscholar.org/paper/Dynamic-and-Static-Regulation-of-Nicotinamide-and-Ding-Yuan/3abbcdd2e6e001f39b887e6843f4f4c4396348e2]
- 66. Visualizing subcellular changes in the NAD(H) pool size ... [https://www.nature.com/articles/s42003-024-06123-7]
- 67. NADPHnet: a novel strategy to predict compounds for ... [https://pmc.ncbi.nlm.nih.gov/articles/PMC11420228/]
- 68. From correlation to causation: analysis of metabolomics data using systems biology approaches - PMC [https://www.ncbi.nlm.nih.gov/pmc/articles/PMC5829120/]
- 69. Quantitative flux analysis reveals folate-dependent NADPH ... [https://pmc.ncbi.nlm.nih.gov/articles/PMC4104482/]
- 70. Generative machine learning produces kinetic models that ... [https://www.nature.com/articles/s41929-024-01220-6]
- 71. Modeling and Classification of Kinetic Patterns of Dynamic ... [https://pmc.ncbi.nlm.nih.gov/articles/PMC4552566/]
- 72. On the Use of Correlation and MI as a Measure of Metabolite—Metabolite Association for Network Differential Connectivity Analysis - PMC [https://pmc.ncbi.nlm.nih.gov/articles/PMC7241243/]
- 73. Kinetic models of metabolism that consider alternative ... [https://www.sciencedirect.com/science/article/pii/S1096717618302933]
- 74. Metabolic flux analysis and the NAD(P)H/NAD(P)+ ratios in ... [https://microbialcellfactories.biomedcentral.com/articles/10.1186/s12934-018-0860-8]
- 75. 13C-flux Analysis Reveals NADPH-balancing ... [https://www.sciencedirect.com/science/article/pii/S0021925820478196]
- 76. Elevating cytosolic NADPH metabolism in endothelial cells ... [https://pubmed.ncbi.nlm.nih.gov/41184229/]
- 77. A red fluorescent genetically encoded biosensor for in vivo ... [https://www.nature.com/articles/s41467-025-64484-x]
- 78. In vivo biosensing: progress and perspectives - PMC [https://pmc.ncbi.nlm.nih.gov/articles/PMC5520645/]
- 79. In vivo detection of GPCR-dependent signaling using fiber ... [https://www.sciencedirect.com/science/article/abs/pii/S1046202321001286]
- 80. In Vitro Use of Cellular Synthetic Machinery for Biosensing ... [https://www.frontiersin.org/journals/pharmacology/articles/10.3389/fphar.2019.01166/full]
- 81. INTEGRATE: Model-based multi-omics data ... - PubMed Central [https://pmc.ncbi.nlm.nih.gov/articles/PMC8853556/]
- 82. How multi-omics may transform drug development [https://www.astrazeneca.com/content/astraz/what-science-can-do/topics/disease-understanding/new-era-multi-omic-data-analysis-oncology.html]
- 83. Advancing drug discovery through multiomics [https://www.ddw-online.com/advancing-drug-discovery-through-multiomics-37448-202510/]